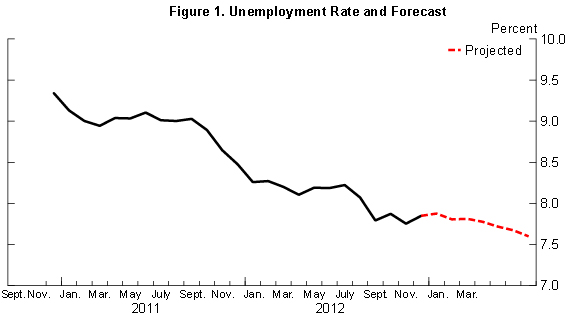
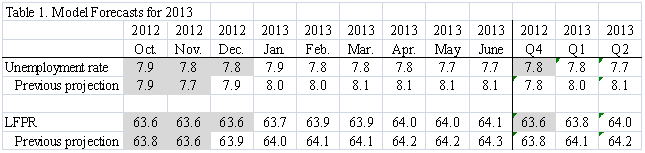
The unemployment rate in December was unchanged from November at 7.8 percent, suggesting little effect of hurricane Sandy on the labor market. That conclusion is premature however. A look at the flows behind the unemployment rate shows that the unemployment rate held steady because two forces compensated each other. Hurricane Sandy led many people to leave the labor force in November, which pushed down the unemployment rate at the time. In December, that phenomenon reverted, which should have pushed up the unemployment rate. However, more people found jobs in December, which pushed the unemployment rate down, so that overall, the unemployment rate was unchanged. With the aftermaths of Sandy now likely over, I project a slow but steady improvement in the labor market and an unemployment rate of 7.7% in June 2013.
This post discusses my monthly update of the Barnichon-Nekarda model. For an introduction to the basic concepts used in this post, read my introductory post (Full details are available here.)
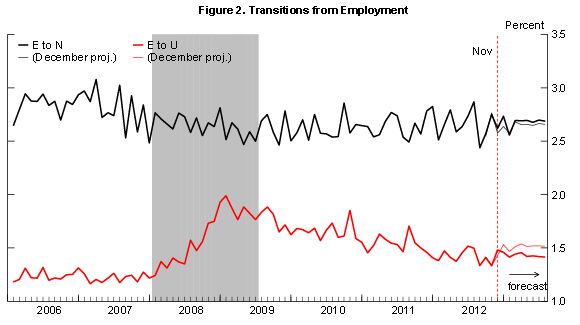
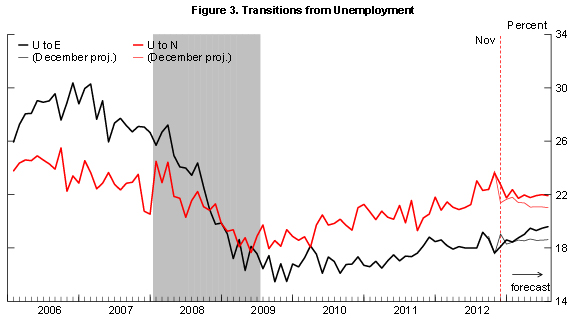
The unemployment rate held steady at 7.8% between December and November, whose rate was revised up from 7.7 percent. Digging into the underlying flows—shown in figures 2 through 4 (thick lines)—the unchanged unemployment level reflects the acting of two compensating forces. In November, many unemployed people unexpectedly left the labor force (U-N transitions, figure 3) —probably because of hurricane Sandy (as unemployed may have had to postpone job search)—, but that phenomenon reverted in December. Ceteris paribus, this should have increased the unemployment rate. However, at the same time, job creation improved, and the job finding rate (U-E) ticked up, which pushed the unemployment rate down. These two forces compensated each other, and the unemployment rate was unchanged.
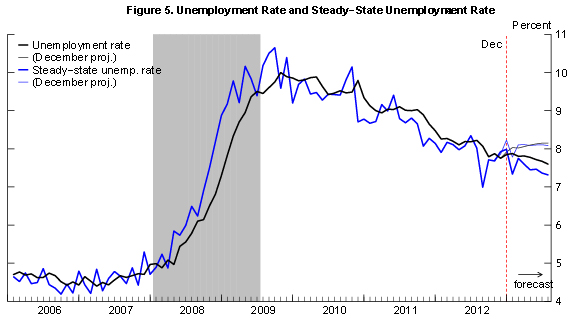
Going forward, I anticipate the improvements in the labor market to continue and the unemployment rate to decline (albeit slowly) and reach 7.7 by June 2013. The intuition for this forecast is easily understood by looking at the projected behavior of the “steady-state” unemployment rate. The steady-state unemployment rate, the rate of unemployment implied by the underlying labor force flows—the blue line in figure 5—is projected to decrease sizably over the next 6 months. Our research shows that the actual unemployment rate converges toward this steady state. At the current level of 7.9 percent, the unemployment rate is slightly above its projected steady-state rate. Thus, I anticipate the unemployment rate to increase to 7.9% next month. However, unlike in November, the model now sees improvements on the hiring and layoff fronts, and the steady-state rate is now projected to decline sizably over the next 6 months. Thus, past a temporary uptick, I anticipate the unemployment rate to decline steadily in the near future.
More precisely, the model propagates forward its best estimate for how the flows between employment, unemployment and out-of-the labor force will evolve over time, and constructs the implications for the unemployment rate. In December, job openings have increased, and new claims for unemployment insurance reverted their large November spike (again, likely related to Sandy). Consequently, the model now projects sizable improvements in workers’ job finding rates (figure 3) over the next 6 months, and the outlook for the job separation rate (or layoffs) is considerably less bleak than in November (figure 2). As a result, the steady-state unemployment rate is now projected to decline to 7.3% by June 2013, bringing the unemployment rate down with it.
To read more about the underlying model and the evidence that it outperforms other unemployment rate forecasts, see Barnichon and Nekarda (2012).
The Brookings Institution is committed to quality, independence, and impact.
We are supported by a diverse array of funders. In line with our values and policies, each Brookings publication represents the sole views of its author(s).


Commentary
Steady Unemployment Rate Masks Encouraging Improvements in the Labor Market
January 4, 2013