Workers in the United States without full proficiency in English are found in a variety of occupations and industries, represent a wide swath of origin countries and cultures, and have varying levels of income. As Jill Wilson, a senior research analyst and associate fellow in the Metropolitan Policy Program, finds in her new report on English skills, English proficiency is a strong predictor of economic standing among immigrants regardless of educational attainment. “National, state, and regional leaders,” Wilson argues, “have an opportunity to enhance the human capital and economic mobility of their current and future workforce by investing in adult English instruction through more funding, targeted outreach, and innovative instruction.”
Access her analysis, data and charts here. Below are six questions, the answers to which offer an introduction to the more extensive report.
What does “Limited English Proficiency” mean and how is it measured?
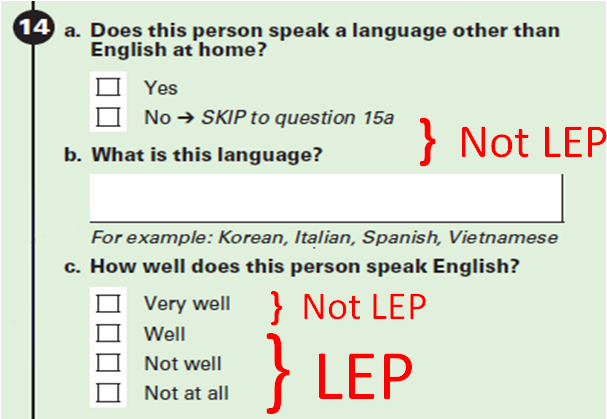
Wilson explains how the U.S. Census Bureau, through the annual American Community Survey (and via the decennial Census from 1890 to 2000), asks survey recipients if they speak a language other than English at home. If the answer is “Yes,” the next question is what language, and then “How well does this person speak English?” See below. Any answer other than “Very well” defines the respondent as Limited English Proficient.
In her analysis, Wilson offers a number of observations and caveats about this definition, yet notes that the “ACS data remain the chief source of current information about the LEP population in the United States.”
How many LEP workers are there?
According to Wilson, nearly one in 10 working-age U.S. adults (19.2 million people aged 16 to 64) is limited English proficient. Out of a total population of about 25 million LEP individuals aged 5 or older, 9 percent are children aged 5 to 15 and 15 percent are aged 65 or older.
LEP workers are not all the same. Sixty percent are high school graduates, including 15 percent with a college degree. However, among full-time, year-round workers, LEP workers have lower earnings at every level of educational attainment. The median earnings of English proficient workers are 39 percent higher than LEP workers overall, and 30 percent higher among those with bachelor’s degrees.
Are LEP persons all immigrants?
Actually, no, writes Wilson. Her data show that 13 percent of the LEP population is native-born, half of whom were born in California, Texas, or Puerto Rico. Of the native-born LEP adults, 77 percent speak Spanish, 3 percent speak French, and 3 percent speak German. Those born in Puerto Rico, a U.S. territory, are U.S. citizens but Spanish is the primary language used in public schools and life on the island. Subsequently, over 80 percent of Puerto Rico’s residents are LEP.
Estimates suggest that about a third of LEP persons may be unauthorized immigrants, and the rest are naturalized citizens, legal permanent residents, or legal temporary residents.
Wilson has some additional interesting analysis on when immigrants came to the United States and how their time of arrival affects their English proficiency.
Why don’t they “just learn English?”
“Assuming that immigrants will ‘pick up the language,’ while proving true in the long run,” Wilson writes, “is not an efficient strategy for improving labor market outcomes in the shorter term.” Doing so “delays their economic (not to mention social and civic) integration.” New immigrants, as Wilson demonstrates, are much less likely to be English proficient than older arrivals. The newer ones (those who entered since 1999), make up 36 percent of working-age immigrants to the U.S.
Wilson explains how the main source of federal funding for adult education, including English instruction—Title II of the Workforce Investment Act (a.k.a., AEFLA)—is “severely underfunded, serving a small fraction of the nation’s low-skilled adults.” She notes that the number of adults served by English language and civics training programs has dropped from 1.1 million earlier in the 2000s to about 700,000 in 2011. Also, states have traditionally contributed about three-quarters of the funding for adult English education, but they are facing deficits and many have cut their education budgets.
Wilson also details additional reasons why the LEP population cannot simply just “pick up the language,” including waiting lists for English classes; growing LEP populations in places experiencing it for the first time; the difficulty of learning a second language as an adult, especially while juggling work and family responsibilities; and the diversity of education and literacy levels in the LEP population nationwide.
Are most of them Spanish speakers?
Yes. According to Wilson, 66 percent of the U.S. LEP population speaks Spanish. Speakers of the other broad linguistic groups are:
- 18.4 percent Asian and Pacific Island languages
(Chinese is largest here at 4.4 percent) - 11.9 percent Indo-European languages (excl. Spanish)
(Russian is tops here at 1.4 percent) - 3.4 percent Others, including Arabic, African, and Native American languages
However, Wilson also points out that while Spanish is the most common language among LEP adults, those who speak Asian and Pacific Island languages are most likely to be LEP. Forty-seven percent of speakers of these languages are LEP, compared to 45 percent of Spanish speakers. Among languages with at least 100,000 speakers who are LEP, those who speak Vietnamese are most likely to be LEP, at just over 60 percent. See Wilson’s Table 1 in the report for more detail.
Do they live mostly in big cities?
Yes, but they are spread across many metropolitan areas. Of America’s total working-age population, Wilson shows that 64 percent live in the 89 largest metro areas, but 82 percent of those who are LEP live in these areas.
The top five metro areas for total LEP population are:
- New York-Northern New Jersey-Long Island (18.3 % LEP)
- Los Angeles-Long Beach-Santa Ana (25.7%)
- Miami-Fort Lauderdale-Pompano Beach (23.2%)
- Chicago-Joliet-Naperville (13.0%)
- Houston-Sugar Land-Baytown (17.8%)
Wilson has data on the rest of the top ten. Also, she lists the top and bottom ten metro areas for LEP persons as a percentage of the working-age population, thus presenting a different picture. The top five are:
- McAllen-Edinburg-Mission, TX (32% LEP)
- El Paso, TX (29.8%)
- Los Angeles-Long Beach-Santa Ana (25.7%)
- Miami-Fort Lauderdale-Pompano Beach (23.2%)
- Fresno, CA (22.8%)
Metro areas in California complete the top ten. Syracuse, St. Louis, Virginia Beach, Cincinnati, and Pittsburgh have the lowest percentages of LEP workers.
In conclusion, Wilson writes that “English proficiency is an essential gateway to economic opportunity for immigrant workers in the United States.” She continues:
Yet access to acquiring these skills is persistently limited by a lack of resources and attention. Increasing investment in adult English instruction—through more funding, targeted outreach, and instructional innovations—would enhance the human capital of immigrants that could lead to more productive work and better outcomes for their children. Given the large number of LEP workers in the United States and the fact that virtually all of the growth in the U.S. labor force over the next four decades is projected to come from immigrants and their children, it is in our collective interest to tackle this challenge head on.
Visit the report, “Investing in English Skills: The Limited English Proficient Workforce in U.S. Metropolitan Areas,” to get Wilson’s complete analysis, data, methodology, charts, and policy recommendations. She has national-level data and data for each of the 89 metropolitan areas showing: the size and growth of the working age LEP population; home languages spoken; educational attainment; labor market occupations and industries employing the LEP population; other characteristics of the working age LEP population in the U.S. now and over time; and much more.
Thomas Young contributed to this post.


Commentary
Six Questions about the Limited English Proficient (LEP) Workforce
September 24, 2014