

The National Center for Education Statistics just released the 2015 results for NAEP (National Assessment of Educational Progress). NAEP assessments in reading and mathematics are administered every two years to representative samples of fourth and eighth grade students in each of the 50 states, as well as some large urban districts and other jurisdictions. I focus here on the state and national results.
The story in a nutshell and one picture is that the trend line turned negative in mathematics for the first time since the main NAEP was originally administered 25 years ago. Here are the results for mathematics in eighth grade, where the decline was largest:
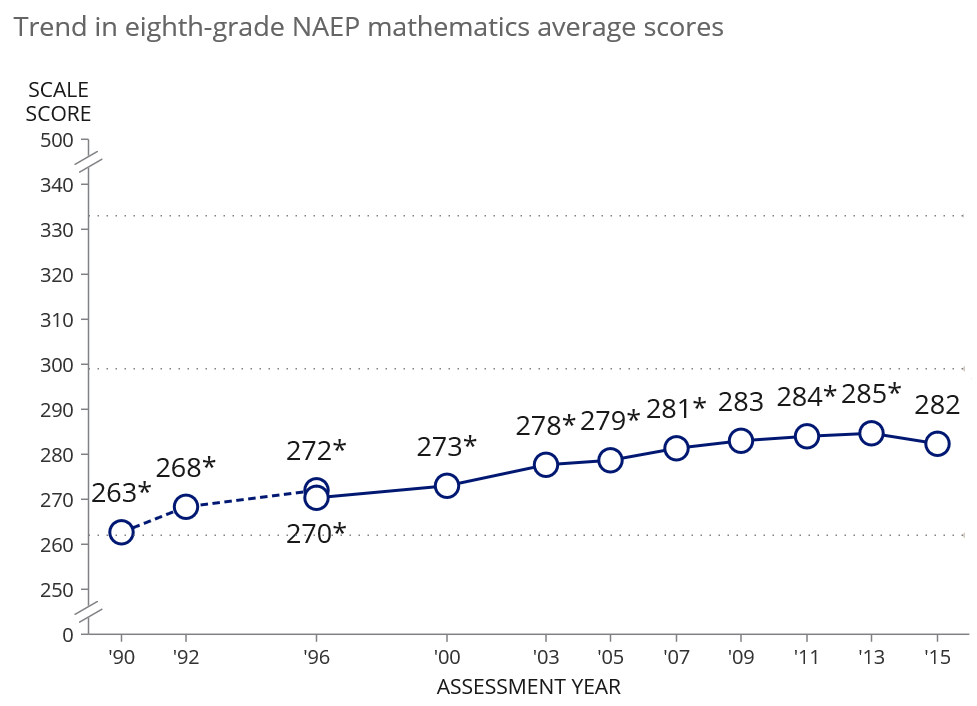
The story is arguably worse than suggested by the three point decline from 2013 depicted in the graph in light of the slow but persistent upticks in the trend line in prior years. Since participation in the assessment in math was first required of all states in 2003 under the federal Elementary and Secondary Education Act, the average biennial uptick on eighth grade math had been 1.5 points. Assuming no significant demographic changes in the nation between 2013 and 2015 and business as usual in the nation’s schools, the expected score for 2015 would have been 287 (rounded). Thus the 2015 results are roughly five NAEP scale points lower than would have reasonably been expected. A five point decline in NAEP would mean that eighth graders in 2015 were roughly six months of school behind eighth graders in 2013. The same calculations using the more conservative actual decline of three points leads to an estimated loss of roughly four months of school.[1] This is serious.
What accounts for the decline? It is never just one thing. Further, NAEP is to schooling as a thermometer is to a medical patient. It tells something important about the health of its subject, but virtually nothing about why things are as they are. That hasn’t stopped the usual pouring forth of opinions and punditry about what this year’s NAEP results mean.
One of the themes that has received attention is the role of the Common Core State Standards Initiative and associated end-of-year assessments. In discussing the 2013 results, which saw some modest upticks from 2011, secretary of education Arne Duncan credited the Common Core effort and named eight states with upticks as cases in point.[2] This year, with most of those states flat or down and the nation as a whole showing a decline, Duncan argued that large changes in schools such as those required by the Common Core often lead to temporary drops in test scores and that this year’s declines are a prelude to historic improvements in student achievement in the long term.[3]
Leaving aside that the secretary wants to have it both ways, his speculation about the disruptive effects of the Common Core deserve serious attention.
I’ve examined this issue empirically by exploring whether differences among states in the 2015 versus 2013 NAEP results in mathematics are associated with differences among states in whether students participated in a full blown Common Core assessment through one of the two assessment consortia (Smarter Balanced, and PARCC) at the end of the 2014-2015 school year. Twenty-eight states participated in a full blown Common Core assessment whereas 22 did not.
My working assumption is that the onset of high stakes Common Core testing is much more likely to be the flashpoint for disruption than the adoption of the Common Core standards themselves. Forty-three states plus D.C. at one time had adopted the Common Core. Most opted into the initiative in 2010. The long delay between adoption and full implementation, including testing this year, as well as the increasingly wobbly commitment of states to the Common Core initiative itself argues for the onset of testing as being the initiator of disruption rather than the act of adoption of new standards.
The graph below represents the results of a simple statistical analysis of the relationship between Common Core testing and changes in NAEP math scores between 2013 and 2015. The median scores and spread for states not participating in a Common Core assessment are in the box plot to the left, marked with a 0 on the horizontal axis, whereas the states that took a Common Core assessment are in the boxplot to the right. The differences depicted in the graph, which are represented as NAEP scale score points, are statistically significant.[4] The correlation between Common Core assessment participation and changes in NAEP is -.35.
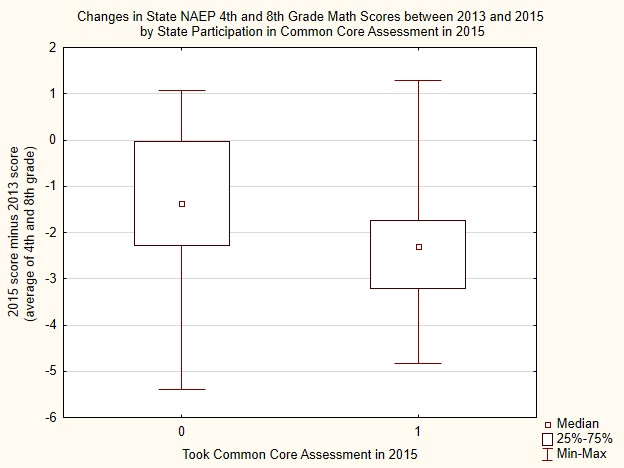
This analysis is not causal, and the modest correlation suggests that more is going on than disruptions in instruction associated with the rollout of a new assessment system. In line with this, note that the median change for the states that did not participate in a Common Core assessment is negative too. Whether or not this is the prelude to historic gains in future years, as Secretary Duncan speculates, remains to be seen.
In any case, there are a lot of states that still have to go through the transition to a new testing regimen; it is likely that disruptions associated with new tests will take more than a year to be resolved in most states; and NAEP is not testing quite the same things in the same way as the Common Core assessment and thus won’t directly benefit from teachers learning to teach to the new Common Core tests. Based on those factors and the results here, I wouldn’t bet on a big rebound in 2017.
[1] See http://www.urban.org/research/publication/breaking-curve-promises-and-pitfalls-using-naep-data-assess-state-role-student-achievement/view/full_report for a description of the approach I used to translate NAEP scores into months of school.
[2] http://blogs.edweek.org/edweek/curriculum/2013/11/ed_sec_duncan_links_rtt_invest.html
[3] https://www.washingtonpost.com/news/answer-sheet/wp/2015/10/28/what-the-national-drop-in-2015-naep-test-scores-really-means/
[4] t= 2.58, df(48), p=0.01
The Brookings Institution is committed to quality, independence, and impact.
We are supported by a diverse array of funders. In line with our values and policies, each Brookings publication represents the sole views of its author(s).