
Abstract
This paper examines the U.S. social insurance system, which we define broadly to include both programs supported by dedicated taxes and other federal programs that provide income support, assistance in meeting basic needs, or services to improve economic opportunity. The paper considers the social insurance system as a whole as well as its component parts, providing an overview of major federal programs in the areas of education and workforce development, health, income support, nutrition, and housing. The paper covers how the social insurance system is organized, how eligibility is determined and who benefits, how the benefits and services are delivered, and how the system affects poverty and inequality. We focus primarily on the system as it operated prior to the onset of the COVID-19 pandemic, but also look at how various programs respond to economic downturns. Coming at a time when policymakers will start shifting their focus from using the social insurance system to provide relief from the pandemic and recession to considering what changes should be made in the system on an ongoing basis, the paper also reprises an array of proposals to strengthen the system in various ways that The Hamilton Project has commissioned in recent years.
Introduction
The social insurance system in the United States, implemented by federal, state, and local government agencies, provides protection against what President Franklin Delano Roosevelt called the vicissitudes of life: disability, the loss of earnings in old age, being laid off, and other setbacks. The social insurance system also provides support to help people meet their basic needs and gain the skills and services they need to enter and succeed in the workforce. It encompasses a wide range of government programs, from the Social Security system, to Unemployment Insurance (UI), to early childhood education. Nearly everyone in the United States directly benefits from the social insurance system at some point in their lives. Moreover, everyone indirectly benefits from it—either from knowing the system would be there for them during some unexpected hardship or simply because it helps to support the overall economy.
In framing this paper, we explore how the social insurance system is organized, how eligibility is determined and who benefits, how the benefits and services are delivered, and how the system reduces poverty and inequality. We define the system broadly to include both benefits and services programs, and both programs without income limits and programs targeted by income or other factors. The paper examines the system as a whole and its component parts, providing an overview of the major government social insurance programs in the categories of (1) education and workforce development; (2) health; (3) income support; (4) nutrition; and (5) shelter. We also consider how programs operate during economic downturns as well as in more normal economic times; we focus on the structure of the social insurance system as it was prior to the onset of the COVID-19 pandemic.
Through this exercise, avenues for improvement and reform emerge. The paper reviews an array of Hamilton Project policy proposals to improve the social insurance system, including how various supports could be better targeted, how programs could be made more efficient, and how the system could better reach the most vulnerable families and individuals during economic downturns and during more normal times. Recent Hamilton reports have advanced proposals in such areas as UI, Social Security, health insurance coverage, paid leave, the Supplemental Nutrition Assistance Program (SNAP), the Earned Income Tax Credit, housing, childcare, education and workforce development, and Temporary Assistance to Needy Families (TANF).
This paper comes at an important juncture, as policymakers shift in the period ahead from using the social insurance system to provide widespread relief during the COVID-19 pandemic and related recession to designing and instituting (as well as reauthorizing) reforms that will strengthen the social insurance system so that it can make the economy more resilient and better provide protection from the vicissitudes of life.
Chapter 1. An Overview of the Social Insurance System
This chapter offers our working definition of the social insurance system and provides an overview of how it works. We describe how the federal, state and local governments provide benefits through the social insurance system and who, on the whole, receives those benefits. We also describe evidence on how social insurance programs reduce poverty and income inequality in the United States. In a box, we offer brief highlights of the major programs that make up that system.
What Is Social Insurance?
There is no uniformly agreed-on definition of social insurance, but two definitions—one narrower and one broader—are often used. Under the narrower definition, social insurance consists of government programs in which workers (and/or their employers) pay dedicated taxes to the programs during the years that the workers are employed. The workers then qualify for benefits from the programs when they reach retirement age, are determined to have a disability, are laid off, or experience another qualifying event. The main social insurance programs under this definition are the Social Security programs, Medicare, and UI.
The broader definition of social insurance includes both the programs supported by dedicated taxes and other programs (including tax credits) that provide income support; help people secure or afford necessities such as food, housing, and health-care coverage; or provide services or benefits to improve economic opportunity such as education and job training, as well as child care. The broader definition similarly includes both what are often referred to as universal programs and what are often referred to as targeted programs, with the difference being whether a program is open to otherwise-eligible families or individuals regardless of their income level or whether the program has an income restriction, usually an upper income limit. (No programs are entirely universal in the sense that people of all ages, incomes, immigration statuses, and the like are eligible.)
The broader definition, which we use, encompasses programs that are entitlements, programs funded through the annual appropriations process, and programs that are funded outside the appropriations process but that are not entitlements. We do not, however, include as social insurance various benefits that employers (rather than the government) may provide, such as employer-based health-care coverage or retirement plans. We focus on federal programs, many of which are administered in whole or in part by states (or in some cases, localities) and some of which are jointly funded by the federal and state governments with both levels of government playing a role in setting the programs’ eligibility criteria and/or the benefit levels. As a result, benefit coverage for a number of the programs (and gaps in coverage) varies across the country.
Some social insurance programs, such as Social Security and UI, were born out of the Great Depression. Others were created from the mid-1960s to the mid-1970s, including Medicare, Medicaid, the Supplemental Security Income program, the Supplemental Nutrition Assistance Program (SNAP; formerly known as the food stamp program), and the Earned Income Tax Credit (EITC), as well as Head Start and the Special Supplemental Nutrition Program for Women, Infants, and Children (WIC). Still others are more recent; for example, the Children’s Health Insurance Program (CHIP) and the Child Tax Credit (CTC) were established in 1997, while subsidies to make private health insurance more affordable were established under the Patient Protection and Affordable Care Act (Affordable Care Act), which was enacted in 2010 and largely took effect in 2014.
A number of these programs play the role of so-called automatic stabilizers: they expand without Congressional intervention to serve more people in recessions when need increases and then contract when the economy rebounds. In so doing, they help to smooth out changes in people’s spending power over business cycles and thereby help moderate the depth of recessions and hasten economic recovery (Lee and Sheiner 2019). This is particularly true of UI, but it also applies to programs such as SNAP and Medicaid.
For tractability, we organize the social insurance system into five broad categories. For highlights, please see Box 1; for a more in-depth review of the programs and Hamilton Project proposals for reform, see Chapter 2.
- Education and Workforce Development. Includes programs ranging from those that support early childhood education, which can also function as child-care programs, to student loan programs and workforce development programs.
- Health. Health programs are among the largest of the social insurance programs and include Medicare, Medicaid, CHIP, and programs under the Affordable Care Act.
- Income Support. These programs support income through transfers, refundable credits, and tax reductions for those in retirement, for those with particular family circumstances, or for those with relatively low income. The programs include Social Security, UI, the CTC, EITC, and Temporary Assistance for Needy Families (TANF).
- Nutrition. These programs include SNAP, WIC, and the school lunch (National School Lunch Program [NSLP]) and breakfast (School Breakfast Program [SBP]) programs, as well as other child nutrition programs.
- Shelter. Several programs, such as the housing choice voucher program, help low-income renters afford shelter. Other programs reduce the burden of ownership, although such programs largely target middle- to upper-income homeowners.
The range of social insurance programs discussed in this paper is not meant to be exhaustive. For example, there are many shelter and workforce development programs that are relatively small in dollar terms, including several block grants and development funds, that we do not discuss here. Other social insurance programs that are discussed, including TANF and SNAP, include components of workforce and education training programs that we don’t cover in detail. Another example of a smaller program not discussed here is the Low Income Household Water Assistance Program (LIHWAP), which provides water and wastewater assistance to some low-income households. To be sure, the smaller programs are part of the social insurance system and can be important for beneficiaries, but for manageability this report focuses on the larger programs.
How Is Social Insurance Provided by the Government?
How government delivers social insurance depends first on what level of government provides the funding for a program, delivers the benefits, and sets the rules for who qualifies and how much they receive. Another key dimension is whether a program is delivered on an entitlement basis, under which all eligible individuals or households who apply must receive the benefit, or whether the program provides benefits only to as many people as its appropriated funding for the year allows, with other people who apply being put on waiting lists or turned away despite meeting the eligibility criteria.
The determination of whether a program operates as an entitlement also has implications for a third key issue—the degree to which programs expand automatically in recessions. While policymakers have regularly stepped in to expand the social insurance system in certain ways during economic downturns, certain programs expand and contract automatically—to serve more or fewer people—as need increases or subsides. By expanding during recessions to provide relief to people whose incomes have declined, the automatic stabilizer feature of these programs helps to support households’ purchasing power when the economy falters.
In that sense, those features of some key programs resemble the popular understanding of insurance. For example, employed people benefit from the existence of unemployment insurance and people who currently are financially secure benefit from the existence of SNAP. In both cases, those people know that those programs exist for them if times turn bad, helping them temporarily to maintain their spending during those times. In some ways that is like a homeowner benefiting from knowing their home is insured against fire or other disaster.
The Roles of Different Levels of Government
The social insurance system is funded by taxpayers and administered by the government. Some major programs, such as Social Security and Medicare, are both funded and administered by the federal government. That also is true of tax credits that provide income support and are part of the social insurance system, such as the EITC and the CTC. A larger number of programs, however, are fully or partially funded by the federal government but are administered by states (or, in the case of low-income rental assistance programs, administered primarily by local housing agencies and in some cases by state agencies). In some of these joint federal-state programs, the federal government fully funds the benefits and partially funds state and local administrative costs. SNAP and low-income housing programs fit that pattern. In other cases, such as Medicaid, states must provide a share of both the benefit and the administrative-cost funding.
There also are variations in what level of government sets the eligibility rules. The federal government sets the national standards in programs that are both federally funded and federally administered, like Social Security and Medicare. In programs like SNAP the federal government prescribes the benefit amounts and most of the eligibility rules, but states have options to modify some of the eligibility rules, and most states use these options. In Medicaid the federal government has established both a set of mandatory coverage categories—categories of people whom state Medicaid programs must cover—and a set of optional coverage categories, with states having the option of whether or not to cover the people in them, with the result that considerable variability exists across states in who is eligible for Medicaid. Similarly, the federal government prescribes a set of mandatory health services that state Medicaid programs must cover and a set of optional health services that states can elect to cover.
Differences between Entitlements and Discretionary Programs
A number of the programs are open-ended entitlement programs, meaning that all eligible individuals or households that apply must be served. Social Security, Medicare, Medicaid, SSI, SNAP, UI, and various tax credits are examples. Tax credits in the social insurance system include the EITC, CTC, CDCTC, and premium tax credits to subsidize health insurance in the Affordable Care Act’s insurance marketplaces.
Programs that are not entitlements, by contrast, are limited to the discretionary, annual funding they receive each year through the federal appropriations process and/or through a separate capped federal funding stream. The Child Care and Development Block Grant (CCDBG) and low-income housing programs are examples of this type of program. Other examples include federal child-care assistance, which as a result of limited funding relative to need, reached the families of only one in every six children who qualified for it prior to the pandemic, while federal rental assistance reached only one in every five eligible low-income households.
Responding to Recessions
Programs that are open-ended entitlements can respond automatically in recessions: as people lose jobs and their incomes fall, more people become eligible and enroll in various of these programs. These programs expand automatically to serve more people, which also helps bolster a flagging economy. Conversely, these programs offer less fiscal support when the economy is doing well and fewer people need—and qualify for—this assistance, which can help to stabilize an economy at risk of overheating. Programs that are funded through discretionary federal spending or through a separate capped-funding stream (such as the TANF block grant) lack this feature.
Although entitlement programs like UI, SNAP, and Medicaid see their enrollments grow in recessions without action by Congress because more people meet their eligibility criteria, it takes congressional action during downturns to broaden the eligibility criteria in these programs, boost the benefit levels, or (in programs like Medicaid where the federal government and the states split the costs) to increase the federal share of costs. Indeed, roughly half the economic stabilization produced by fiscal policy since 1980 has been the result of policies undertaken by policymakers, rather than a result of automatic stabilizers already built into the programs (Sheiner and Ng 2019). For example, during recent recessions federal policymakers have acted to expand UI beyond the expansion that occurs automatically; in the current recession, policymakers have broadened UI eligibility and increased both benefit levels and benefit duration. Federal policymakers have also acted in recent recessions to raise the federal share of Medicaid costs and to increase SNAP benefit levels, somewhat broaden SNAP eligibility, and provide added funding for state administrative costs. These types of changes in programs like UI, Medicaid, and SNAP typically are temporary; they are put in place for a specified period of time.
Federal policymakers can also elect to increase funding for various non-entitlement programs in recessions. In 2020 and 2021, for example, policymakers provided additional funding for low-income housing programs, child care, and the WIC program, among others. In addition, policymakers can establish temporary new programs or program components, such as programs put into effect in 2020 to help mortgage holders and renters remain in their homes, with a focus on those who otherwise lacked the financial resources to pay their monthly housing expenses.
Such changes provide both further relief to affected households during an economic slump and further stimulus to the economy, because the benefits provided by these temporary program expansions to low-income households, and to those who recently lost their jobs, tend to be spent quickly rather than saved.
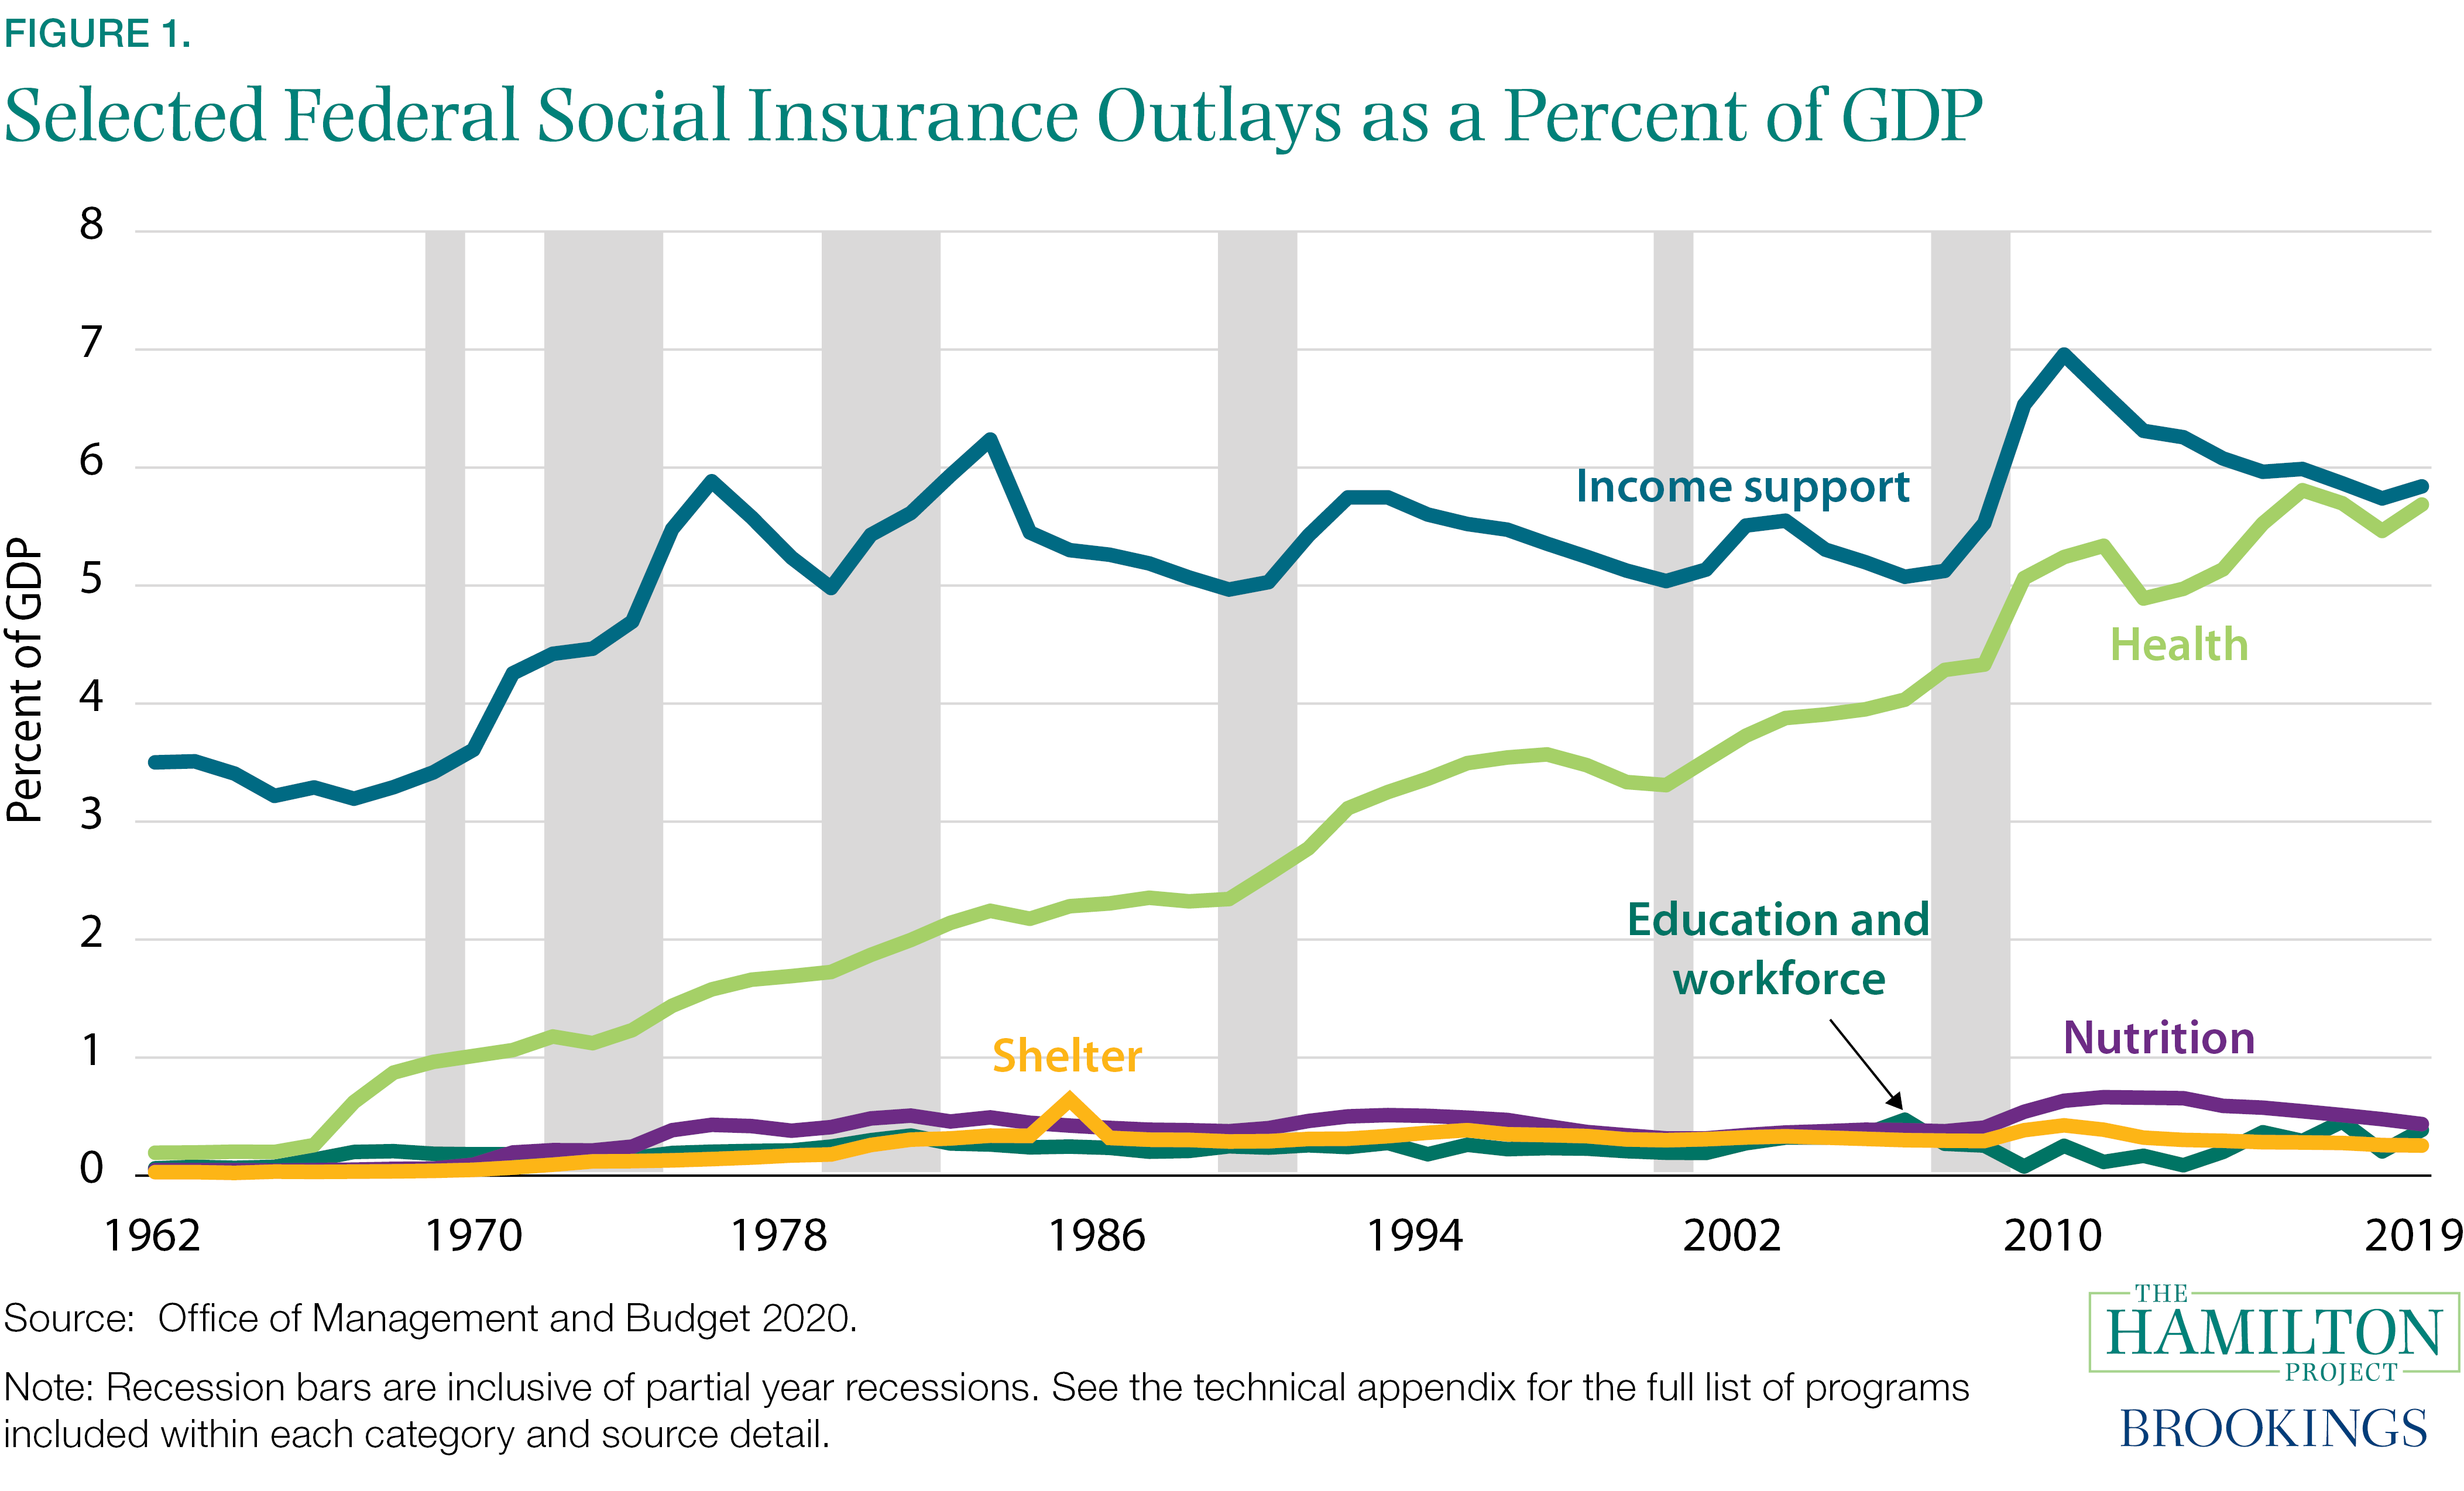
Program Size and Growth
In fiscal year 2019 the federal government spent $2.7 trillion (about 13 percent of the nation’s gross domestic product, or GDP) on social insurance programs. As shown in figure 1, the largest programs are income support (which includes Social Security) and health coverage programs. In 2019 Social Security outlays equaled $1.0 trillion, or 23 percent of the federal budget (4.9 percent of GDP). Expenditures for health insurance programs outside the VA and DoD —i.e., for Medicare, Medicaid, CHIP, and subsidies for coverage in the Affordable Care Act’s marketplaces—amounted to $1.1 trillion, or 26 percent of the federal budget (5.3 percent of GDP), with Medicare responsible for nearly three-fifths of this amount. Expenditures for other social insurance programs that deliver assistance to people in need (i.e., social insurance programs other than Social Security and health insurance programs) totaled $518 billion in 2019, or about 12 percent of the federal budget.1
Changes over time in the inflation-adjusted costs of social insurance programs—other than increases during recessions for certain programs followed by decreases during economic recoveries—stem from three main factors: demographic changes (i.e., the aging of the population), increases in health-care costs, and decisions made by policymakers to expand or cut programs. The aging of the population and health-care costs are the factors driving the projected cost of Social Security and Medicare. Indeed, in 2019 the Center on Budget and Policy Priorities (CBPP) projected, based on Congressional Budget Office (CBO) forecasts, that in the absence of action by policymakers to expand or shrink programs, virtually all of the increase in total federal program spending over the coming decade (i.e., spending exclusive of interest payments) would be due to the increased costs for Medicare and Social Security (CBO 2019; Kogan and Bryant 2019).2 The CBPP analysis projected that costs for federal spending outside Medicare, Social Security, and interest payments would actually decline slightly as a share of GDP over the decade ahead. On the other hand, spending for mandatory programs targeted on lower-income households—that is, spending for targeted programs that are entitlements or otherwise have their funding levels determined outside the appropriations process—would remain largely unchanged as a share of GDP over the coming decade (Kogan and Huang 2019).
The COVID-19 pandemic, the accompanying recession, and policymakers’ responses to these developments have magnified the uncertainty about long-term cost estimates for various programs. Changes to the social insurance system by policymakers, both enacted in the past year and proposed, could substantially alter that outlook.
How Do Workers and Families Receive Social Insurance?
Social insurance can be delivered
- in cash, including through tax refund checks;
- in the form of vouchers to purchase certain types of goods or services, such as to purchase food in a grocery store, to rent an apartment from a private landlord, or to secure a slot at a child-care center;
- through the provision of health insurance; or
- in the form of a particular good such as a box of food or a specific rental unit in a particular public housing project.
In addition, some programs provide benefits (such as those just noted), while other programs provide services such as education, job training, or assistance for persons with disabilities or older adults.
In short, this is a varied and multifaceted terrain. Given the range of human needs and the different types of programs and delivery mechanisms, a mix of approaches that includes benefits in cash, vouchers, and the direct provision of goods and services may make sense. There is considerable debate, however, over how best to improve the current mix of program designs and what reforms would significantly strengthen the system.
Cash Benefits
Several social insurance programs provide cash benefits without constraints on how the money can be spent. Social Security, SSI, and the TANF block grant fall in this category. So do the checks that the Internal Revenue Service (IRS) sends to tax filers who qualify for refundable tax credits like the EITC and CTC. Some analysts believe cash provides the greatest value to recipients, but the evolution of social programs over the last half century suggests that the public and policymakers can be reluctant to provide benefits in cash and have often been more amenable to the provision of vouchers and in-kind benefits (Liscow and Pershing 2020; Greenstein 1991).
Vouchers
Vouchers are used in and work through commercial marketplaces. SNAP provides vouchers, via a debit card, that households use to purchase food in retail food stores. Beneficiaries choose which foods (to be prepared at home) to buy. When SNAP began, it represented a marked departure from the food commodity programs that preceded it, under which beneficiaries had to travel to food depository points where they were given boxes of specific foods, which often reflected what foods were in surplus rather than foods to provide a balanced nutritional diet. Similarly, households receiving rental vouchers (primarily through the federal government’s Housing Choice Voucher program) can use the vouchers to offset a portion of the rent for a unit they choose, as long as the landlord accepts vouchers. Some programs that provide or subsidize health coverage also use a voucher-like approach. People who purchase health insurance in the Affordable Care Act’s insurance marketplaces—with the help of a premium tax credit—are essentially using a voucher to purchase coverage of their choice that meets Affordable Care Act standards.
The advantages of vouchers, relative to providing specific goods, include providing consumers with choice regarding such things as which foods to buy, apartments to rent, or health insurance plan to purchase. For vouchers to work successfully, there must be a competitive well-functioning marketplace that meets basic standards the program establishes. In the case of SNAP, nearly all significant grocery stores and supermarkets participate. Acceptance of rental vouchers is fairly widespread but not universal, and in some locations tends to be at less-than-desirable levels. For the Affordable Care Act’s premium tax credits to work effectively, it is necessary to ensure a functioning marketplace with an adequate number of competing insurance plans in each area, something various other ACA provisions are designed to provide.
Program Areas with Combination Approaches
Child care is an example of a program area with multiple programs and approaches. The CDCTC subsidizes a portion of child-care costs that families incur, via a once-a-year benefit delivered through the tax system. The CCDF, by contrast, provides funds to states; state governments can use them in a number of ways, including subsidizing the cost of child care for low-income working families, improving the quality of child care, or establishing child-care resource and referral (CCR&R) agencies that provide important connections between parents and child-care providers in local communities. In contrast to the benefit provided by the CDCTC, the government can use the CCDF to set quality standards for the child care it supports.
Benefit Frequency
Different social insurance programs deliver benefits at varying frequencies. Most programs provide benefits or services on a monthly basis, such as Social Security, SNAP, Medicaid, the Affordable Care Act’s premium tax credits, rental assistance, and others. In contrast, UI provides weekly benefits. Tax credits like the EITC and CTC have traditionally been provided on an annual basis following the filing of tax returns each winter and early spring. However, the IRS is about to start issuing CTC benefits on a monthly basis, beginning in July 2021 and expiring in December 2021. In the case of tax credits, eligibility and benefit levels continue to be based on annual income. In programs like SNAP and Medicaid, eligibility is based on monthly income; using monthly income rather than annual income enables people who recently were laid off or who experienced another type of major income loss to qualify more expeditiously.
Whom Does Social Insurance Benefit?
Eligibility
Eligibility varies widely for programs depending on a program’s goals, target population, and administration. The target population might be people with work records, current workers, children, families with children, people with disabilities, people who are age 65 and older, people with low incomes, pregnant or nursing women, or some combination of these groups.
Applicants to programs such as Social Security, Medicare, and UI need work records of varying lengths to qualify. These programs do not have an income eligibility limit and are often referred to as universal, though they do require a specified number of quarters or years of paid employment. A few programs require a beneficiary to have earned income; the EITC is a leading example. Other programs require incurring a particular type of expense, such as child-care costs.
Some social insurance programs require their beneficiaries to be part of a designated demographic group. To qualify for Social Security, individuals must be 62 or over, seriously disabled, a spouse or dependent child of a covered worker in some cases, or a surviving spouse or dependent child of a deceased individual who was a covered worker. To qualify for CHIP an individual must be a child under age 19. To qualify for the WIC nutrition program, an individual must be a pregnant, nursing, or postpartum woman or a child under age five. Many programs have eligibility requirements that will automatically qualify a person for other benefits. One example: someone who receives SSI is categorically eligible for SNAP and Medicaid in most states. Recipients of TANF benefits also become automatically eligible for SNAP.
Most social insurance programs have income limits. Several programs, such as Medicaid, have differing income limits for different demographic groups such as children or adults below age 65. Several decades ago, it was common to think of programs as being either universal (having no upper income limit) or targeted on the poor, but that categorization is no longer very useful. Increasingly, targeted social insurance programs cover both low-income households and households that are somewhat higher—often much higher—on the income scale. For example, the Affordable Care Act’s premium tax credits to subsidize the purchase of health insurance go up to 400 percent of the poverty line—$106,000 for a family of four in 2021 (and during the pandemic and economic downturn to levels higher than that). The CTC provides at least a partial credit to married filers with two children with incomes up to $480,000.
A declining number of programs also impose asset tests, the most restrictive of which are the asset tests in SSI and in Medicaid for people who are age 65 and older or who have a disability. This reflects the fact that some older people are retired and have low current income, but may have extensive savings. Most states also impose asset tests for the receipt of cash assistance under the TANF block grant. Medicaid does not impose an asset test for children or non-elderly adults, however (except those qualifying under Medicaid’s eligibility category for people with disabilities), and states have options to greatly ease or dispense with asset tests in SNAP, which most states have taken. Rental assistance programs also do not have asset tests.
Various programs also set other eligibility conditions or restrictions. UI requires beneficiaries to search for jobs. For TANF participants and some SNAP and housing assistance participants, time limits are imposed on participation unless they are meeting a work requirement. For SNAP, states can secure waivers from this time limit for areas with elevated unemployment and can provide individual exemptions. Several other programs allow states to restrict eligibility further, to exclude people such as ex-felons or people found to be using banned substances.
Eligibility among Immigrants
Most social insurance programs are available to US citizens and various categories of legally present immigrants, such as legal permanent residents, but not to people who are undocumented. The categories of legally present immigrants who qualify vary to some degree by program.
In programs that require extensive earnings records like Social Security and Medicare, legally-present immigrants who entered the United States late in life often do not qualify because they do not have a sufficient number of years of earnings in the United States. In addition, several major programs like Medicaid and SNAP impose a different type of restriction on legally-present immigrants—a bar on receiving these benefits during an immigrant’s first five years in the United States, with certain exceptions. In SNAP, children, refugees and asylees, and people receiving federal disability benefits are exempt from the five-year bar, but it applies to most other recently arrived legally present immigrants. In Medicaid and CHIP, refugees and asylees are exempt from the five-year bar, and states may elect whether to exempt children from the bar (35 states do) and whether to exempt pregnant women (25 states do).
Participation and Take Up
Take-up rates in social insurance vary by program. The term “take-up rates” refers to the share of eligible people or households that enroll and participate in the programs. For example, a study estimated that 77 percent of those eligible for UI from 1989 to 2012 collected it, though some states had estimated average take-up rates over this period below 50 percent (Auray, Fuller, and Lkhagvasuren 2019).
Take-up rates can vary not only across programs, but also across different parts of the same program. For example, the IRS estimates that 82 percent to 86 percent of families with children that are eligible for the EITC receive it. By contrast, the take-up rate for the EITC for childless workers was estimated to be only 65 percent in tax year 2016, which likely reflects the fact that the “childless EITC” provides small benefits that pale in comparison to the benefits that families with children receive (IRS 2020). Higher benefit levels in social insurance programs are, not surprisingly, associated with higher take-up rates. Similarly, take-up rates in SNAP are substantially higher for families with children than they are for older adults, who receive much smaller benefits on average. WIC’s estimated overall take-up rate was just over 50 percent in 2017 (US Department of Agriculture [USDA] 2020): eligible infants were far more likely (79 percent) to participate in WIC than eligible four-year-old children (25 percent).
The SNAP program provides a good illustration both of the fact that participation rates tend to be higher for households eligible for more-substantial benefits and of the fact that take-up rates can improve over time. USDA data show that, in 1980, some 52.5 percent of the households eligible for SNAP received it. In 2017, by contrast, 87.5 percent of eligible households received SNAP. The data also show that in 2012, the last year for which these particular data are available, 87 percent of the eligible households received SNAP but these households accounted for 96 percent of the total benefits that eligible households would have received if everyone eligible had participated (USDA 2019). That’s because participation rates tend to be higher among those who are eligible for larger SNAP benefits.
Policymakers, practitioners, and others who seek to boost program take-up rates are now increasingly relying on advances in information technology (IT) to boost take up—in particular, on using an individual’s or household’s participation in certain programs to enroll the individual or household automatically (or nearly automatically) in other programs for which they qualify. Practices are growing in Medicaid and SNAP, for example, to electronically screen people participating in one of these programs to facilitate their enrollment in the other program, as are efforts to use SNAP or Medicaid enrollment to enroll children automatically in free school meals. States are also increasingly relying on IT to reduce the number of times that households must go to social service offices in person to apply for, or renew their eligibility for, benefits; doing so tends to increase take up and retention (and to reduce churn, where households slip off the programs despite remaining eligible for them and must reapply to reenroll).
Enrollment
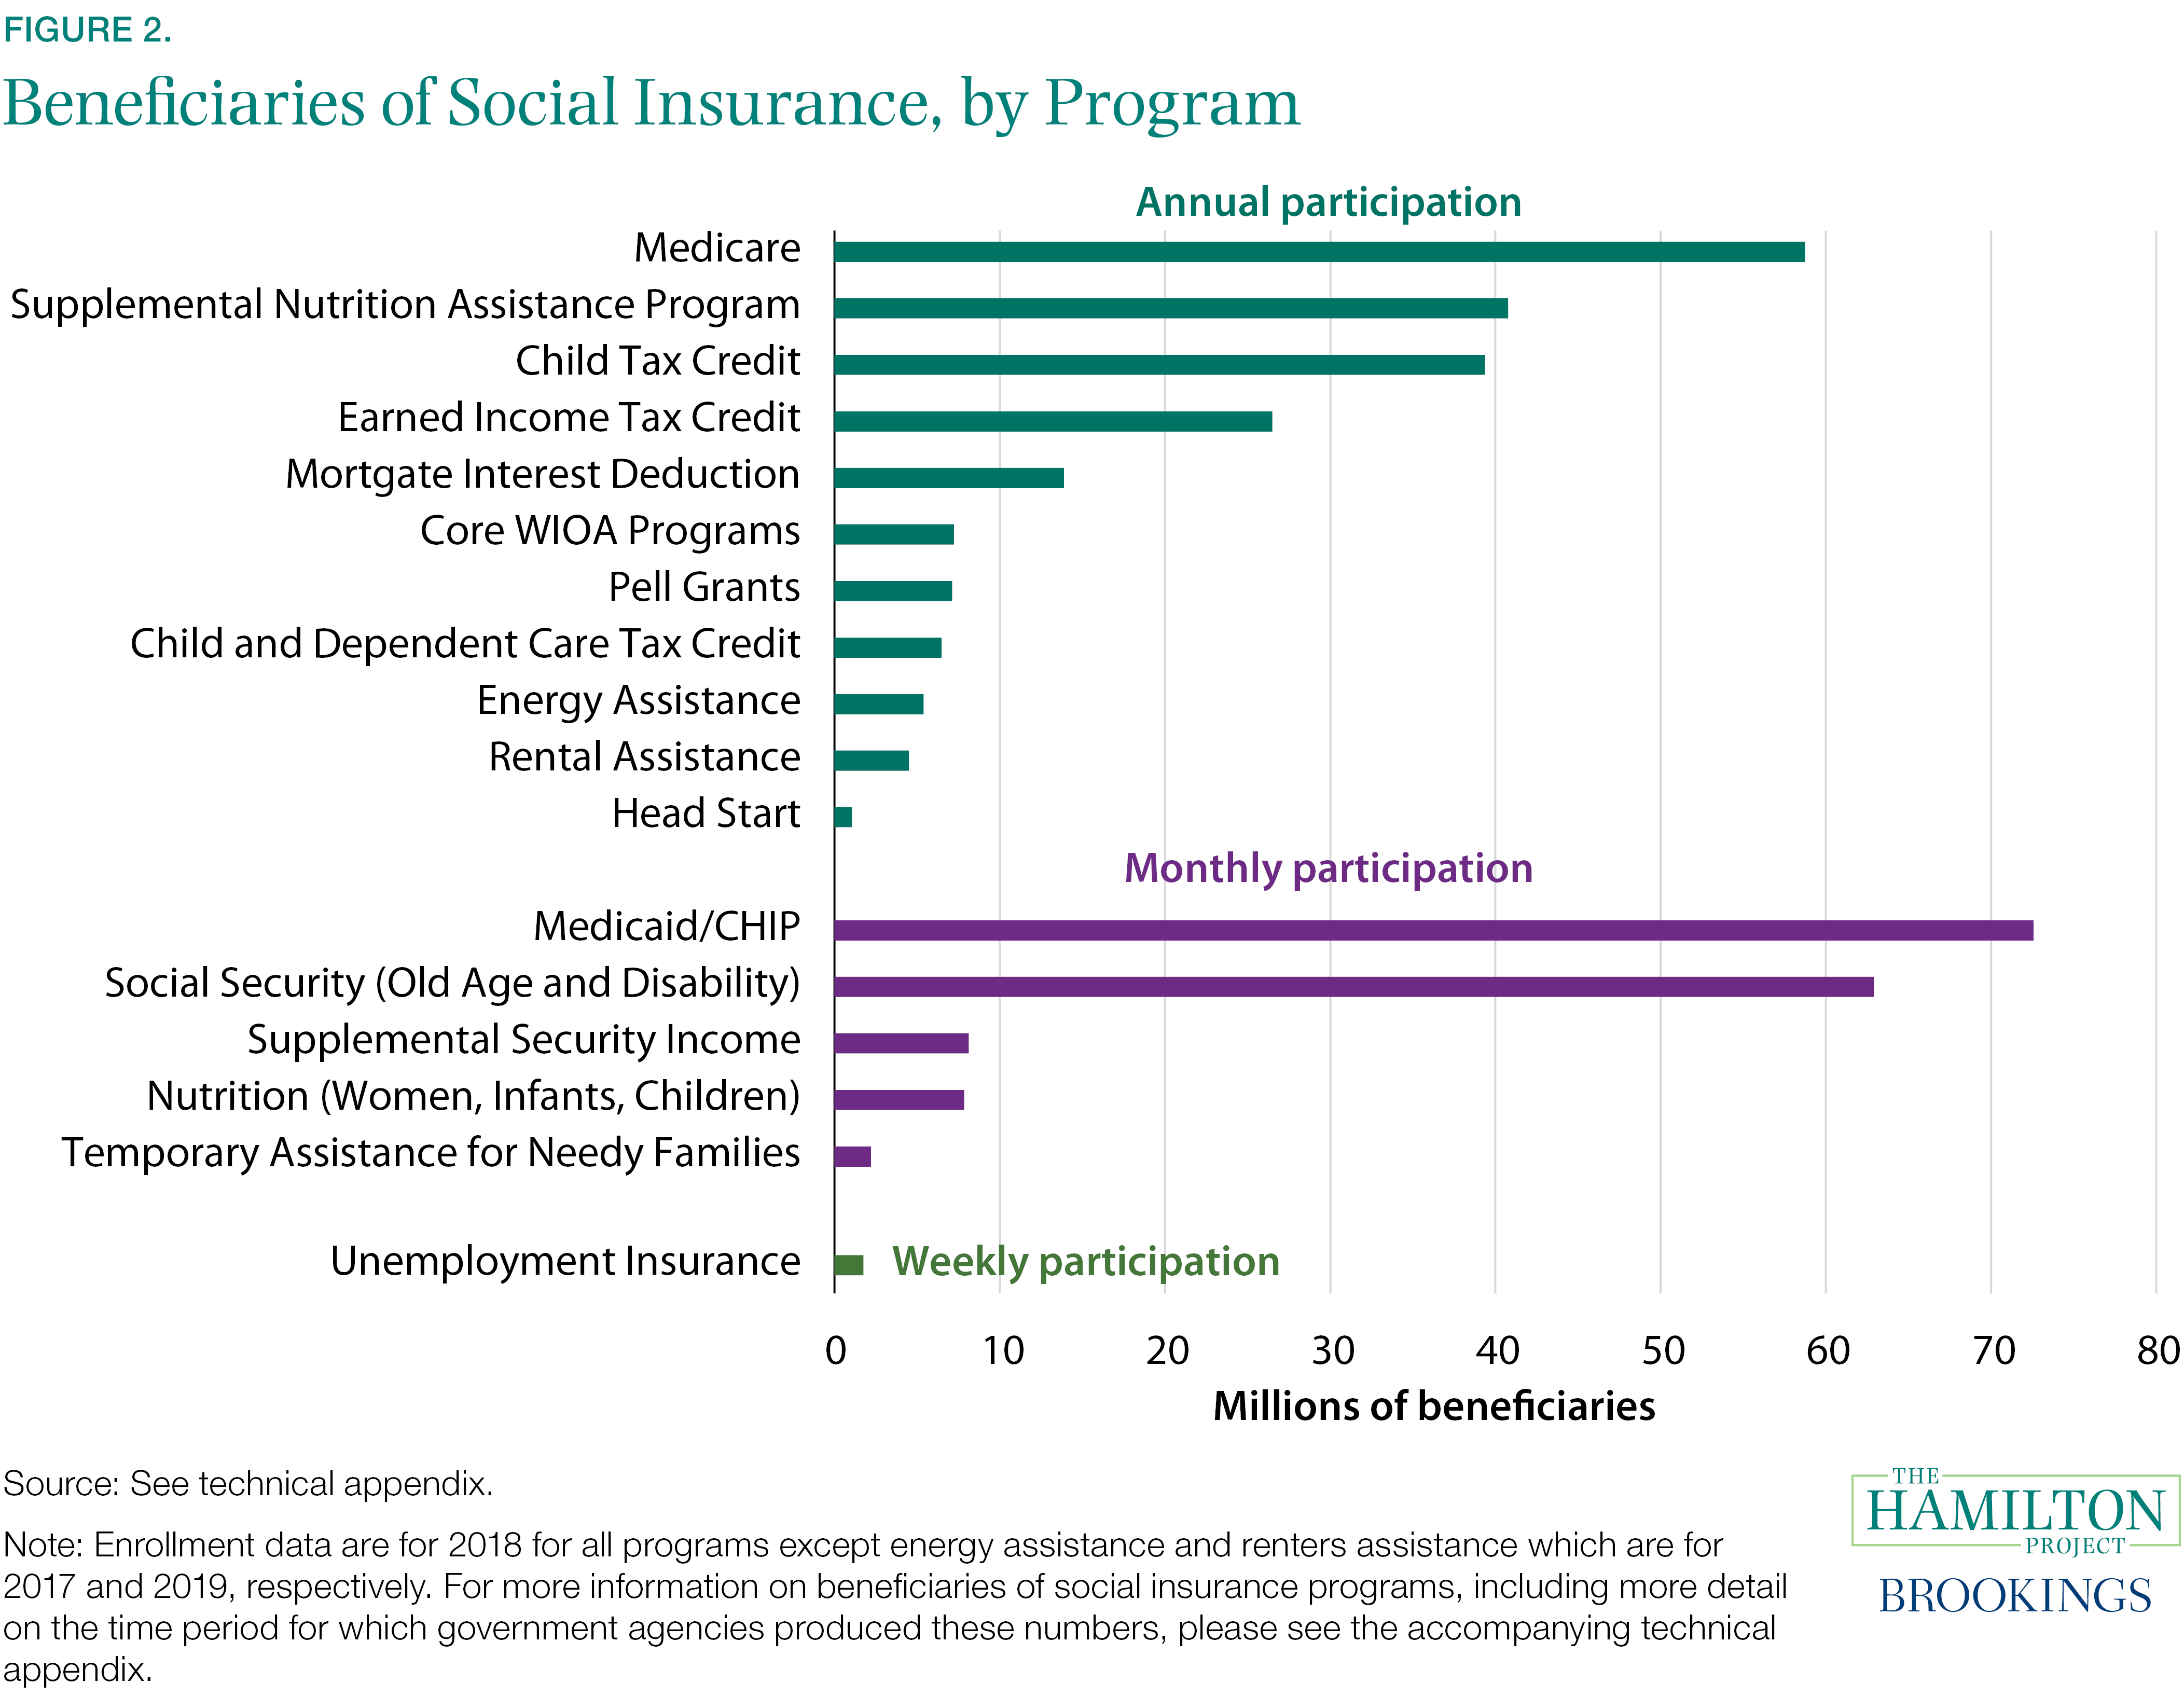
Enrollment in social insurance programs is a function of both eligibility and take-up rates. Program enrollment can change dramatically if the economy is in a recession. For example, the average number of individuals collecting regular UI in a given week in 2007 was 2.5 million, but in 2009, at the height of the Great Recession, the annual weekly continuing claims average was 5.8 million. In figure 2 the largest social insurance programs are sorted by the number of recipients in 2018, near the peak of the last economic cycle.
It is important to note that many of these programs are accessed by the same individuals or families; therefore program counts from the administrative websites should not be summed to estimate total participation across social insurance across programs. In 2018 Medicaid and CHIP had the highest recipiency, followed by Social Security (OASDI). UI recipiency was relatively low in 2018 (it was the lowest of the major programs that year), but it climbed dramatically in 2020 when unemployment surged and Congress broadened the UI eligibility criteria and increased UI benefits on a temporary basis.
How Does Social Insurance Affect Poverty and Income Inequality?
Many social insurance programs are targeted by income. To qualify for most of those programs, individuals, households, or families need to have income below a specified level, often a multiple of a threshold known as the poverty line. The income limits for the programs vary, often being set somewhere between from 100 percent and 300 or 400 percent of the poverty line. The US Department of Health and Human Services (HHS) issues the poverty-line thresholds used in determining eligibility for these programs and updates the thresholds each year, adjusting for inflation. In some of these programs the federal government sets the income limit; in other programs the states do, often within federal guidelines. Other social insurance programs do not have an income limit; typically, those programs—which include Social Security, Medicare, and UI—require a past earnings record of a specified duration.
Poverty and Social Insurance
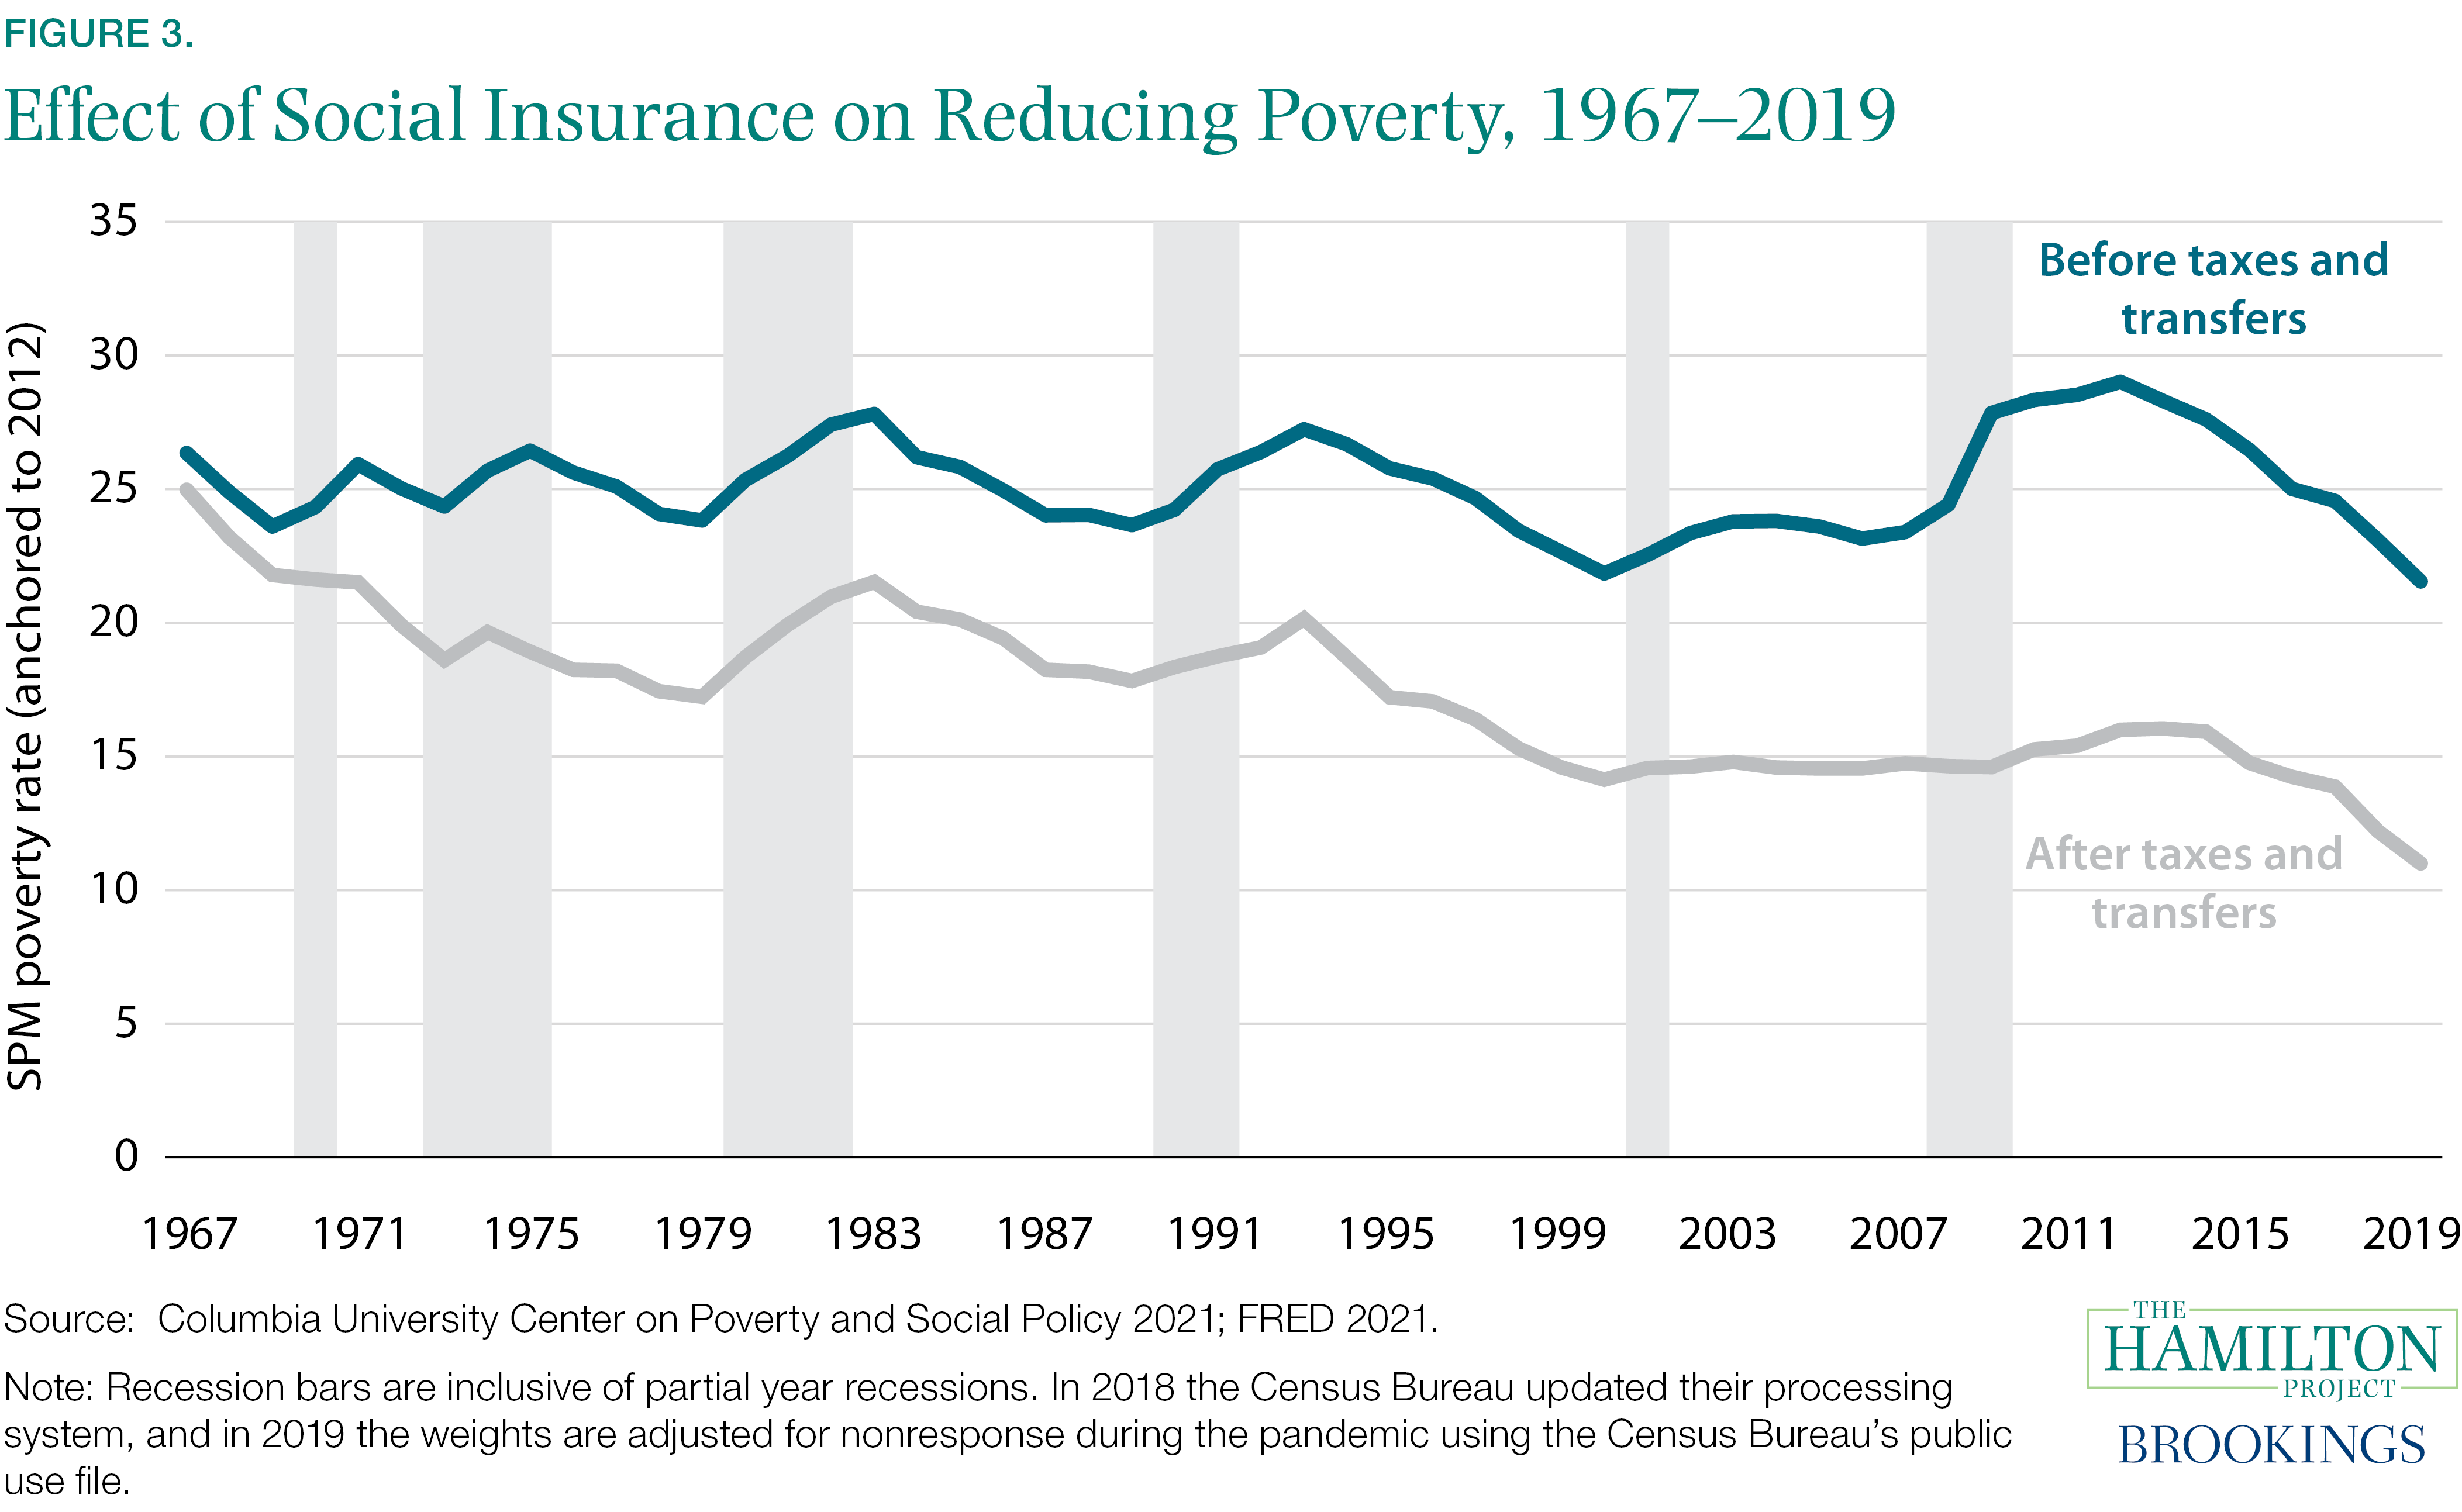
To determine the effects of social insurance programs on poverty, analysts generally use what is known as the Supplemental Poverty Measure (SPM), rather than the so-called official poverty measure (OPM)—both of which are calculated by the US Census Bureau (Census). While the OPM is used to determine program eligibility, only the SPM counts the benefits from programs like SNAP, rental vouchers, refundable tax credits, and the like as income in determining whether a household is above or below the poverty line.* In particular, in measuring changes over time in the antipoverty impact of social insurance programs, analysts primarily use what is known as the anchored SPM, a version of the SPM that adjusts the poverty-line thresholds annually only for inflation. The anchored SPM provides a sound measure by which to compare poverty over time.3
In figure 3, historical data from the SPM, using estimates provided by the Center on Poverty and Social Policy (CPSP) at Columbia University, show that expansions in various social insurance programs over the past half-century have markedly reduced poverty. The data show social insurance programs had only a small effect on poverty in the 1960s, when a number of these programs were in their infancy and were much smaller than they are today or did not yet exist. But by 2019, social insurance programs had reduced the poverty rate under the anchored SPM from 22 percent before income from the programs is counted to 11 percent when that income is taken into account. Moreover, these data (and other data in this paper on the antipoverty effects of social insurance programs) understate those effects because they are based on Census data in which the number of people receiving various benefits is undercounted (Meyer, Mok, and Sullivan 2009).4
Another way to track the increased anti-poverty effectiveness of social insurance is to examine what percentage of people who are poor before social insurance are lifted above the poverty line by it. The Center on Budget and Policy Priorities (using an SPM anchored to 2019 – that is, an SPM in which the poverty-line thresholds for years before 2019 are adjusted for inflation) has shown that in the late 1960s, government benefits and taxes lifted out of poverty approximately 5 percent of those who would otherwise be poor, while by 2019, benefits and taxes lifted out of poverty about 48 percent of those who would otherwise be poor.
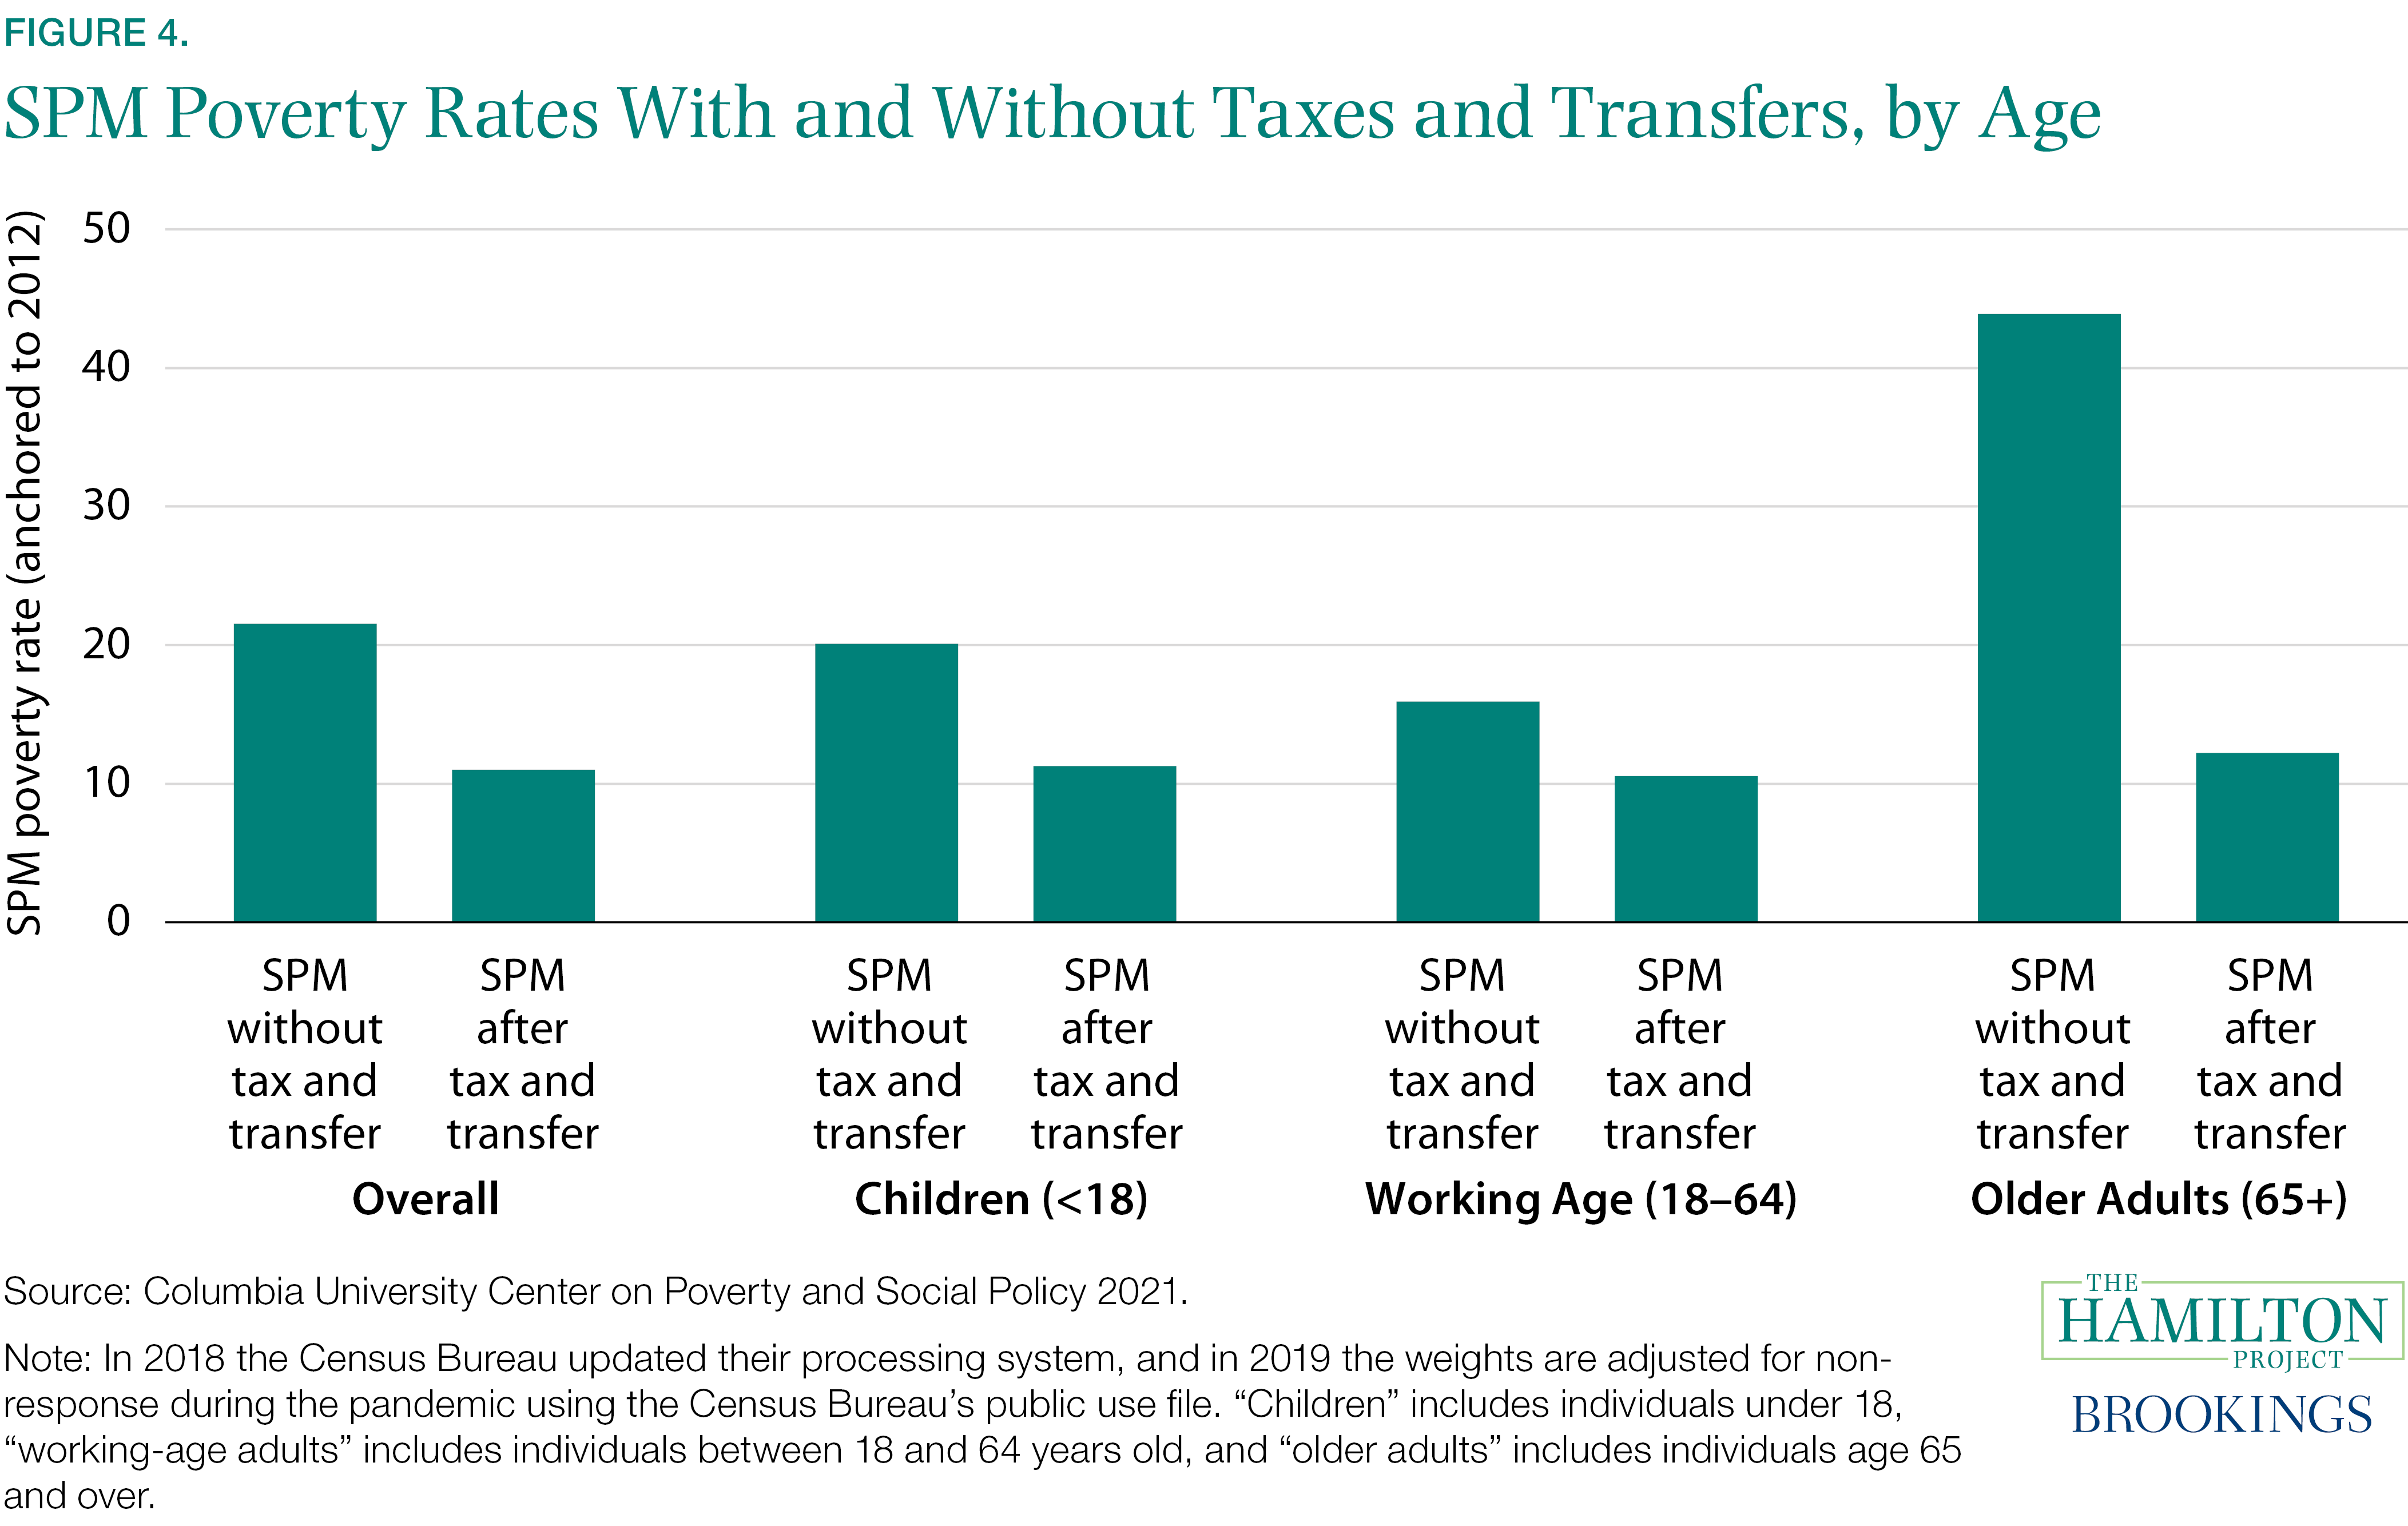
Looking across the age distribution (figure 4), the impact of social insurance programs on poverty is especially noteworthy for children and older adults. Older adults have the largest reduction in poverty as a result of the social insurance system, because Social Security is such a large source of income for the elderly (Some 74 percent of Social Security benefits go to retirees and their dependents; SSA 2021). Before taxes and transfers, households whose oldest member is age 65 or more—who compose the bulk of Social Security recipients—have the highest poverty rates of any age group; after the effects of the Social Security system and various other programs are taken into account, the poverty rate for older adults is dramatically lower, although it still is somewhat higher under the SPM than the poverty rate for children and working-age groups. With respect to children, the SPM child poverty rate before benefits and taxes was 20 percent in 2019. After benefits and taxes are taken into account, the child poverty rate was 11 percent.
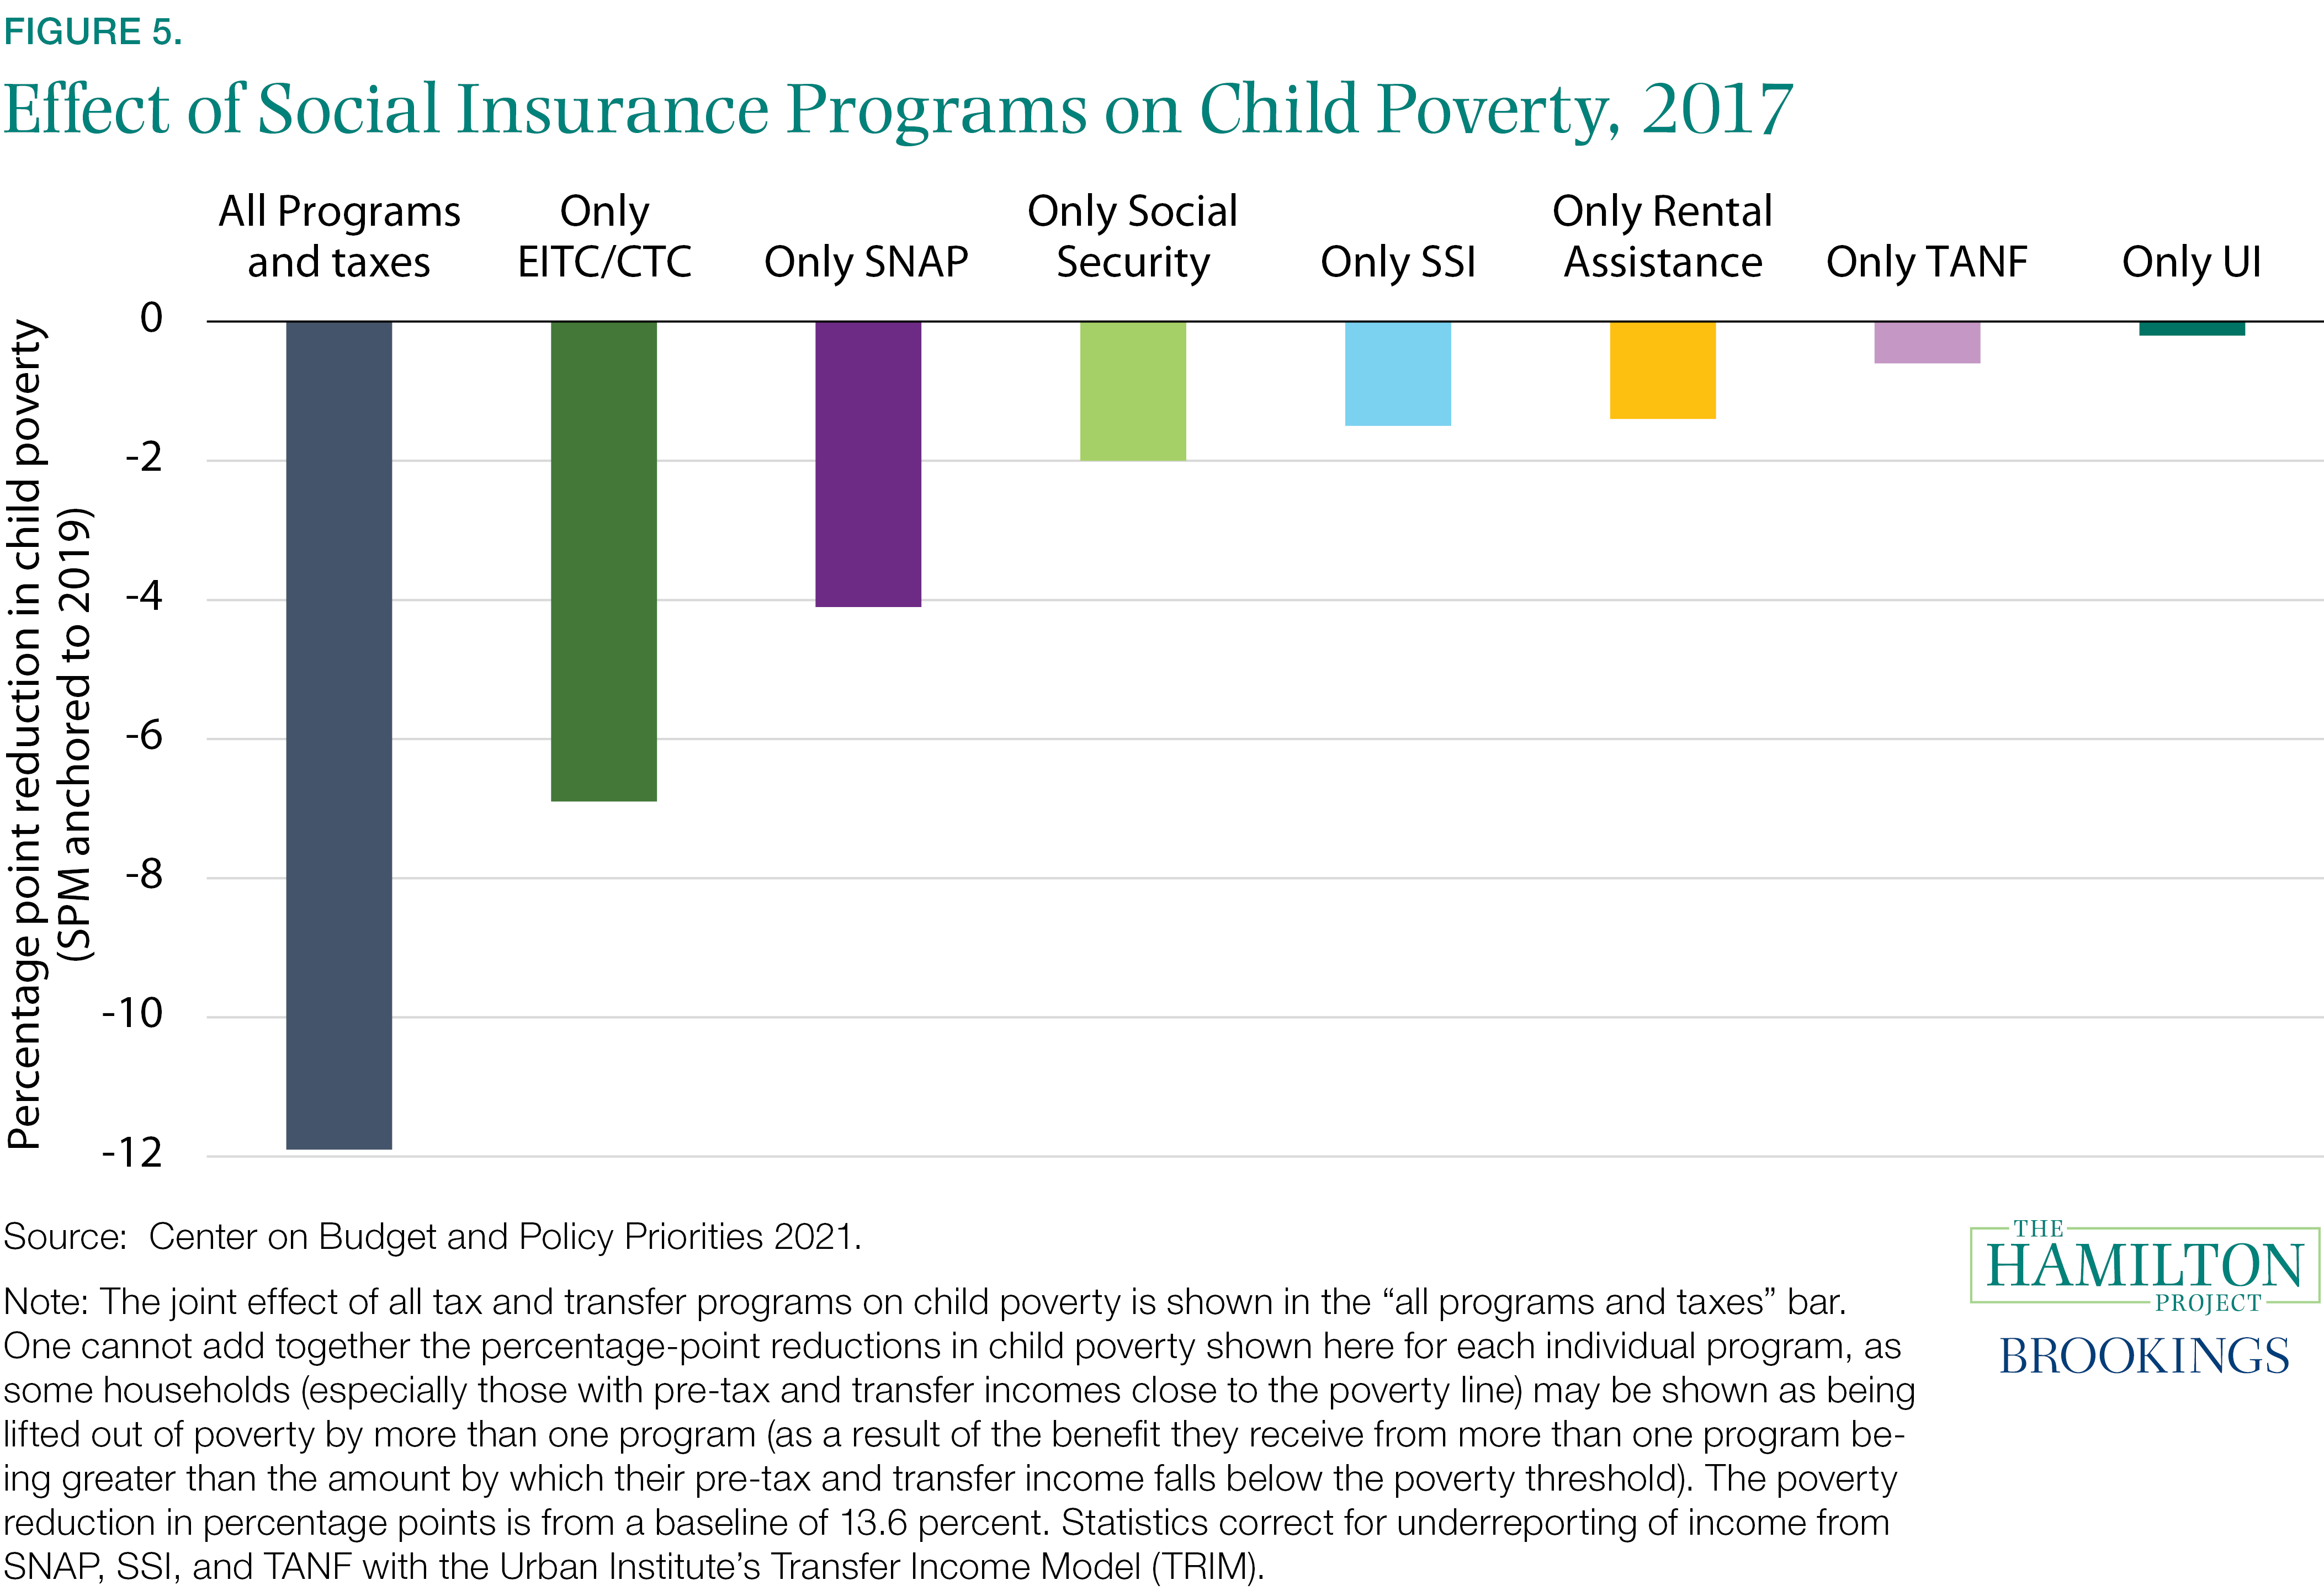
Figure 5 displays data produced for THP by Danilo Trisi and Matt Saenz of the CBPP, showing that the large reduction in child poverty that results from benefits and taxes stems in substantial part from the EITC, CTC, and SNAP. The EITC and CTC together reduced child poverty by nearly 7 percentage points in 2017. SNAP, considered by itself, reduced the overall child poverty rate by more than 4 percentage points. (In 2009, during the Great Recession, SNAP had an even larger effect on child poverty reduction at more than 5 percentage points. In addition, UI reduced child poverty by 2 percentage points that year.)
Nonetheless, for some groups of children, poverty rates after taxes and transfers remain very high. The National Academy of Sciences found that in 2015, child poverty rates for Black and Hispanic children were more than twice as high as non-Hispanic white children. The same report found that children of single parents endure double the poverty rate of a two-parent household (NAS, 2019).
Poverty and Race
Poverty rates have long been significantly higher for Black and Hispanic households than for non-Hispanic white households due to numerous factors, including discrimination and disparities in access to employment, education, and health care. Another CBPP analysis found that in 2017, government assistance programs cut the white poverty rate by more than half, the Black poverty rate by 44 percent, and the Hispanic poverty rate by 37 percent (CBPP 2013–17). In part, these findings reflect the fact that, on average, poor white families have incomes before government benefits that are closer to the poverty line than do poor Black and Hispanic families. As a result, a given amount of assistance will tend to lift a larger share of poor white people over the poverty threshold than of poor non-white people. Those figures also reflect the fact that a larger share of poor Hispanic people, in comparison to poor white or Black people, are ineligible for many social insurance programs due to factors related to immigration status. Nonetheless, over time the Black and Hispanic poverty rates have declined significantly, particularly after government assistance and taxes (Trisi and Saenz 2021).
An analysis of the anti-poverty impact of social insurance programs by race is incomplete, however, if it looks only at reductions in poverty rates—i.e., at the share of people who would otherwise be poor that the programs lift above the poverty threshold. It’s important also to look at the reduction by race in the poverty gap — the amount by which all poor families—or all poor families in a racial or ethnic group—fall below the poverty line.5 Analysis by CBPP of the effect of federal programs and taxes on the poverty gap by race finds that in 2017, programs and taxes reduced the poverty gap among white households by 73 percent, the Black poverty gap by 69 percent, the Hispanic poverty gap by 60 percent, and the Asian poverty gap by 46 percent.
Income Inequality and Social Insurance
Another important measure, in addition to measuring how the social insurance system affects poverty, is the system’s effect on inequality. The social insurance system in combination with the broader tax system – which includes various tax credits and other tax expenditures – significantly reduces income inequality. But inequality remains quite wide in the United States, and policymakers should consider ways to make the social insurance system more effective on this dimension.
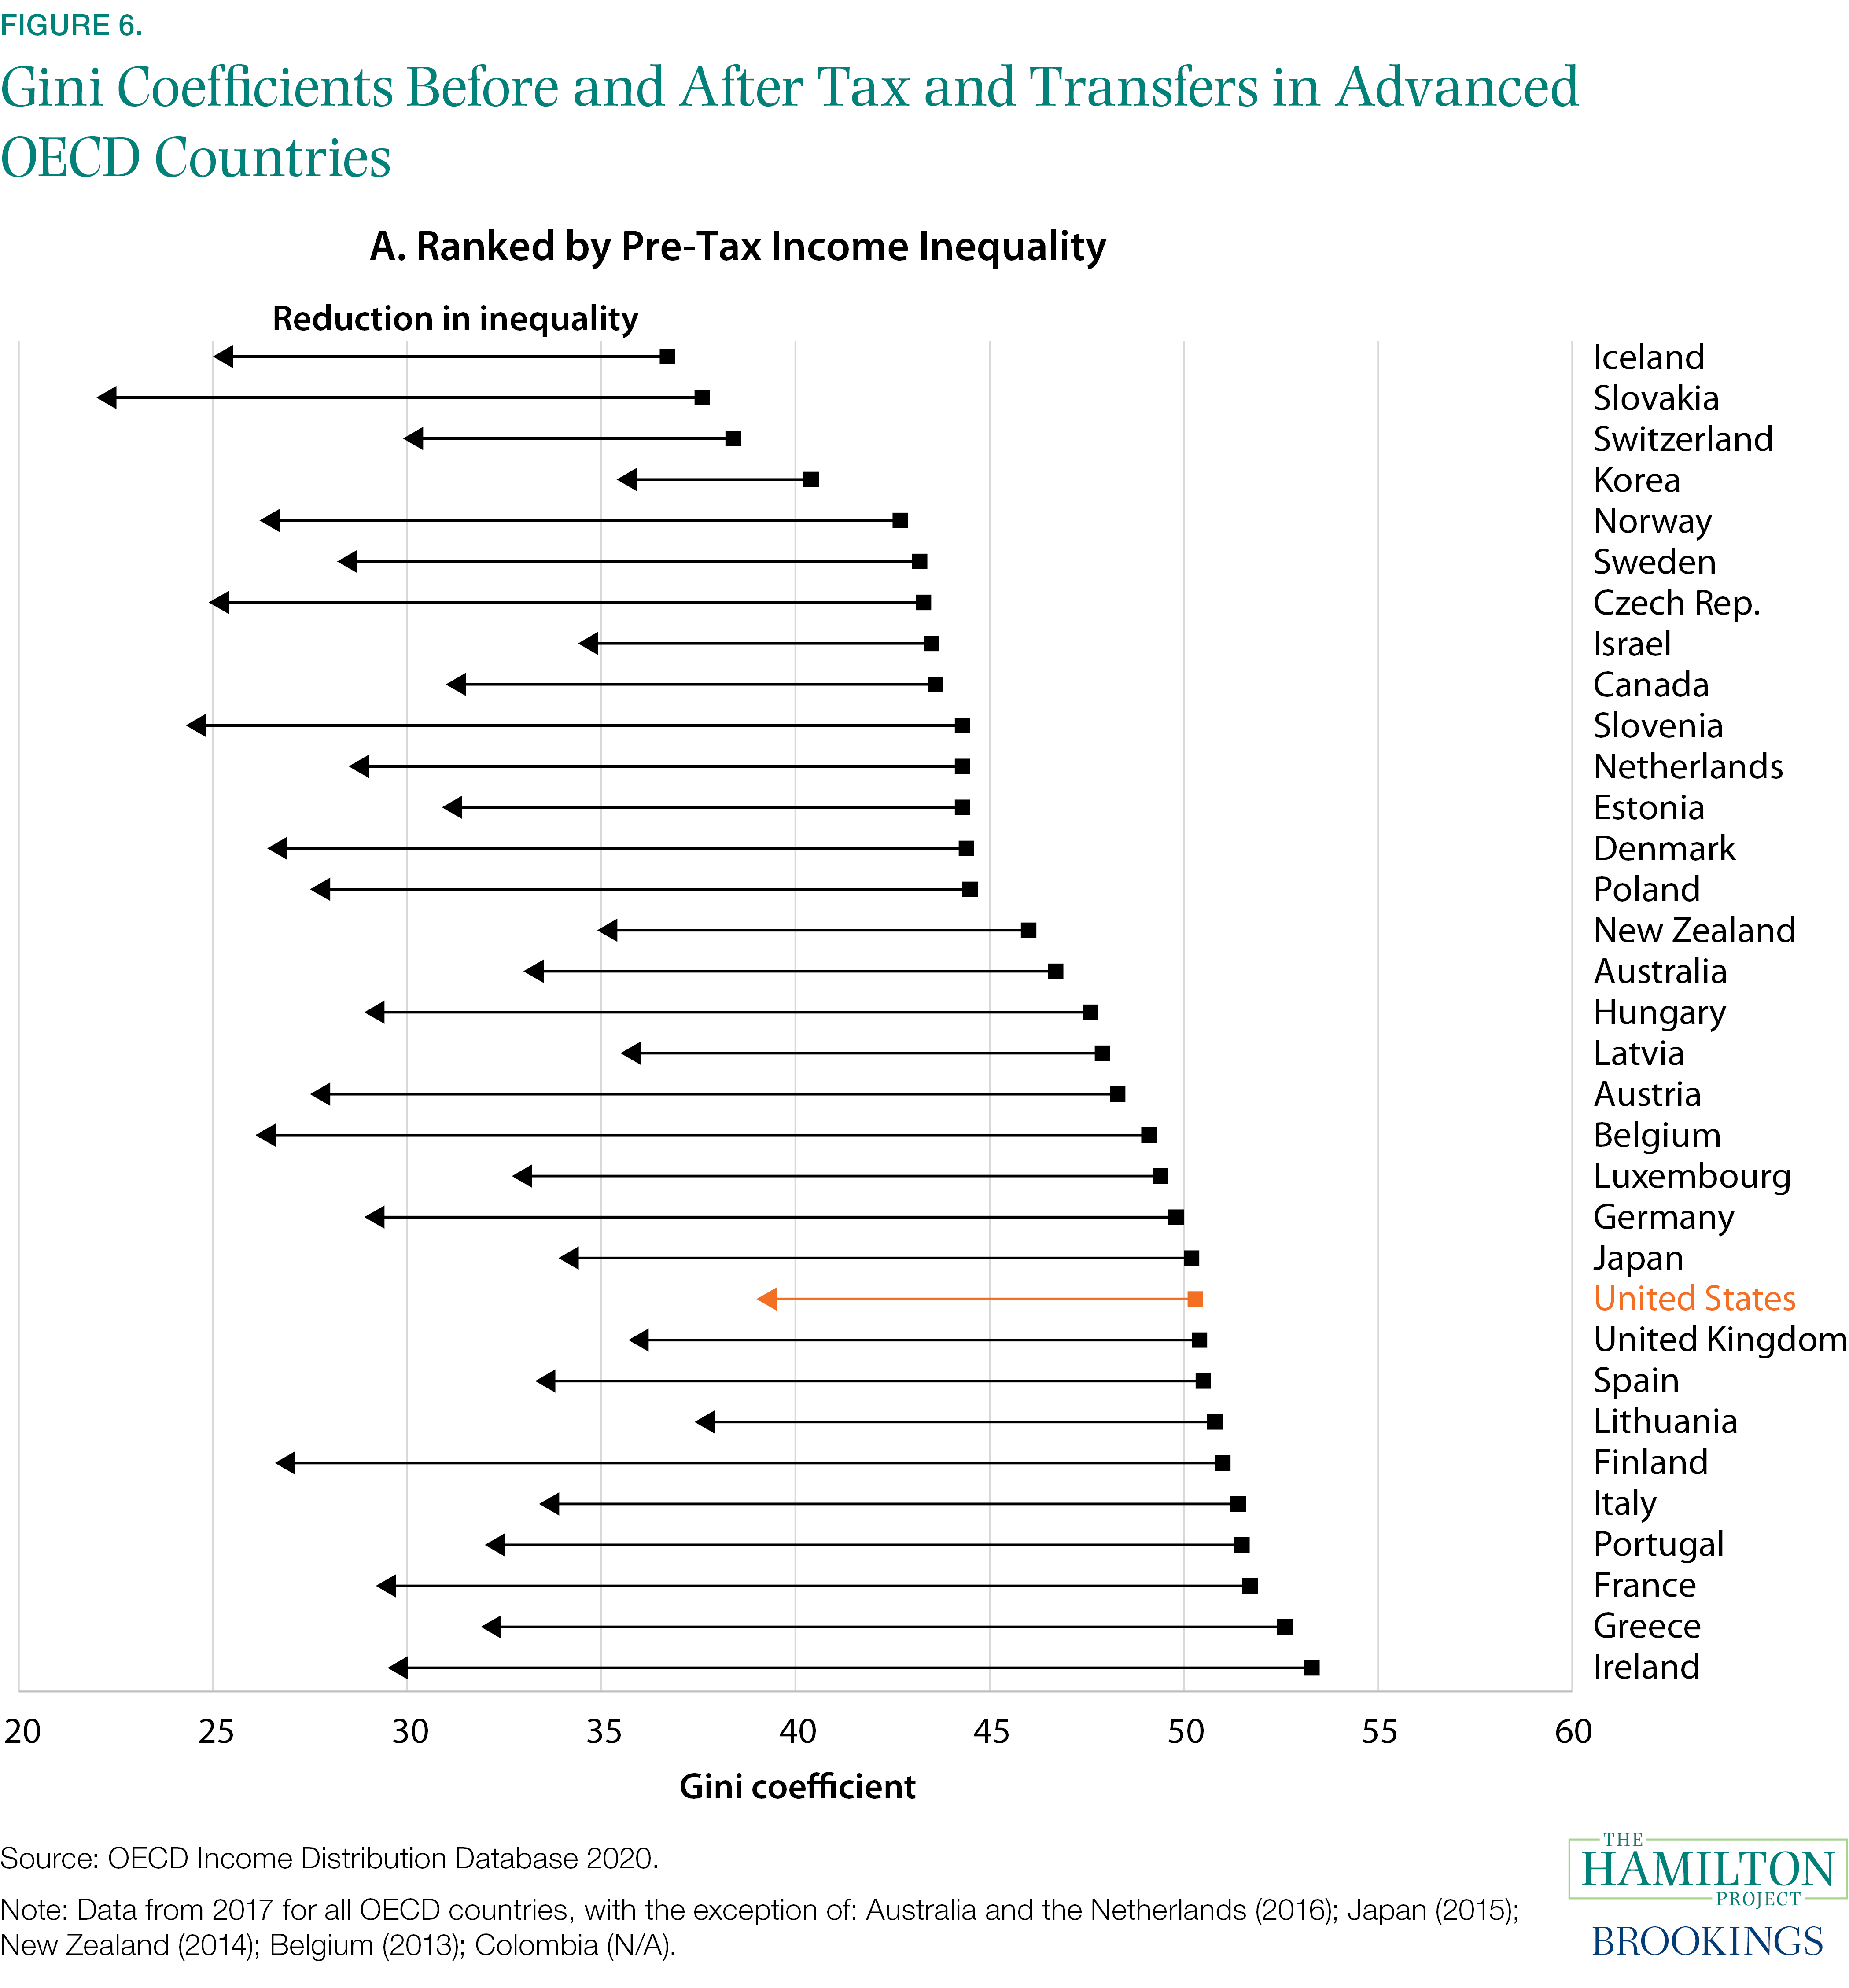
A common way to gauge the reduction in inequality that results from a country’s policies is by looking at how the tax and transfer system of the country (i.e., the country’s social insurance and tax systems) affects what is known as the country’s Gini coefficient, which measures the degree of income inequality. A country in which everyone has the exact same income would have a Gini coefficient of 0. A country in which one person earned all the income and everyone else had no income would have a Gini coefficient of 1. Hence, a higher Gini coefficient reflects greater income inequality.
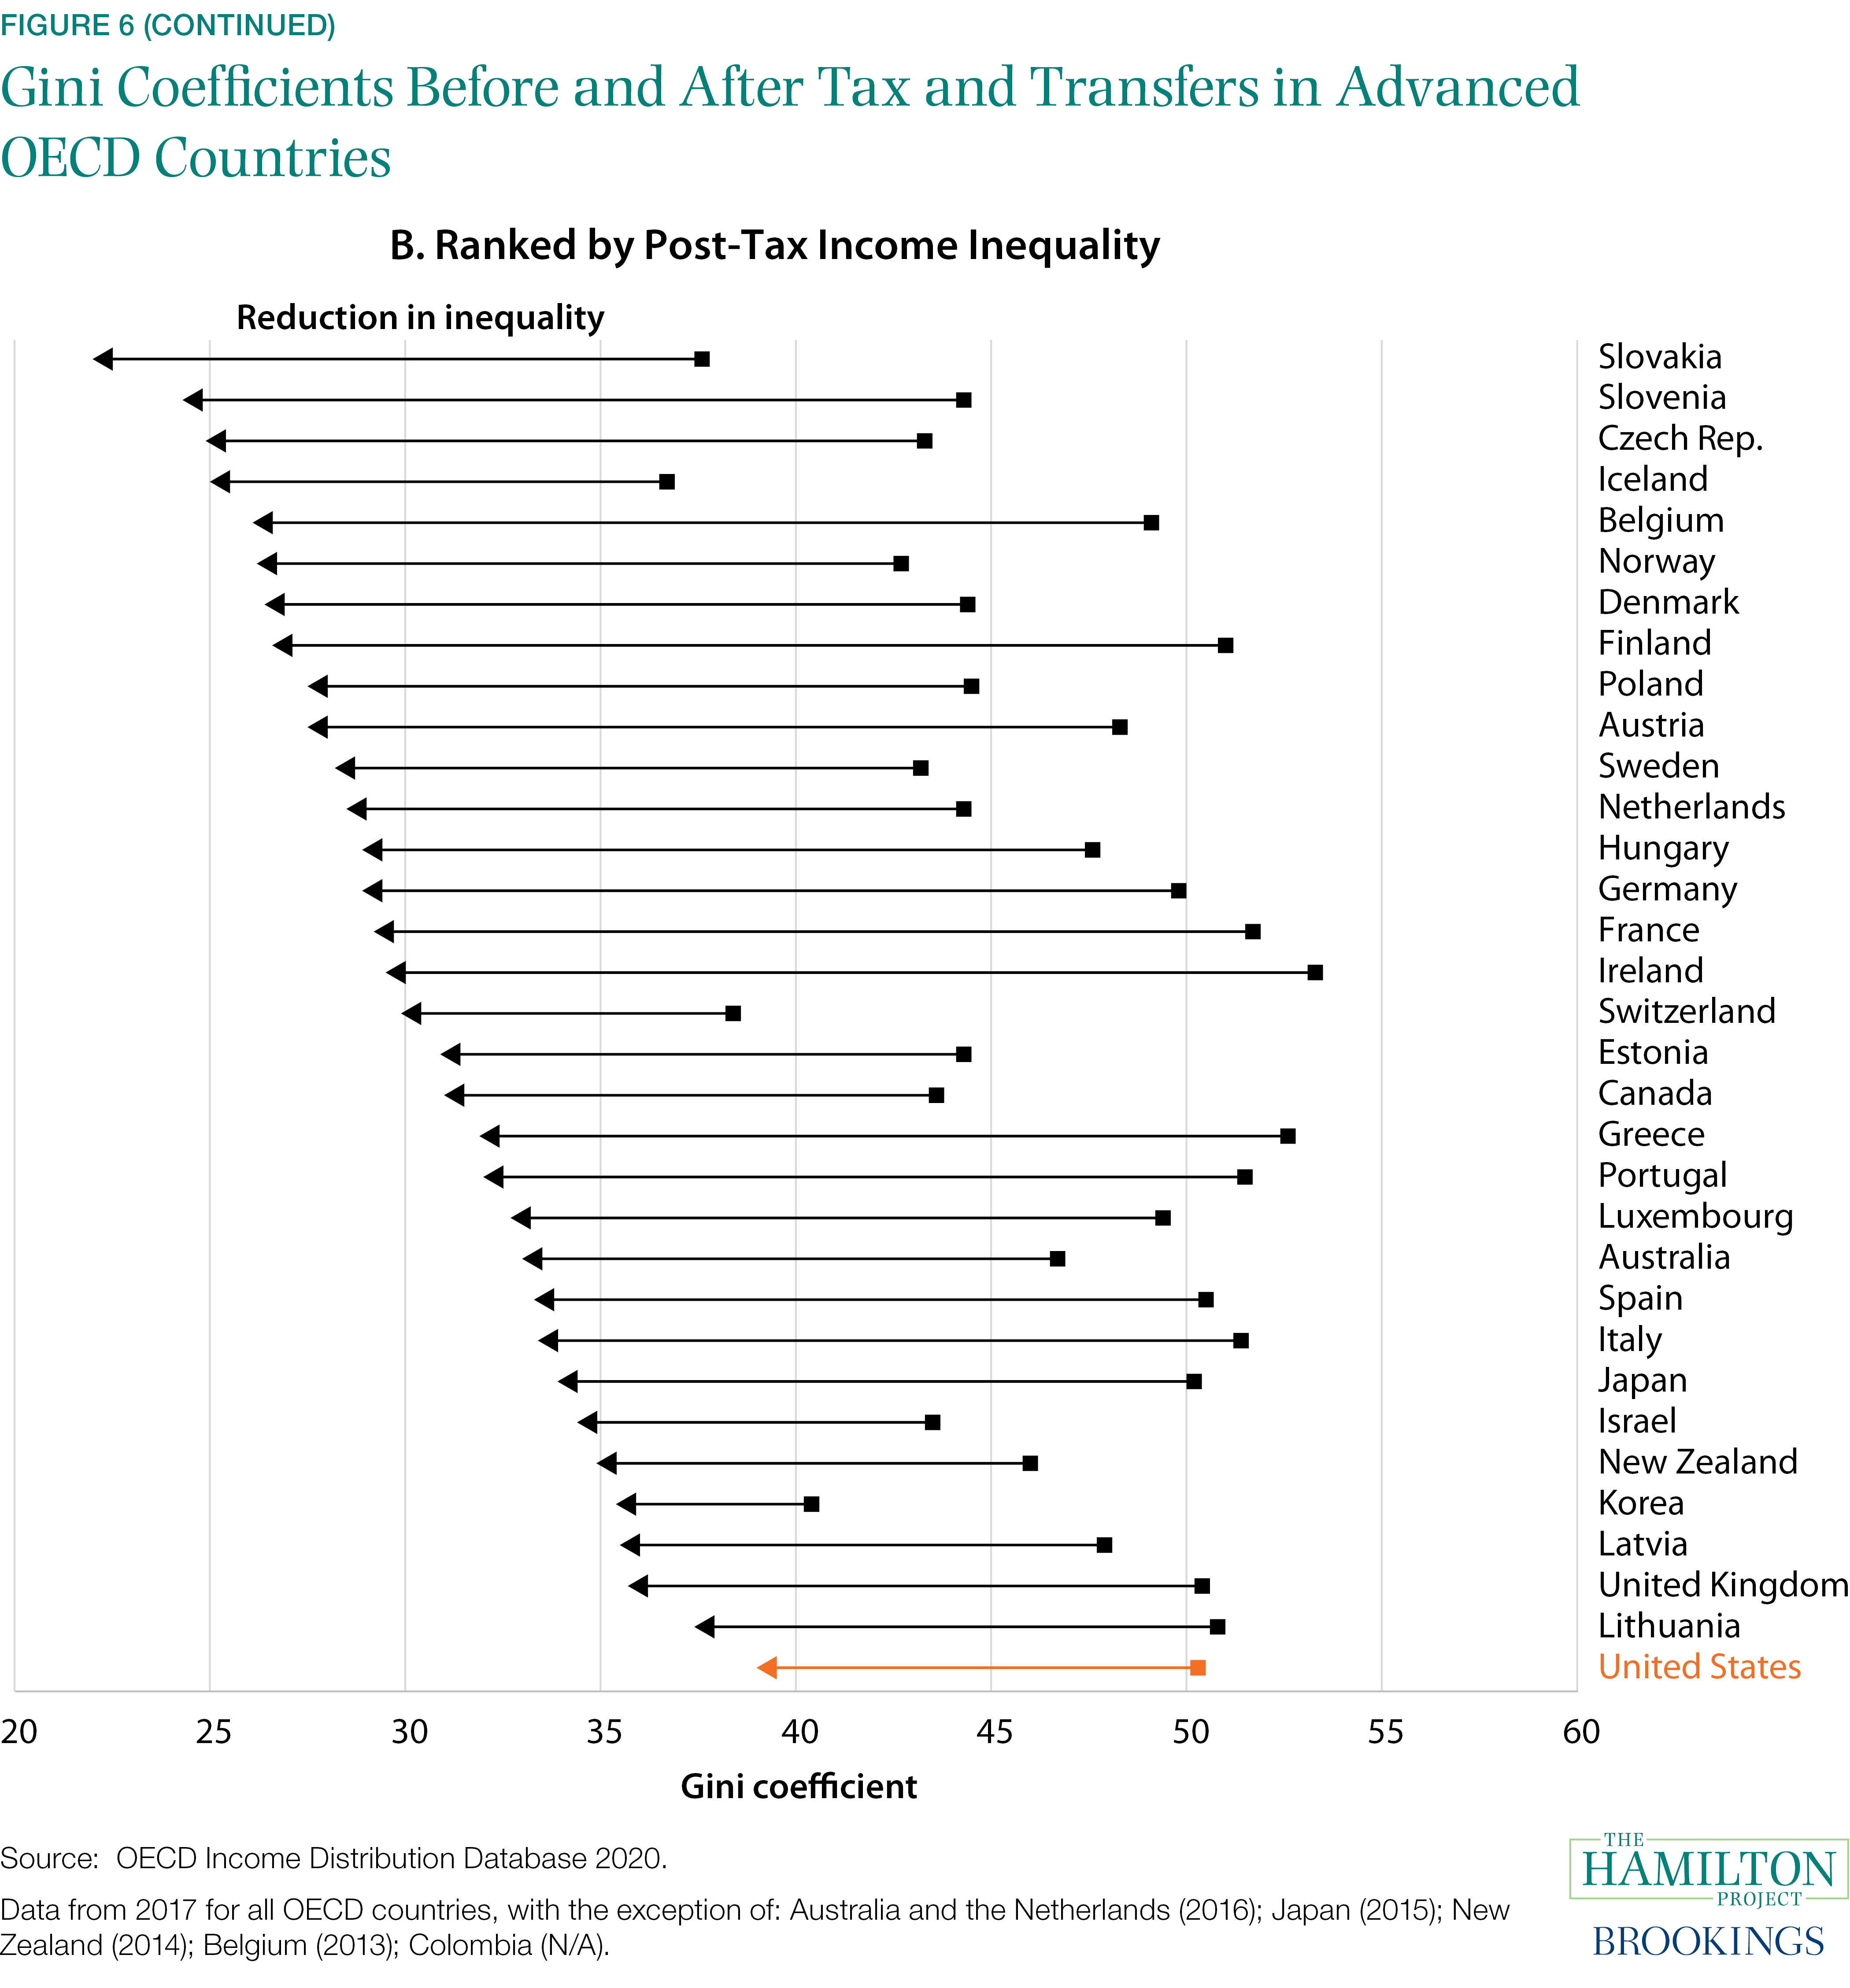
Figure 6a shows Gini coefficients across the advanced Organisation for Economic Co-operation and Development (OECD) countries both before taxes and transfers are taken into account and after taxes and transfers are considered. In this figure, countries are ranked by their Gini coefficients before tax and transfers are taken into account. The United States, shown in red, has among the highest levels of income inequality before taxes and transfers. Figure 6b then ranks the countries again based on their Gini coefficients, with the rankings in this figure reflecting where the countries stand after taxes and transfers are taken into account.
As the two figures show, tax and transfer systems reduce income inequality in all the other advanced OECD countries. The United States, however, not only is among the countries with the greatest inequality before taxes and transfers; it also has the widest inequality after these policies are taken into account. This is a result both of pretax and transfer income inequality being high in the United States relative to the other advanced OECD countries and of the reduction in inequality from taxes and transfers (shown by the length of the arrows in the figures) being smaller in the United States than in most other OECD countries.
Chapter 2. High-level Descriptions of Social Insurance Programs
This chapter describes the major social insurance programs within five broad categories:
- Education and Workforce Development
- Health
- Income Support
- Nutrition
- Shelter
The descriptions that follow give only a sense of the scope and structure of the major programs. They are not meant to be (nor could they possibly be) exhaustive. In addition, we touch on the efficacy of these programs and summarize Hamilton Project proposals to improve various aspects of the social insurance system.
1. Education and Workforce Development Programs
Education and workforce development is a broad category. It includes a wide range of programs from those that support early childhood education, which can also function as child-care programs for children younger than three years old, to student loan programs for college and graduate students, to workforce development programs for workers in midcareer.
Early Childhood Care and Education (ECE)
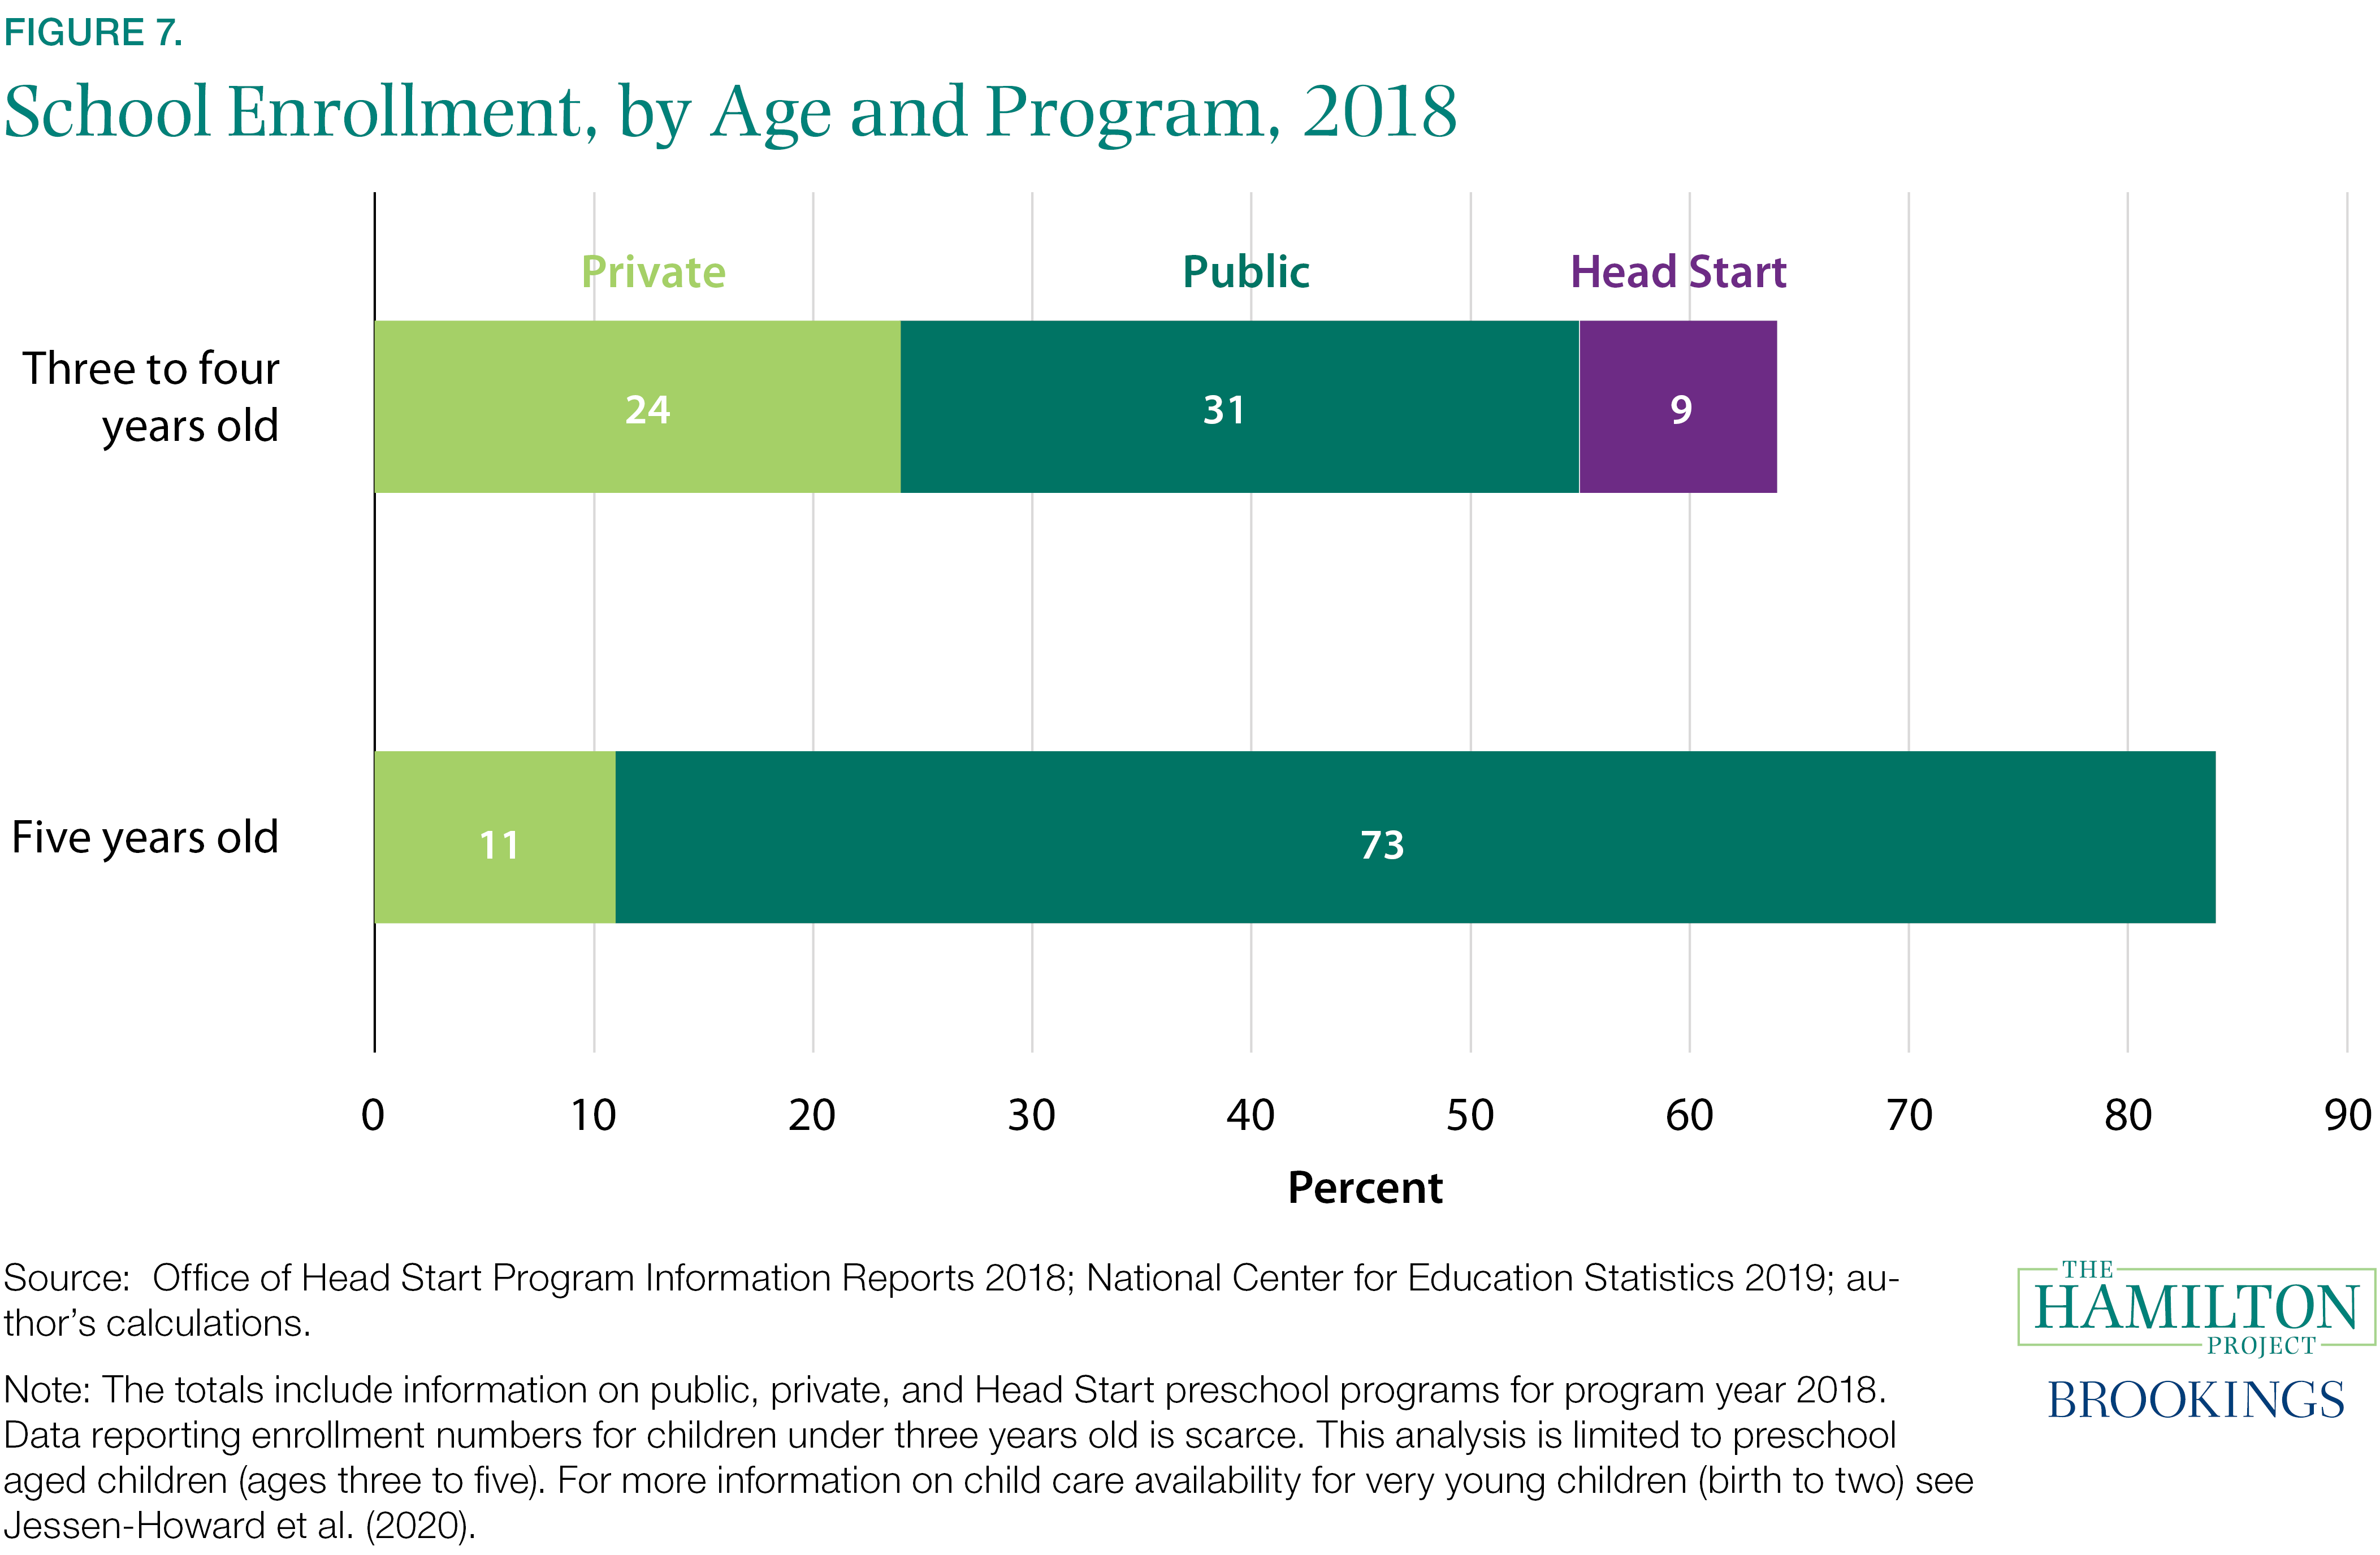
ECE is a term used to describe center-based care and other nonparental forms of supervised child care. ECE can refer to preschool or pre-kindergarten programs that support children’s early social and academic development as well as day care. Programs that support access to child care for eligible families include Early Head Start, Head Start, the Child Care Development Fund (CCDF), and the Preschool Development Grant (PDG). As of 2019 there were 5.4 million children in a federal or state ECE program. In 2017, $34 billion was spent on ECE services by governments in the United States, with states and local governments spending $12 billion and the federal government spending $22 billion (Gould and Blair 2020). As seen in figure 7, of children aged three and four who participate in a preschool program, 63 percent participate in a public program, including Head Start. Nonetheless, there is not sufficient capacity for all eligible families to be served by the public programs. As a result, many lower-income families do not have the resources to enroll their children in a preschool program. (Workman and Jessen-Howard 2018; Malik 2019).
The benefits of ECE programs are well-documented. Evidence on the short- and long-term effects of ECE typically relates to the outcomes of specific programs, whether the evidence comes from the landmark evaluations of Perry Preschool, Abecedarian, and Head Start, or from the rollout of state preschool programs (see Cascio 2021 for a review). A meta-analysis of research on ECE concludes that children who participate in ECE programs in their first five years have lower rates of repeating a grade and higher high school graduation rates (McCoy et al. 2017).
Head Start and Early Head Start
Head Start and Early Head Start are the largest directly federally-funded ECE programs. Since these programs began, they have served more than 37 million children from birth to age five. Head Start and Early Head Start aim to reduce poverty by creating comprehensive preschool programs to meet children’s emotional, social, health, nutritional, and psychological needs. Income thresholds vary by location, but the majority of Head Start seats go to low income children.
In the 2018–19 school year, Head Start and Early Head Start accounted for nearly $10 billion in federal spending on ECE, funding about 927,000 seats. The average annual spending per child enrolled in the program is $11,000 (National Head Start Association 2020). Over the past decade, with an expansion of the Early Head Start program, enrollment of children under age three has increased, but in 2020, only 36 percent of eligible children aged three to five and 11 percent of eligible children under the age of three had access to Head Start or Early Head Start (National Head Start Association 2021).
Evidence shows that participation in the Head Start program has positive short- and long-term impacts. In the short-term, Head Start improves kindergarten readiness and academic outcomes through third grade (Feller et al. 2016; Kline and Walters 2016). Head Start is more effective in combination with more generous grade school spending (Johnson and Jackson 2019). Research also shows that Head Start improves outcomes including better health outcomes and additional education attainment (Deming 2009; Garces et al. 2002; Bauer and Schanzenbach 2016). In addition, Head Start increases positive parenting practices (Bauer and Schanzenbach 2016) and lessens the intergenerational transmission of poverty (Barr and Gibbs 2017). ECE and care also have positive employment effects for parents (Morrissey 2017; Davis et. al 2018).
Child and Dependent Care Tax Credit (CDCTC)
CDCTC subsidizes a portion of child-care costs, primarily for middle-income families. It has no upper-income limit, so high-income families qualify as well. Until the pandemic and recession, however, the credit offered little or no support for low- or modest-income families because the credit was not refundable—in other words, it was not available to those who did not earn enough to owe federal income tax. The ARP changes this feature temporarily; for 2021, the credit is both enlarged and made fully refundable, so low-income families who incur out-of-pocket child-care costs can qualify.
Early Childhood Education Block Grants
ECE block grants provide states with funds to provide high-quality child care (Vesley and Anderson 2009). For low- and modest-income families, funding from those grants is the principal source of child-care support. ECE block grants include the CCDF and PDG. States can use these funds to support child-centers and/or provide vouchers to lower-income families to help defray their child-care costs. These funds are not an entitlement and so the associated programs have limited funding; as a result, only about one in six eligible children benefit from those programs (National Women’s Law Center 2019).
Nonetheless, early evidence shows that the PDG supports either increased enrollment or enhancements in state preschool programs (Friedman-Krauss et al. 2020). A summary report on the PDG shows that enrollment in PDG-funded classrooms increased by 87 percent over the four years after the grant was administered. This means that twice as many families and children had access to high-quality care in the fourth year of the grant as in the first year (OESE 2019).6
Under the CCDF, states have broad flexibility to design programs within a set of federal guidelines. Research shows that differences in parental time-use and other eligibility requirements across states create burdens for both parents and administrators, limiting the ability for families to have steady child care (Adams et al. 2014; Adams and Heller 2015; Jenkins and Ngyuen 2019; Johnson-Staub, Matthews, and Adams 2015). In addition, Herbst and Tekin find evidence that subsidies are associated with negative child development outcomes because expanding access without ensuring quality increases exposure to lower-quality center-based care (Herbst and Tekin 2008).
Postsecondary Education
Since the introduction of federal student aid programs in the mid-1950s, the federal government has subsidized the cost of postsecondary education, lowering barriers for students with financial need. The annual Free Application for Federal Student Aid (FAFSA) form acts as a yearly application for the primary federal need-based aid programs: Federal Pell Grants, Direct Subsidized Loan Program, Federal Supplemental Educational Opportunity Grants (FSEOG), and Federal Work-Study (FWS). The FAFSA feeds into a formula that calculates eligibility using the difference between the cost of attendance and an estimated expected family contribution.
In the 2019–20 academic year, undergraduate and graduate students received an estimated $143 billion in combined financial support in the form of grants, student loans, and tax benefits from federal programs (College Board 2020). While federal support generally targets students, state and local governments support the operations of in-state schools. Nearly 80 percent of the $103 billion in combined higher education funding from state and local governments went to such operations while 11 percent was targeted to financial aid grants for students (Laderman and Weeden 2020).
Those with postsecondary credentials have better labor market outcomes than those who do not, but these are not the only benefits that these degrees confer. In general, much of the evidence for the value of a postsecondary education indicates that degree holders both earn more and have better nonpecuniary outcomes, including higher rates of community engagement and overall healthier lives (Oreopoulos and Petronijevic 2013; US Department of Education [ED] 2016). In addition, those with a postsecondary degree are better able to weather economic downturns. For example, they enjoyed significant better labor market outcomes after the Great Recession (Carnevale, Jayasundera, and Gulish 2016; Greenstone and Looney 2011).
Pell Grants and On-Campus Programs
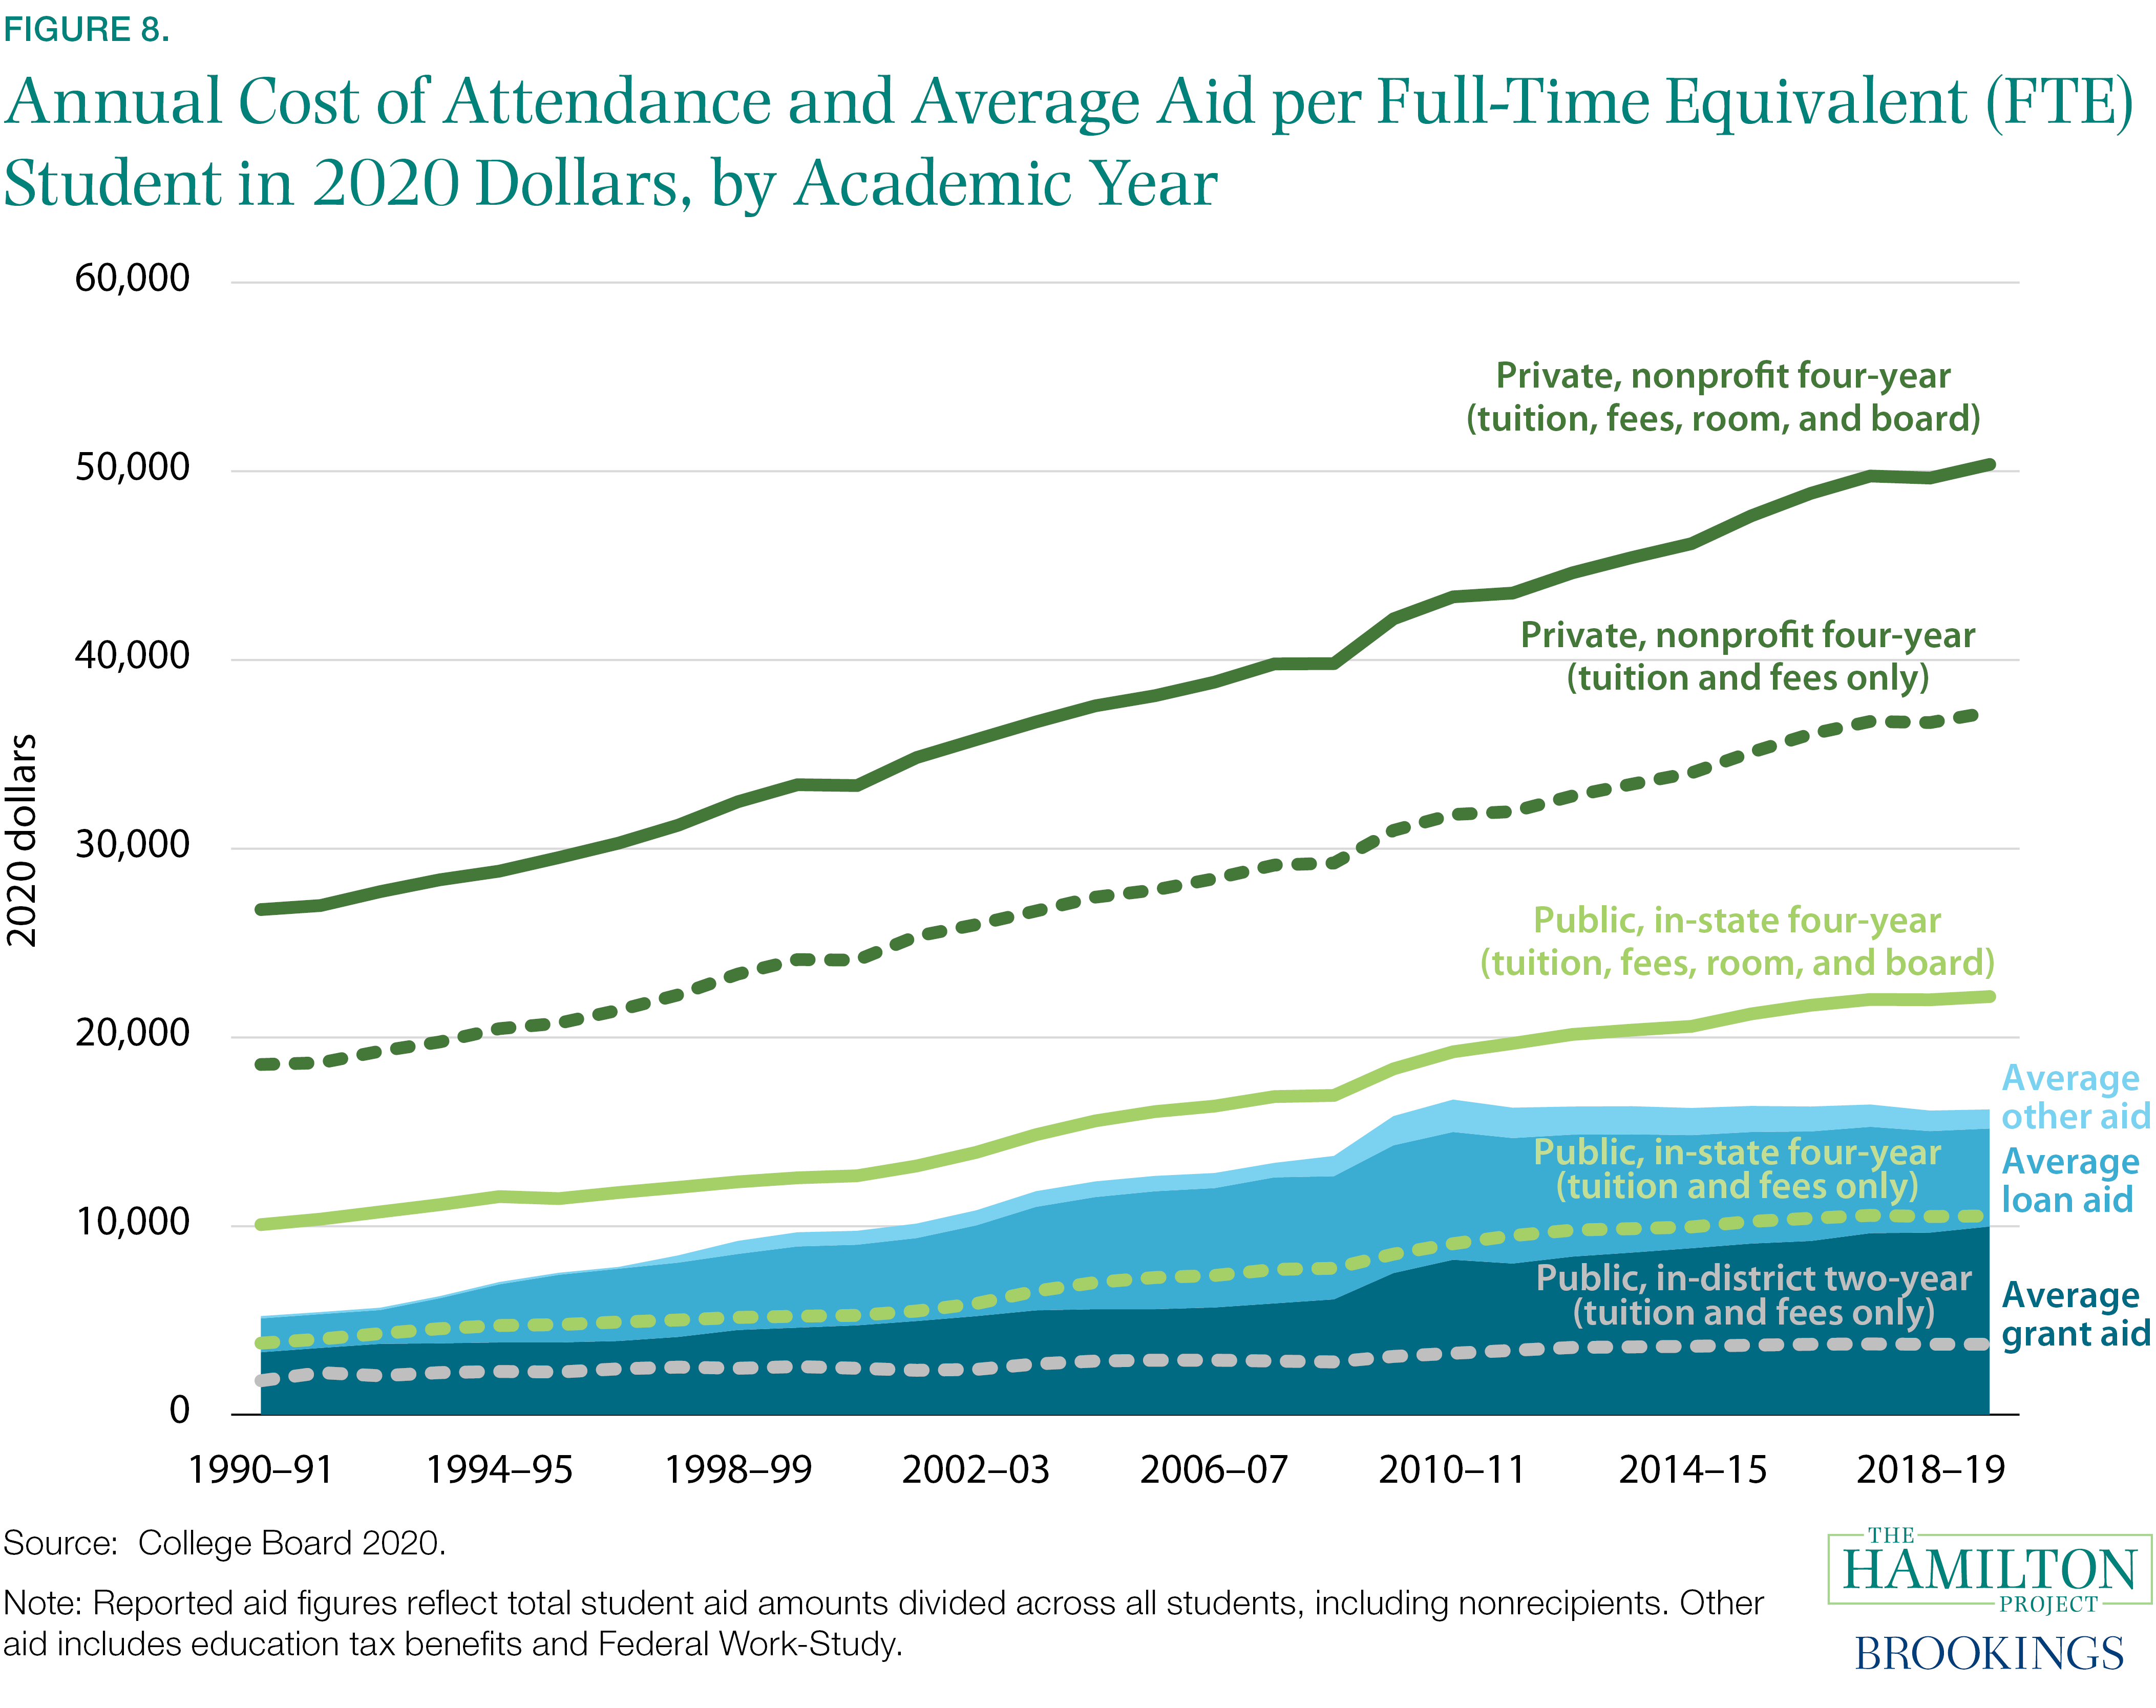
The Federal Pell Grant Program is the largest single postsecondary grant program, awarding nearly $28 billion in grant aid to 6.7 million low-income college students in the 2019-20 academic year (College Board 2020). The maximum Pell Grant award, which was $6,495 for the most recent award year (Federal Student Aid 2021) , has not kept up with the sticker price of a four-year degree; grant aid has been falling as a share of cost of attendance for decades (figure 8). In 2017 the maximum Pell Grant covered just 29 percent of the average costs of tuition, fees, room, and board at a public four-year college, compared with 79 percent in 1975 (Protopsaltis and Parrott, 2017). The remaining annual cost increasingly falls to students and their families, where a large majority turn to student loans for help.
Three additional programs under the Higher Education Act (HEA), known as on-campus programs, are unique among needs-based student aid programs in that schools’ financial aid offices determine the mix and amount of aid awarded and are required to formulaically match federal funds. These programs include the FSEOG program, which allows schools to award additional grants and loans to students with exceptional financial need, as well as the FWS program, which provides part-time work opportunities either with the school or with participating organizations and businesses.
Evidence shows that recipients of Pell Grants generally have higher transfer rates to four-year institutions and lower drop-out rates than those who do not receive the grant (Mundel and Rice 2008). Extended benefits of Pell Grants, aside from reduced tuition cost, are mixed. Marx and Turner find that students who miss the cut-off for Pell awards end up receiving more on average from other aid sources (Marx and Turner 2015; Scott-Clayton and Park 2015). There is little definitive evidence showing that Pell recipients have higher enrollment, completion, or persistence rates among traditional low-income students (Baum and Scott-Clayton 2013; Bettinger 2004; Turner 2014). Research regarding the impacts of on-campus programs is scant. Current evidence is limited to single-institution or state data, and the findings are inconsistent (Scott-Clayton 2011; Scott-Clayton and Minaya 2014; Stinebrickner and Stinebrickner 2003).
Student Loans
Needs-based Direct Subsidized Loans are available only to undergraduate students and provide the most favorable borrowing terms, including interest rates much lower than market rates. In addition, no interest is assessed while the student is enrolled in school, during a six-month grace period following either graduation or a change from full-time enrollment status, and during periods of authorized deferment. Nonsubsidized loans have the same below-market interest rates as subsidized loans, but interest is assessed immediately. Together, Direct Subsidized and Direct Unsubsidized Loans from the federal government provided 86 percent of the $102 billion in student loans issued for the 2019–20 academic year, including 80 percent of loans to undergraduates and 96 percent of the higher-interest, higher-balance loans to graduate students (College Board 2020). When federal loan payments come due, students may select from a myriad of repayment plans, including income-driven repayment (IDR). IDR plans are designed to make loan repayment more manageable by adjusting required monthly payments according to a borrower’s income, and by offering loan forgiveness on the remaining balance after a period of 20 or 25 years under certain terms.
Most Americans will take out a student loan to cover the cost of their postsecondary education, but the aid from loans can do more than cover educational costs. Yilla and Wessel (2019) find that many students also use the loans to support their cost of living in addition to tuition and fees. Growing evidence shows that a majority of students complete a bachelors degree with less than $40,000 in debt (Council of Economic Advisers [CEA] 2016; Looney, Wessel, and Yilla 2020). Despite their borrowing relatively low amounts, research consistently shows that students of color are more likely to default on payments than are their white counterparts (Harrast 2004; Scott-Clayton 2018; Volkwein and Cabrera 1998; Volkwein and Szelest 1995; Woo 2002). Defaulting on student loans leads to a host of problems: loss of access to repayment tools, damaged credit, increased collection fees, garnished wages, and even ineligibility for other aid programs (PEW 2020).
Tax Incentives
The federal government also lowers the cost of higher education through 12 different tax benefits, including the exclusion of scholarships from taxable income and the deductibility of student loan interest. In all, these tax incentives cost $27 billion annually in forgone revenue at the federal level. The two largest tax credit programs, the American Opportunity Tax Credit (AOTC) and the Lifetime Learning Credit (LLC), which extend credits to low- to moderate-income families for qualifying education expenses of up to $2,500 and $2,000 respectively, combined for 67 percent of total education-tax benefit costs in 2019 (Congressional Research Service [CRS] 2021).
Evidence suggests that the AOTC and LLC have little impact on enrollment nor do they affect college choice, student debt, or tuition paid (Hoxby and Bulman 2015, 2016). Studies show that the complexities of claiming the credits and their delayed delivery blur any significant impact (Dynarski and Scott-Clayton 2018; GAO 2012).
Workforce Development
The US workforce development system functions in a complementary manner to the US higher education system, supporting the training and retraining of experienced workers, jobseekers, and new entrants who typically lack a four-year postsecondary credential. In the broadest sense, workforce development encompasses a variety of programs and institutions aimed at providing job-related skills to workers, including certificate programs at community colleges, vocational courses offered by training providers, and apprenticeship programs, as well as career services like job search assistance and career counseling.
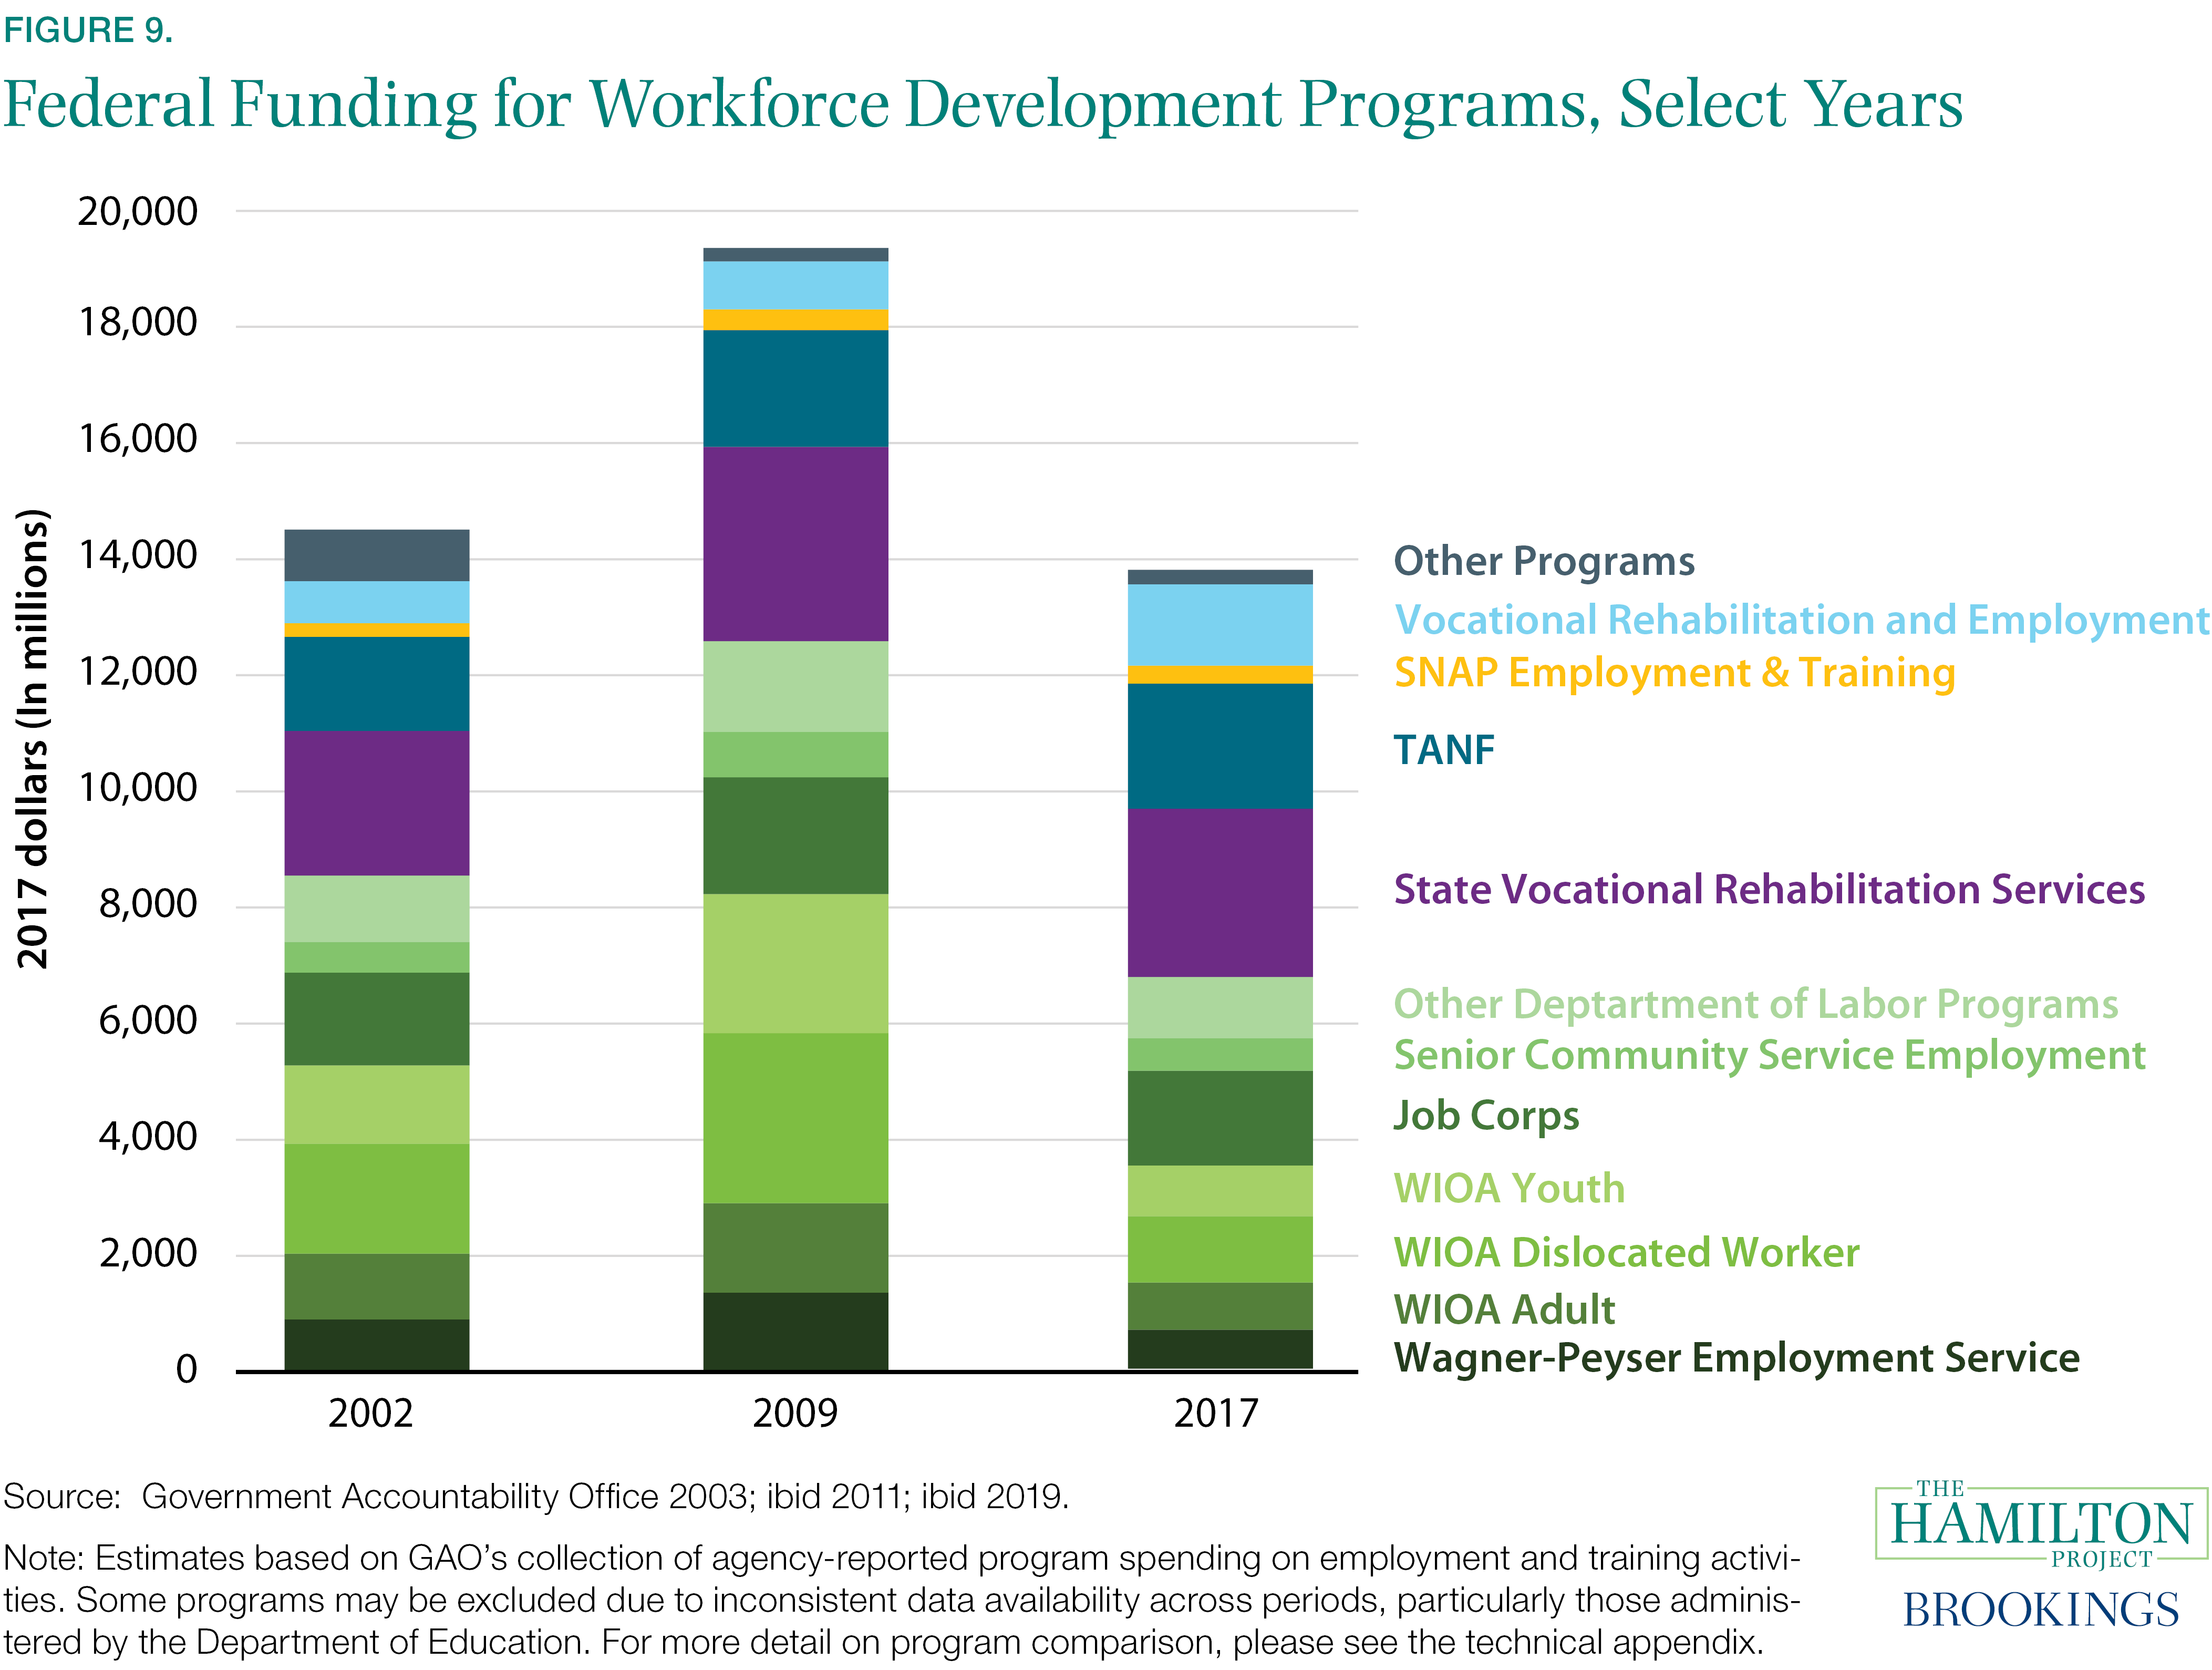
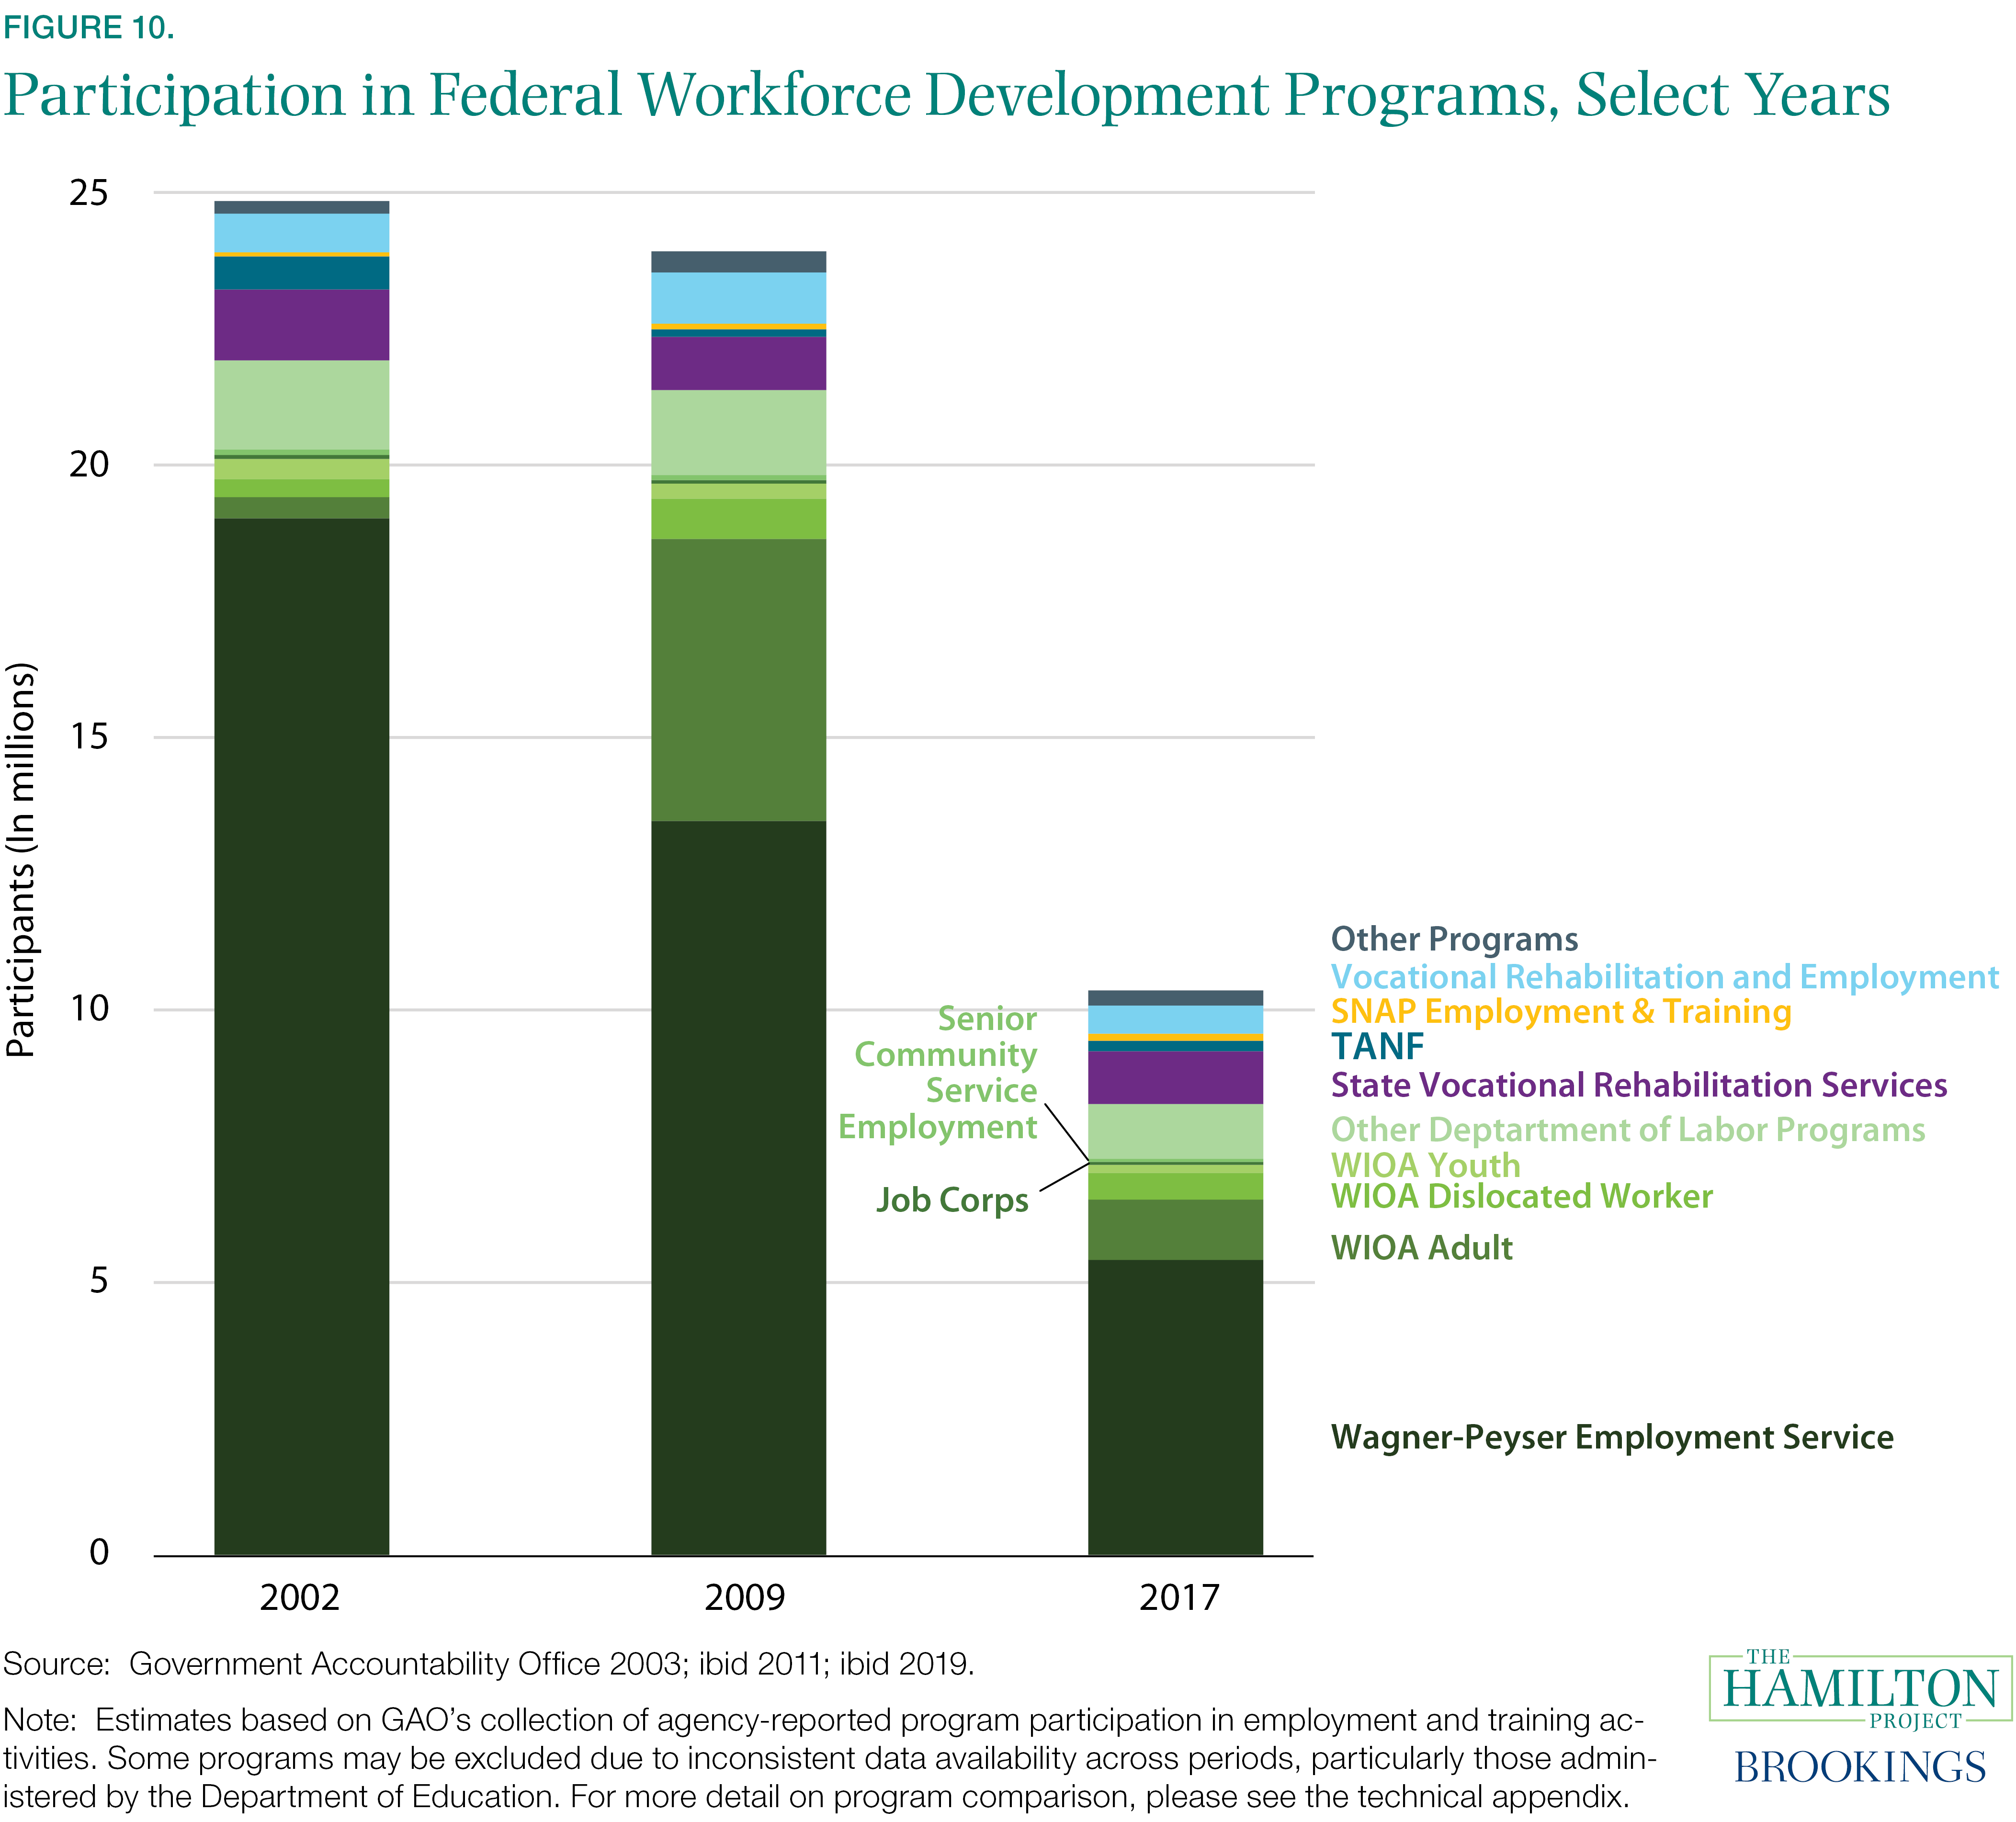
Given underinvestment in training by employers and private entities, the federal government invests in training programs and reemployment services for displaced and disadvantaged workers. The signature workforce legislation at the federal level, the Workforce Innovation and Opportunity Act (WIOA), was signed by President Barack Obama in 2014, reauthorizing the expired Workforce Investment Act (WIA). The collection of WIOA programs is structured to offer adults over age 18 broad access to its range of services, , while also providing priority services to low-income and skills-deficient job-seekers. Several other programs target specific populations including disadvantaged youth, transitioning veterans, and other groups. Together, federal support for employment and training stretches across 43 workforce programs, spanning nine federal agencies, to target various populations of American workers (GAO 2019). Figures 9 and 10 show the training programs and reemployment services funded by WIOA. Aside from employment services, most programs have drastically low take-up. The system is characterized by a lack of coordination and chronic underfunding.
Evidence for the effect of workforce development programs in recent decades is mixed (Bauer, Breitwieser, and Shambaugh 2018; Greenberg, Michalopolous, and Robins 2003). Workforce development programs that focus on particular populations and sectoral programs have been found to be more effective at improving labor market outcomes, including raising wages (Elliot and Roder 2017; Hendra et al. 2016).
THP Proposals: Education and Workforce Development
One THP proposal would significantly increase access to affordable, high-quality ECE by expanding existing Head Start and Early Head Start programs and creating a new program that would stimulate competition among eligible child-care providers and raise compensation for ECE workers. All families would have multiple child-care provider options, and a cap would be placed on the total family payment for child care so that no family goes deeper into poverty to pay for care for their young children. (To learn more, read the THP proposal by Elizabeth Davis and Aaron Sojourner [2021].)
Putting in place job subsidies would help to create jobs in disadvantaged areas. A THP proposal by David Neumark (2018) would create a program of community job subsidies, providing federal funding to partnerships of local employers, nonprofits, and community groups that would identify local needs and administer jobs. These jobs would be restricted to workers with income below 150 percent of the poverty line and be 100 percent federally subsidized for the first 18 months; these workers’ employers would be eligible for a 50 percent subsidy in the second 18-month period. These job subsidies would be targeted to economically disadvantaged areas in which 40 percent or more of individuals are below the poverty line.
Creating a well-prepared workforce will require centers of learning to be responsive to changing business conditions and better able to adapt to new technologies. Another THP proposal calls for providing federal support for online educational credits that would be issued to qualified adults at accredited and registered learning organizations. Program providers would be expected to solicit input from employer groups, professional associations, and unions regarding program offerings. Providers would also be prohibited from charging tuition and fees in excess of reimbursement, thereby encouraging programs to innovate toward lower-cost delivery by making the best use of technology. In addition, a national initiative would be established between federal agencies and a network of competitively selected universities and their partners to accumulate knowledge and inform policy on adult learning. (To learn more, read the THP proposal by Richard Arum and Mitchell Stevens [2020].)
To build a stronger, more-coherent workforce training system, reforms could increase funding for the HEA to enable postsecondary institutions to expand occupational training. To achieve this, another THP proposal would place a modest tax on employers who displace workers through automation, adding incentive for firms to retrain workers rather than displace them. In addition, a permanent version of the Trade Adjustment Assistance Community College and Career Training (TAACCCT) grant program could be introduced to fund partnerships between and among community colleges, workforce training institutions, and states, in order to ensure coordination to improve outcomes for students and displaced workers. (To learn more, read the THP proposal by Harry Holzer [2021].)
Prior THP proposals on human capital development from ECE through workforce development are summarized in Bauer, Breitwieser, and Shambaugh 2018.
2. Health Programs
The United States primarily relies on a mixed health-care delivery system where most people are covered by either public insurance or employer-sponsored insurance, but millions are left out and are uninsured. On the employer-based insurance side, the federal government spent $291 billion in fiscal year 2020 by excluding from taxable income premiums on employment-based health care coverage. Because the value of that tax exclusion increases at higher marginal tax rates and as premiums rise, larger subsidies go to people with higher incomes (CBO 2020a).
The federal government operates four main health insurance programs—Medicare, Medicaid, CHIP, and premium tax credits (which lower the cost of insurance purchased through the Affordable Care Act’s health-insurance marketplaces). In addition, the federal government provides health insurance and health-care access for active-duty military personnel as well as for veterans through the VA system.
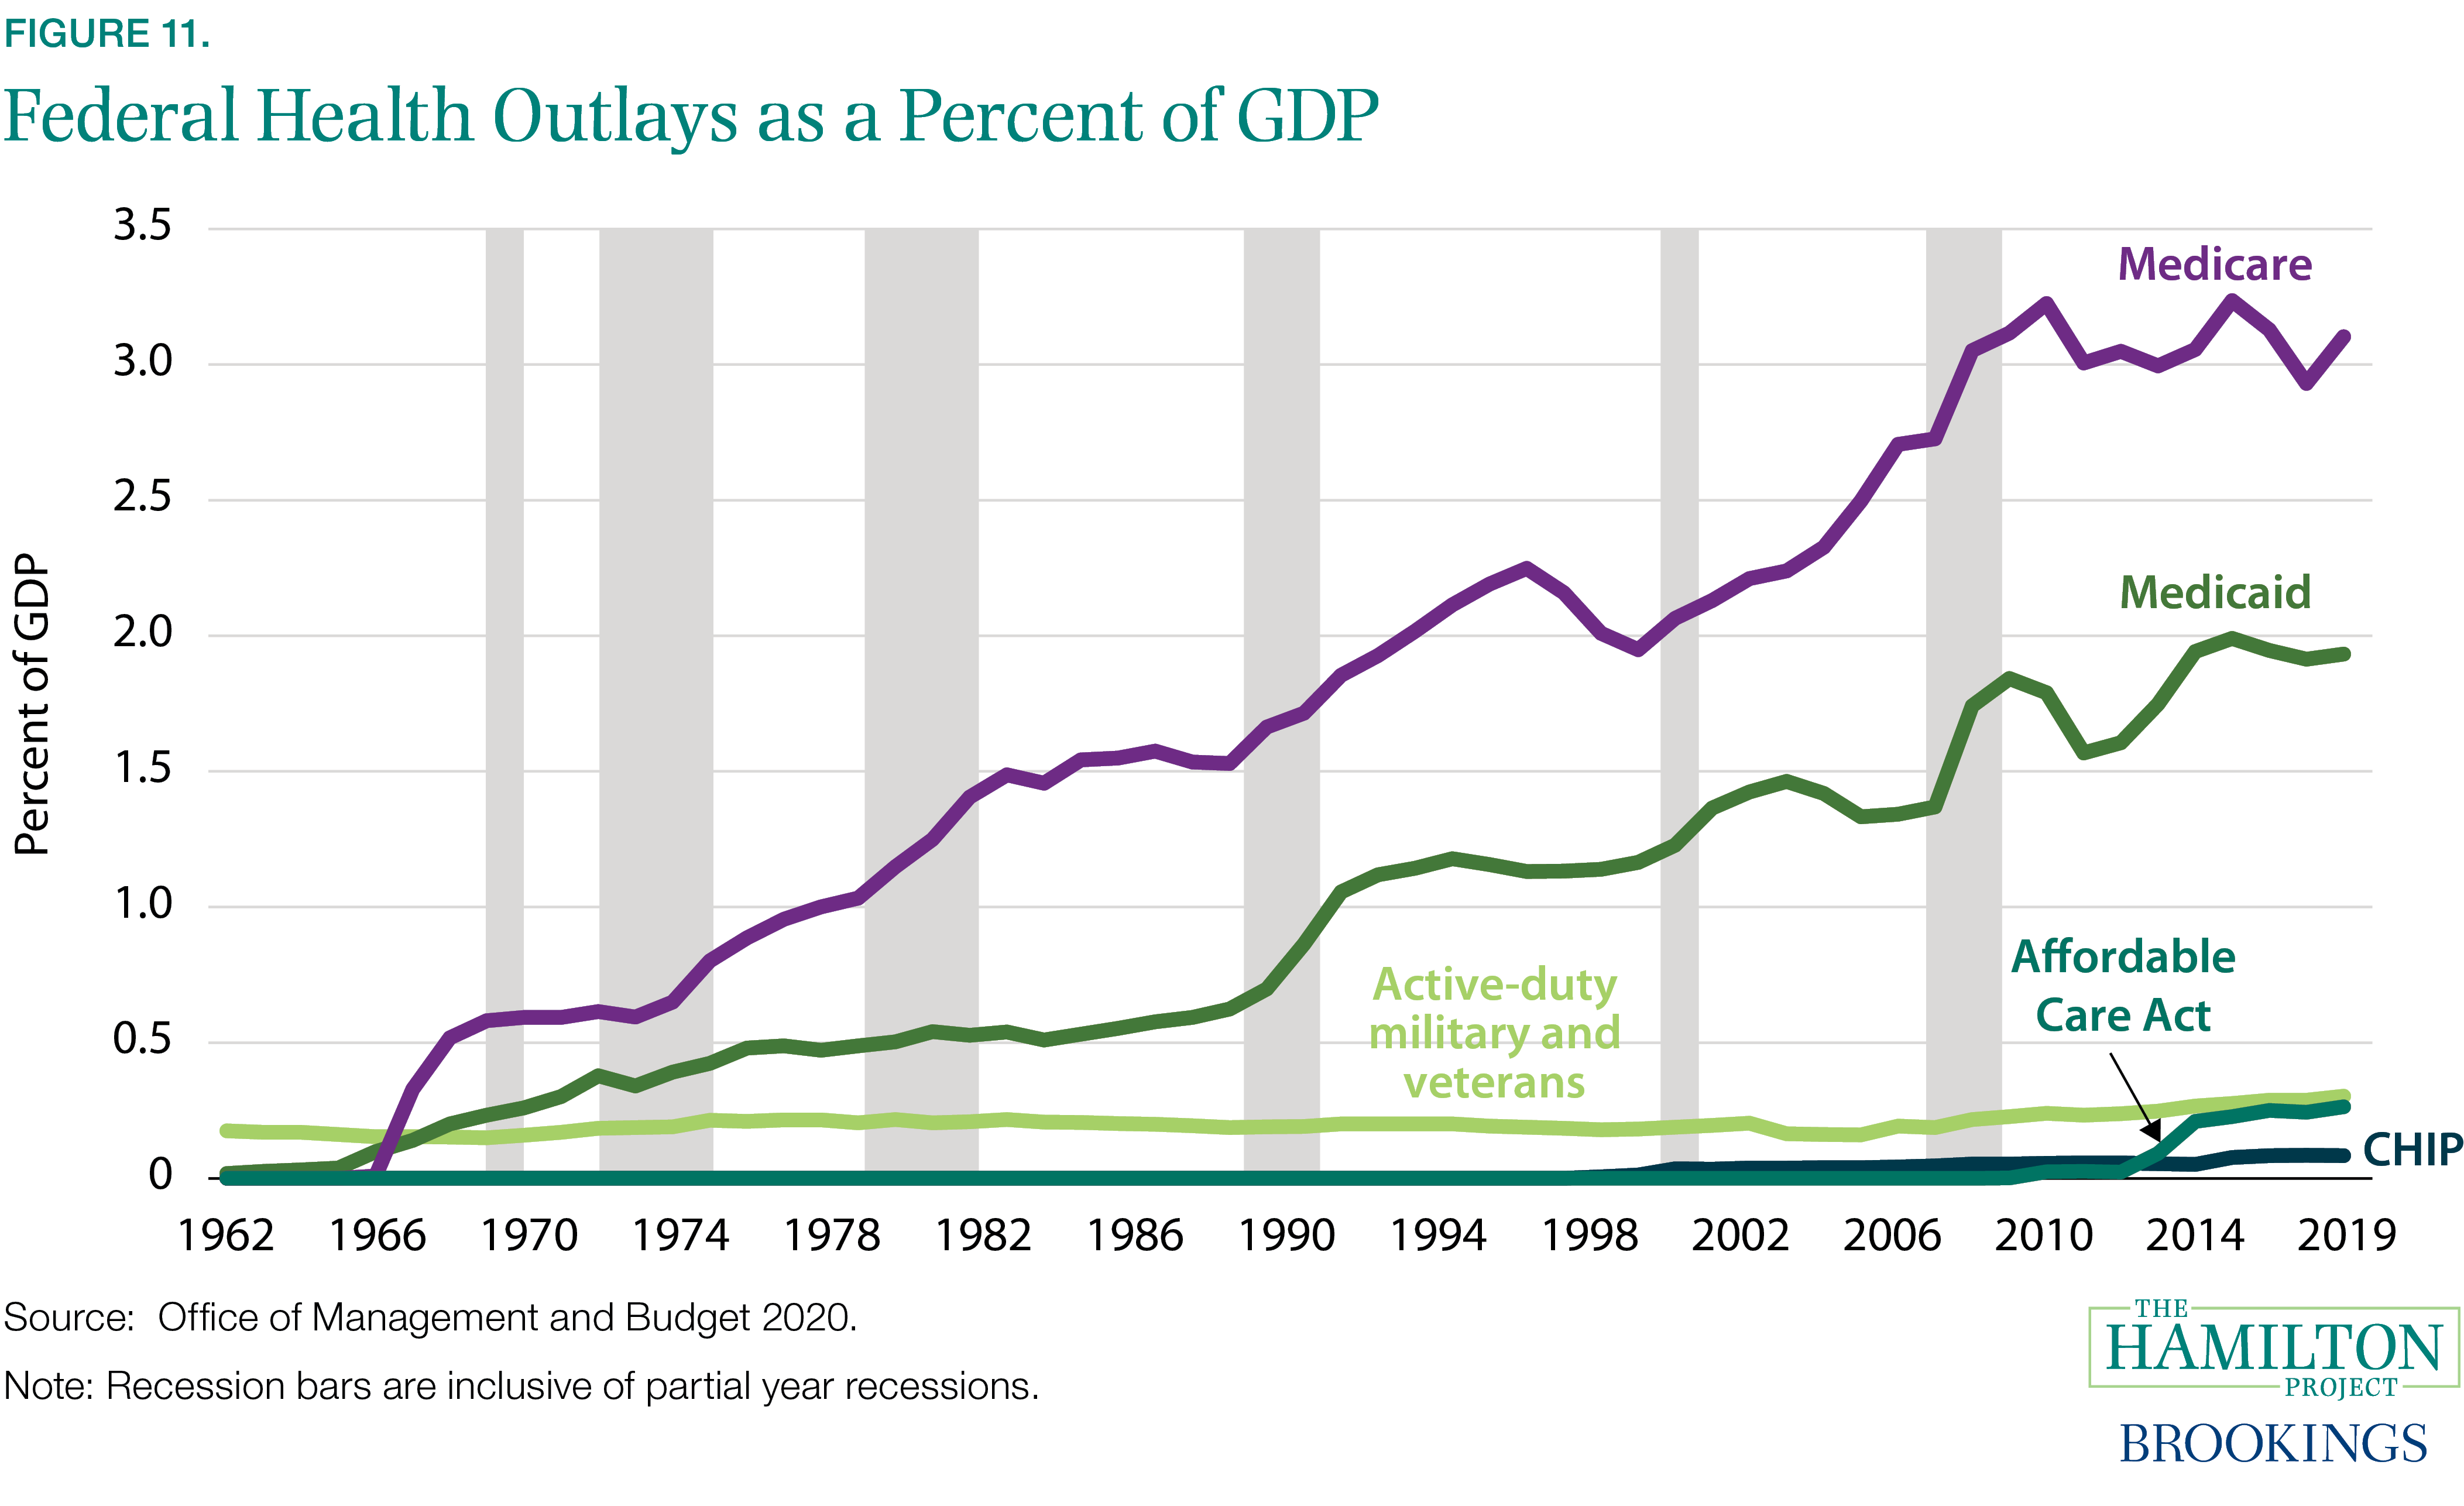
Figure 11 shows the yearly expenditures of the four main insurance programs as a percent of GDP. Since shortly after their creation in the 1960s, Medicare and Medicaid spending as a percent of GDP has been higher than spending on other health programs. Spending on Medicare and Medicaid expanded from less than half a percent of GDP in 1966 to 3 percent and 2 percent of GDP respectively in 2018. Other federally funded health insurance programs have not experienced comparable growth. As seen in the figure, active-duty military and veteran health insurance hovered around 0.2 percent for nearly four decades before rising to 0.4 percent. The Affordable Care Act and CHIP accounted for a combined 0.3 percent of GDP spending in 2018.
Job-dependent health coverage can create instability, as highlighted by the crisis created by the COVID-19 pandemic (Collins et al. 2020). Between 2019 and 2021, more than 1.2 million more individuals have obtained health insurance during the special and open enrollment periods through the marketplaces created by the Affordable Care Act. Between March and August, 2020, 5 million other people newly enrolled in Medicaid and CHIP, many after losing their jobs and employer-sponsored health insurance. Prior to the pandemic, a substantial majority of the states had adopted the Affordable Care Act’s Medicaid expansion, making poor adults younger than age 65 whose current incomes are below 138 percent of the poverty line eligible for Medicaid, which almost certainly helped significant numbers of residents of those states remain insured during the crisis.
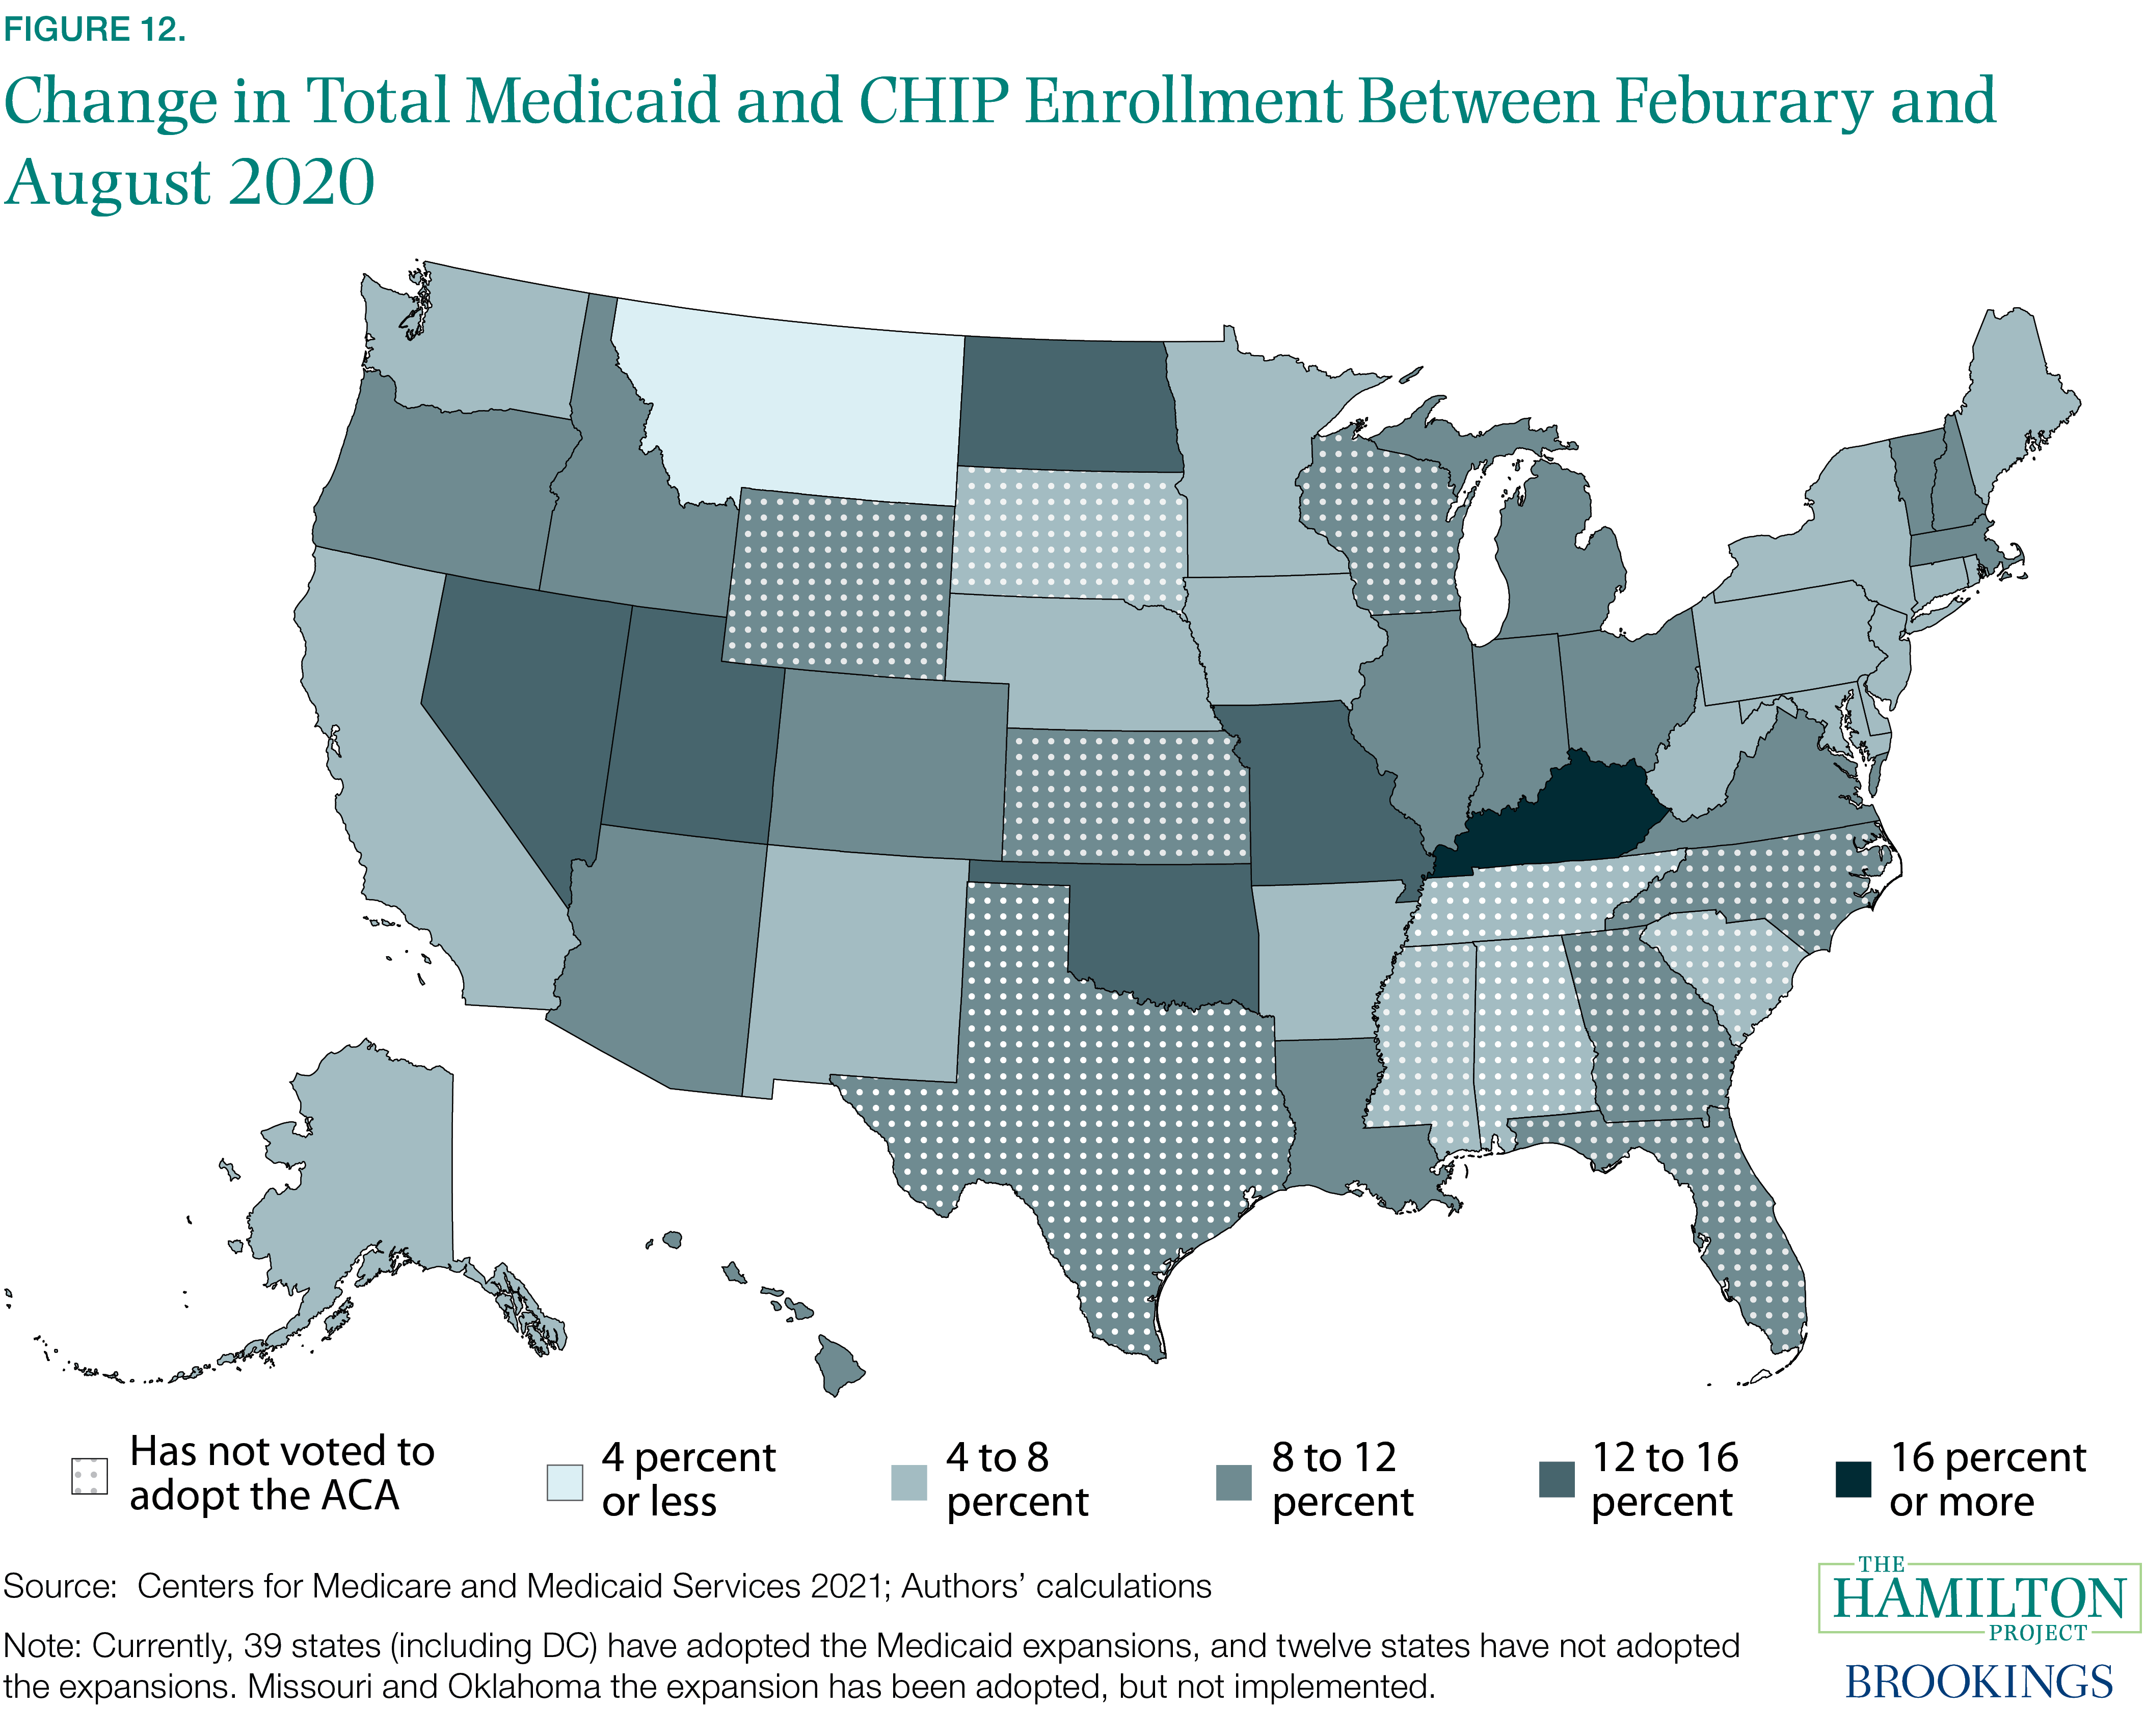
Figure 12 shows Medicaid and CHIP enrollment growth between February and August 2020. Interestingly, of the 13 states that have not implemented the ACA’s Medicaid expansion, four (Florida, Missouri , Utah, and Wyoming) saw increases in Medicaid and CHIP enrollment of over 10 percent in the 6 months following the onset of the pandemic.7
Of the 29.8 million individuals without insurance in 2019, two-thirds were eligible for subsidized health insurance: roughly 20 percent met requirements for Medicaid and CHIP, and roughly 50 percent were eligible for a marketplace subsidy or subsidized employer-sponsored health coverage. Employer-sponsored health coverage is subsidized for many individuals through employer contributions, as well as through arrangements that exclude from taxable income employee premium payments deducted from paychecks. Of the one-third of the uninsured in 2019 who were not eligible for subsidized health coverage of some sort, 5.9 million were ineligible either because their incomes were too high for marketplace subsidies or because their incomes were too low for those subsidies but they were ineligible for Medicaid because they lived in a state that has not adopted the Affordable Care Act’s Medicaid expansion (CBO 2020b).
Medicaid and the Children’s Health Insurance Program (CHIP)
Medicaid is the largest of the means-tested in-kind social insurance programs, offering comprehensive health coverage to beneficiaries, generally with no premiums (at least for people below the poverty line) and with low copayments and cost-sharing. As a federal-state partnership, Medicaid provides health services and covers health-care costs to improve health among eligible low-income families with children, pregnant women, and people who are 65 or over or have disabilities, including Medicare beneficiaries with low incomes. Through the Federal Matching Assistance Percentage (FMAP), the federal government picks up 50 to 83 percent of a state’s Medicaid costs. At times during economic downturns, Congress has temporarily increased the percentage of Medicaid costs the federal government covers in order to deliver fiscal support to states as their Medicaid caseloads rise. States may also opt to expand coverage to low-income adults younger than age 65 with incomes up to 138 percent of poverty, and all but 13 states have implemented this expansion, with the federal government paying 90 percent of the cost on an ongoing basis. In 2020, the Urban Institute found that the lack of implementation in the 14 states that had not yet implemented it (including Oklahoma, which is implementing the expansion on July 1, 2020) resulted in an estimated 4.4 million more low-income individuals being uninsured.
In 2020 about 68 million individuals were covered by Medicaid in an average month. Most of the increase in Medicaid take-up resulting from expansions in coverage by states came from the uninsured population rather than from people substituting Medicaid for private insurance (Finkelstein et al. 2012 ). Conversely, past roll-backs to Medicaid eligibility in some states have resulted in increases in the ranks of the uninsured without significant increases in private health insurance enrollment, regardless of employment (Garthwaite, Gross, and Notowidigdo 2014).
Medicaid saves lives (Goodman-Bacon 2018; Miller, Johnson, and Wherry forthcoming) and improves the quality of life (Miller and Wherry 2019). Medicaid also increases annual health-care use among children and adults (Currie, Decker, and Lin 2008; Currie and Gruber 1996; Card and Shore-Sheppard 2002), as well as hospitalizations (Dafny and Gruber 2005), while reducing avoidable hospitalizations (Aizer 2006 ). Studies of the Oregon Health Insurance Experiment found greater use of health care as a result of Medicaid coverage, as well as a higher likelihood of filling a prescription and better self-reported health (Baicker et al. 2013; Finkelstein et al. 2012; Taubman et al. 2014). Medicaid also insures families against certain health-related economic outcomes by reducing medical debt (Boudreaux, Golberstein, and McAlpine 2016; Finkelstein et al. 2012) and decreasing the likelihood of declaring bankruptcy (Gross and Notowidigdo 2011).
For families with modest incomes and with children who do not have private health insurance and do not qualify for Medicaid, there is CHIP. CHIP, which is administered by the states and funded jointly by the federal and state governments, provides health coverage for children in families who cannot afford private insurance but whose incomes exceed the Medicaid income eligibility limits. States can operate CHIP as a separate program or as a component of Medicaid.
CHIP has significantly increased health insurance coverage for children (Gruber and Simon 2008), including among the children of immigrants (Bronchetti 2014). States have some flexibility to set the terms of the program, such as charging premiums, which can result in lower take-up and a shorter duration of enrollment (Dague 2014). CHIP improves children’s health (Bronchetti 2014) and educational outcomes such as test scores (Levine and Schanzenbach 2009), as well as high school and college completion (Cohodes et al. 2016). In adulthood, enrollment is associated with better labor market outcomes, including higher labor force participation rates and earnings (Brown, Kowalski, and Lurie 2015).
Medicare
Medicare serves people who have a sufficient earnings record to qualify and are at least age 65 or who have serious disabilities. Individuals generally qualify either at age 65 or two years after the month for which they first receive federal disability benefits, although there are some exceptions to this rule. Medicare has several components. Medicare Part A provides insurance for inpatient hospital costs and does not charge a premium. Medicare Part B covers physician, laboratory, and outpatient hospital costs and charges a basic monthly premium that is subsidized for low-income enrollees who apply for that assistance; the premium is raised substantially for higher-income enrollees. Medicare Part D, which also charges a premium, provides prescription drug coverage. With respect to Part B, the majority of beneficiaries are enrolled in traditional, fee-for-service Medicare, in which the federal government operates the insurance program. But nearly 40 percent of enrollees now enroll in private Medicare Advantage plans, which operate under federal standards and generally offer combined Part B and Part D coverage.
Medicare increases health-care use and reduces mortality (Card, Dobkin, and Maestas 2009) including from cancer (Myerson et al. 2020). Like Medicaid, Medicare reduces out-of-pocket spending on health care (Finkelstein and McKnight 2008) and insures against health-related financial risks including medical debt (Barcellos and Jacobson 2015; Caswell and Goddeeris 2020; Goldsmith-Pinkham, Pinkovskiy, and Wallace 2020). Medicare Part D (prescription drug coverage) reduces the price that participants pay for prescriptions and increases use (Duggan and Scott Morton 2010, 2011). Medicare Part D reduces mortality (Dunn and Shapiro 2019; Huh and Reif 2017) and improves mental health (Ayyagari and Shane 2015). The growth of Medicare accounts for a substantial portion of the increase in federal spending on health care since the program’s introduction (Finkelstein 2007).
Military
The VA provides public health insurance for those who have served in the active-duty military, their immediate families, and their survivors. In 2019 more than 9 million enrollees received health insurance through this system. VA health benefits are available to qualified veterans regardless of whether they have other health-care insurance. For example, the benefits can supplement Medicare for people age 65 and over. Veterans pay no premiums for this health care, although they pay copayments in certain circumstances. Researchers have generally found that the VA health-care system provides higher-quality care than the private sector.
Premium Subsidies
Despite the different programs aimed at increasing the availability of health coverage in the United States, millions of Americans are still uninsured. For those who are not eligible for public health insurance and who do not have access to affordable employer-based coverage, the Affordable Care Act established premium tax credits that people with incomes between 100 percent and 400 percent of the poverty line can use to subsidize the purchase of health insurance in the Affordable Care Act’s marketplaces, along with a series or rules to ensure the marketplaces function effectively. A second set of subsidies, to reduce cost-sharing charges, is available to people enrolled in marketplace plans who have incomes between 100 and 250 percent of the poverty line. The tax credits generally are not paid directly to beneficiaries; rather, the US Department of the Treasury sends them directly to the insurance company in whose plan a beneficiary is enrolled. The ARP both increases the size of the subsidies and eliminates the 400 percent of poverty eligibility cut-off for 2021 and 2022. Debate is underway over whether to make those changes permanent. A report from the CBO suggests the high cost of health insurance premiums and deductibles and the complexities for enrolling for coverage create obstacles for some of the eligible to receive coverage. (CBO 2020b).
Family and Medical Leave
The Family and Medical Leave Act of 1993 (FMLA) allows eligible employees to take up to 12 work weeks of unpaid leave during any 12-month period for caregiving or illness recovery purposes. Employers and employees must meet several criteria for employees to use the FMLA for leave. The firm must be relatively large (at least 50 employees within a 50-mile radius, though in eight jurisdictions the threshold is lower); the employee must have worked for the employer for at least 12 months; and the employee must have worked at least 1,250 hours in the past 12 months. Additionally, the FMLA applies only to immediate family members in all but 11 jurisdictions.
The United States does not have a national paid leave program. Some states and localities have passed laws requiring employers to give eligible employees paid leave. As of early 2021, however, paid family leave—leave that can be used for post-birth/adoption care and caregiving for sick family members—is available in only six states. Two others have passed legislation and are in the process of implementing it. Funding mechanisms differ by state and are typically financed by a small payroll tax on wages; wage replacement rates and weeks available of paid leave vary by state. In the absence of state or local laws, paid leave is up to the employer.
FMLA reduces worker turnover (Appelbaum and Milkman 2011) and enhances children’s health (Rossin 2011; Ruhm 2000). Economic benefits of FMLA for workers and employers include increased labor-force participation, increased lifetime earnings and retirement benefits, and increased use of leave (Boushey, O’Leary, and Mitukiewicz 2013). Research from states with paid leave programs find higher rates of maternal leave take-up and increased job return post-leave (Baum and Ruhun 2013; Byker 2016; Rossin-Slater, Ruhm, and Waldfogel 2011). The positive effects of leave are strongest among disadvantaged mothers (Byker 2016; Rossin-Slater 2013). However, some evidence shows negative wage effects from paid parental leave for women so the potential for paid leave policies to close the gender pay gap remain unclear (Bailey et al. 2019).
THP Proposals: Health
Some proposals to reform Medicare, including one developed for The Hamilton Project, would move away from today’s fee-for-service model, offering instead a new model of global payment in which health plans and provider systems are paid a fixed budget to cover all beneficiary spending. In this model, the regulatory regime should strive for a level playing field between payments going to health plans (under Medicare Advantage) and payments going to provider systems (under Accountable Care Organization models). Many existing regulations within Medicare prevent the overuse of care, including the prohibition of self-referral and various caps on usage. The THP proposal would eliminate these restrictions, allowing for more-expansive coverage that prioritizes health outcomes rather than cost minimization. (To learn more, read the THP proposal by Michael Chernew and Dana Goldman [2013].)
Other changes to Medicare would introduce income-related payment limits on out-of-pocket costs, with the limits rising as income increases. To further strengthen the demand-side incentives of Medicare, a new tax could be placed on the purchase of supplemental insurance, which would encourage less medical spending by Medicare enrollees. (To learn more, read the THP proposal by Jonathan Gruber [2013].)
Medicaid and CHIP can be improved by structuring federal rules so that the federal share of Medicaid costs rises automatically during economic downturns to facilitate temporary increases in enrollment and ease contractionary pressure on state and local governments. Under another THP proposal, a state would become eligible for relief for any quarter in which its unemployment rate exceeds a level set at the 25th percentile of the distribution of the state’s unemployment rates over the preceding 15 years plus 1 percentage point, ensuring assistance is targeted at serious downturns and not triggered by small fluctuations. A qualifying state’s base federal Medicaid matching rate would increase by 3.8 percentage points for each percentage point by which the state’s unemployment rate exceeds this threshold. States that have expanded Medicaid under the Affordable Care Act would receive an additional 1 percentage point increase. (To learn more, read the THP proposal by Matthew Fiedler, Jason Furman, and Wilson Powell III [2019].)
On another front, a THP proposal that would expand access to paid leave would extend multipurpose sick leave to support workers with caregiving responsibilities. For every 30 hours of work, an employee would be guaranteed one hour of flexible, multipurpose leave (capped at 40 hours per year), with any unused leave carried forward to the next year. This THP proposal, by Nicole Maestas (2017), would give states discretion on the type of structure to implement, allowing for either employer provision or the creation of a new statewide sick pay fund into which payroll taxes would go. Another THP proposal for paid parental leave, offered by Christopher Ruhm (2017), envisions a program treated as an entitlement and able to draw on the federal government’s general revenues. This structure would separate workers’ access to leave from their employer’s hiring decisions, avoiding the potential for a payroll tax to discourage employment and to burden low-wage workers. Still another THP proposal to establish a federal paid leave system would combine family and medical leave policies together, ensuring that all workers regardless of life stage could receive some expected benefit. In this THP proposal, by Tanya Byker and Elena Patel (2021), paid leave would be offered to all workers, and minimal work and earnings requirements would allow flexibility to accommodate work histories common among part-time, lower-income and other workers in certain industries. The program structure would provide up to 16 weeks of partially paid parental leave and 12 weeks of family medical leave and would be designed to be flexible and gender-neutral to accommodate various household structures.
3. Income Support Programs
Income support programs bolster income through transfers, refundable credits, and tax reductions for people in retirement, people with particular family circumstances, people with relatively low income, or a combination of these characteristics. These programs include Social Security, unemployment compensation, CTC, EITC, SSI, and TANF. Federal expenditures for income support programs totaled more than $1.2 trillion in 2019, equal to 5.8 percent of GDP and nearly 28 percent of the total federal budget. As figure 13 highlights, Social Security payments are by far the largest of these programs, with benefits totaling nearly 4.9 percent of GDP (or $1.0 trillion). UI, which expands in recessions to provide countercyclical support, peaked in 2010 at 1.1 percent of GDP (or $160 billion), before receding in the pre-pandemic period (and growing dramatically during the pandemic and related economic downturn). Federal spending on TANF as a share of GDP has fallen in the period since it replaced Aid to Families with Dependent Children (AFDC) in 1996, with federal TANF spending down to 0.1 percent of GDP in 2019, considerably below the level in 1972 when AFDC made up 0.5 percent of GDP. The refundable portion of EITC and CTC payments are a larger share of GDP than before 2010.
Child Tax Credit (CTC)
The CTC is a partially refundable tax credit that provides financial resources to qualifying families with minor children. It extends far up the income scale: with changes made by the 2017 tax act, married filers with incomes up to $400,000 can receive the full credit and married filers with two children and incomes between $400,000 and $480,000 can receive a partial credit. In fact, prior to changes made by the ARP (and after those changes, which are currently scheduled to be in effect for only one year, expire), the CTC was more valuable to higher-income families than to lower-income families. That is a consequence of families with no or very low earnings not qualifying, the size of the credit phasing in slowly for working-poor families as their earnings rise, and the imposition of a limit on the size of the credit for filers who do not earn enough to have federal income-tax liability. Indeed, in 2020 about 27 million low- or modest-income children received either no credit or only a partial credit.
The ARP raised the full credit per child, from $2,000 per child under age 17, to $3,600 for children under age 6 and $3,000 for children age 6–17; at the same time, it made the full amount available to households with no or low earnings. It also made 17-year-old children eligible for the first time and changed the distribution of the tax credit to periodic rather than annual (unless a filer opts to receive the credit annually). Those changes, set to expire after 2021, along with the other measures in the ARP, are projected to reduce poverty among children in 2021 from 14 percent to 8 percent (CPSP 2021).
Earned Income Tax Credit (EITC)
The EITC is a refundable tax credit available to income-eligible households that work, which means that the IRS sends eligible claimants a refund check each year after they file their tax returns. The EITC phases in as a family’s earnings rise up to a certain income level and then gradually phases down above a somewhat higher income level. The amount of the credit increases with the number of children in a family (up to three). The credit is also somewhat larger for married filers in certain income ranges than for unmarried filers in order to lessen marriage penalties.
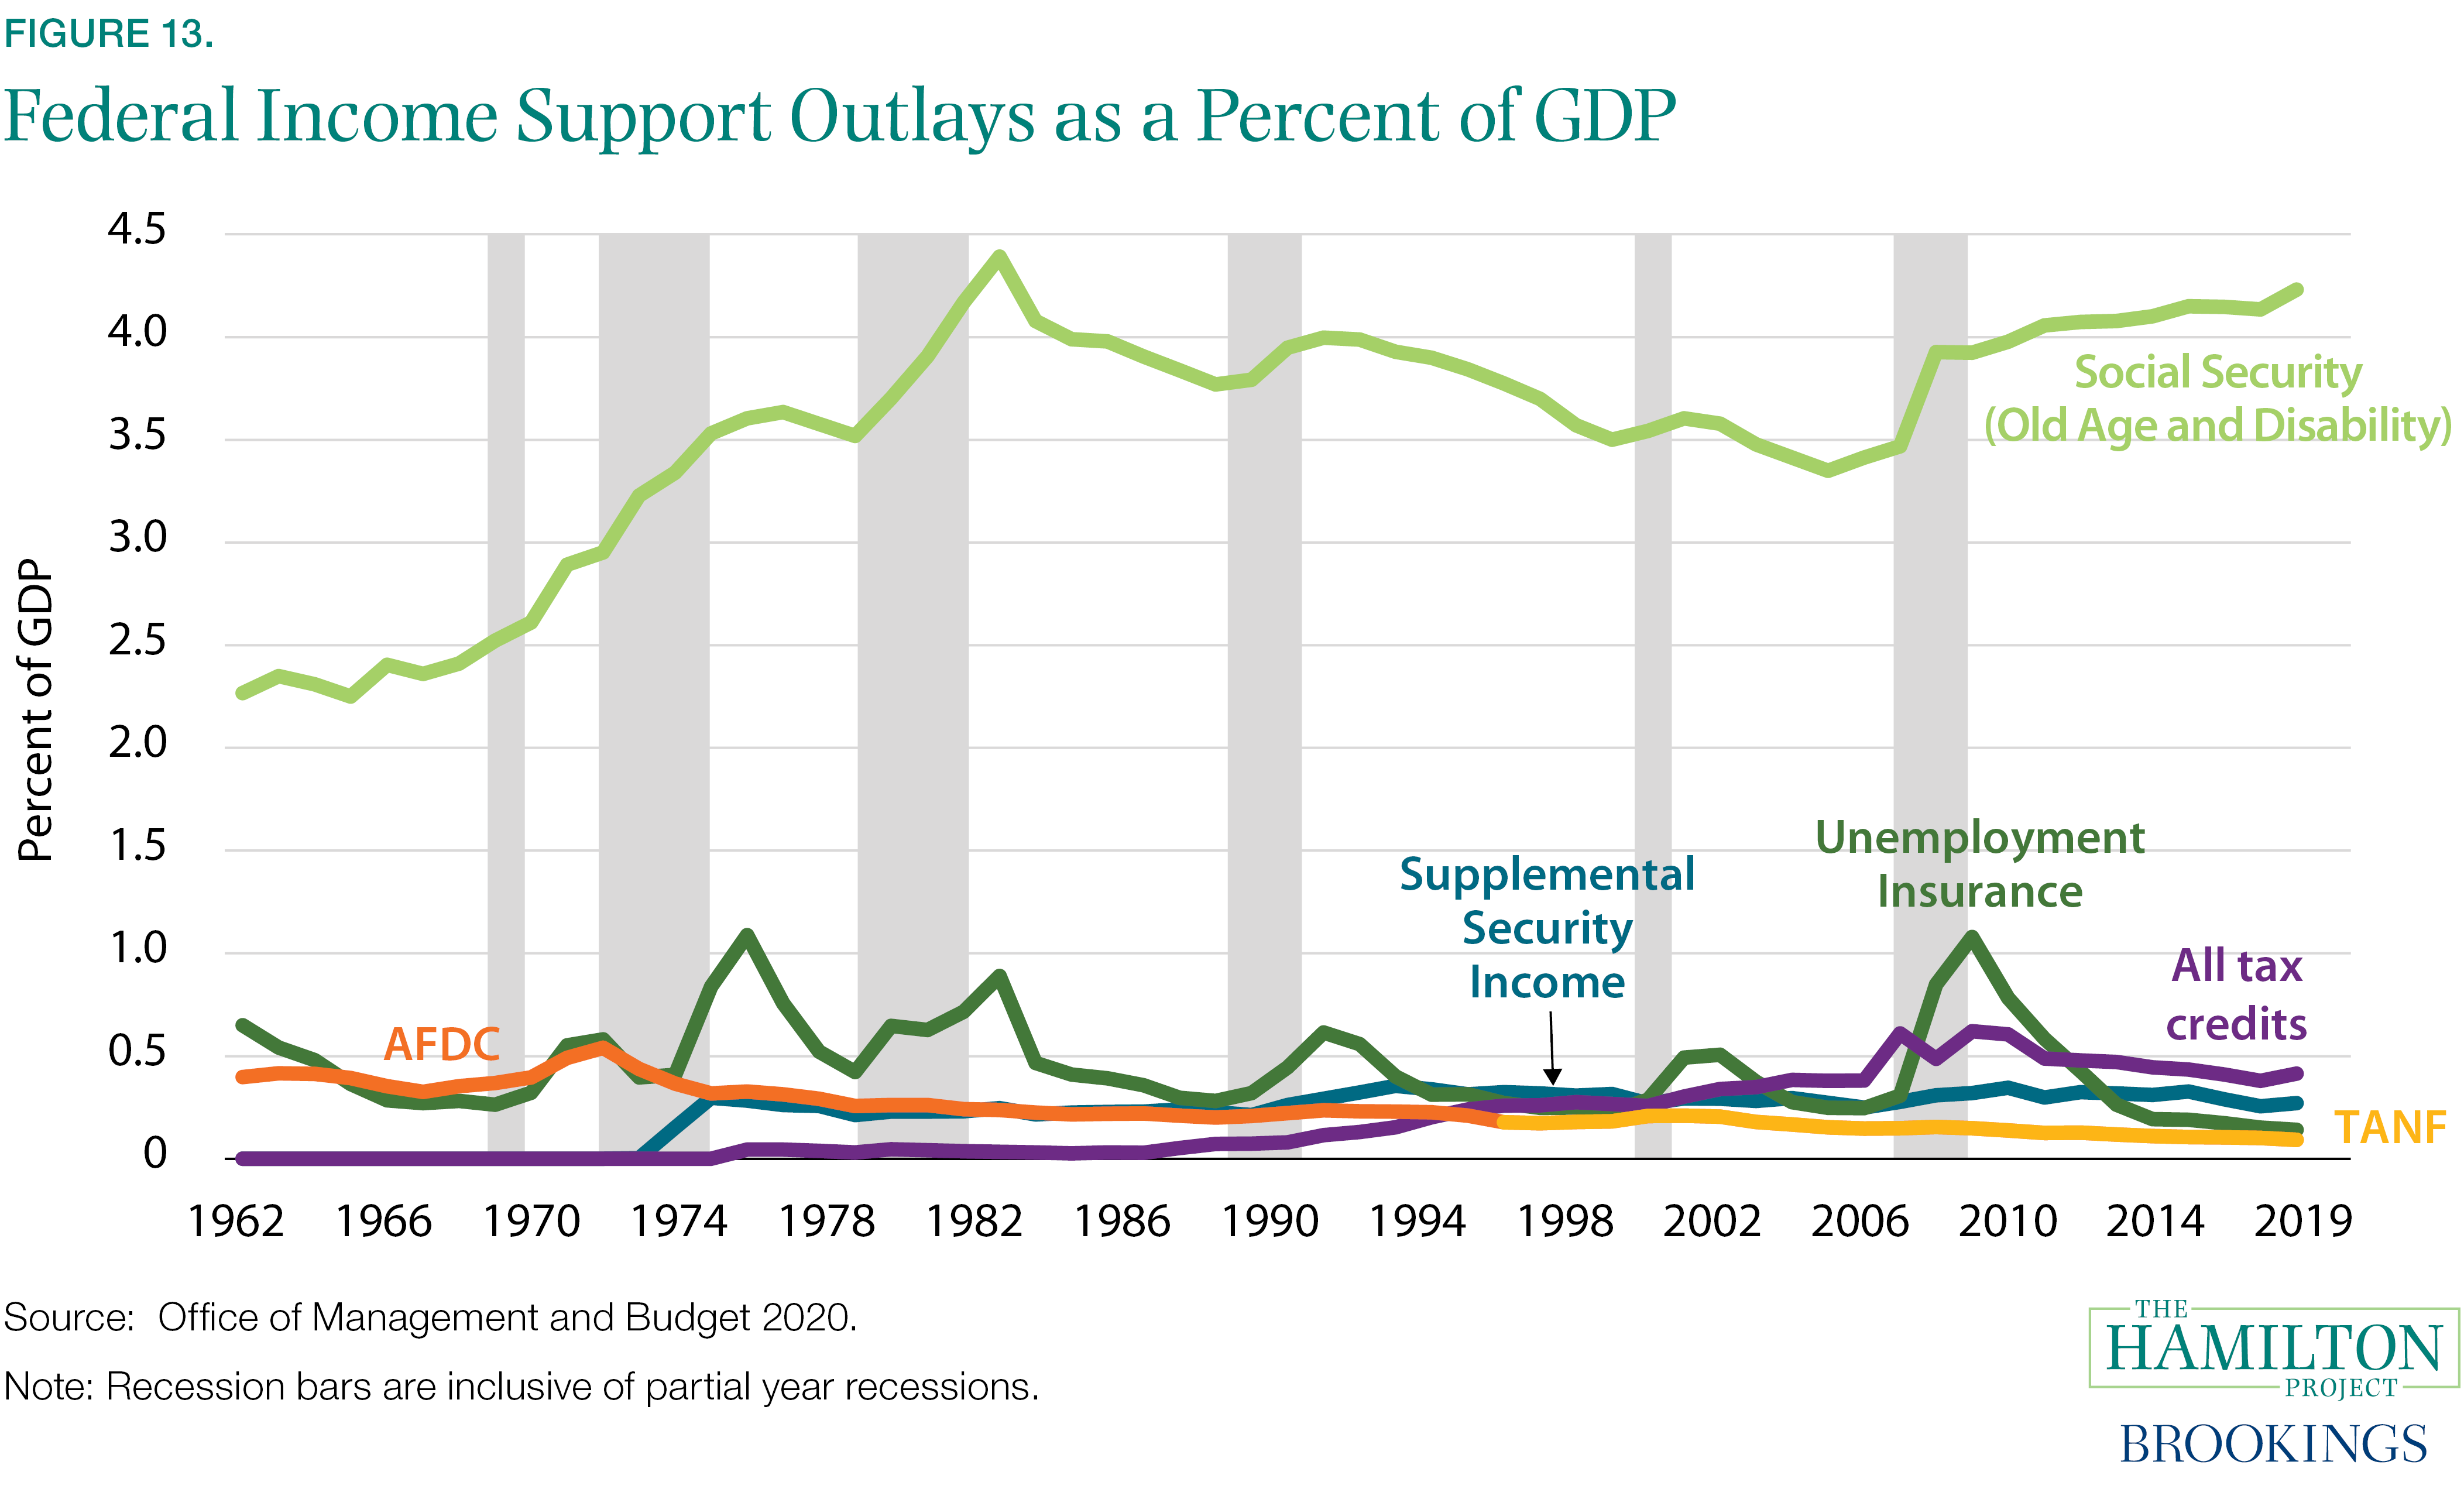
In 2020 a married filer with two children could receive a maximum EITC of $5,920 (most families receive less), and the EITC phased out entirely for such families when their earnings reached $53,330. The component of the EITC for workers not raising children at home is much smaller; in 2020, its maximum benefit was $538; workers who are not married (most beneficiaries of the childless EITC are single) became ineligible at incomes of only $15,820. For tax year 2021, the ARP nearly triples the maximum benefit for the childless workers’ EITC to about $1,500, raises to $21,427 the income at which the credit phases out entirely for single workers, and makes workers 65 and over and workers who are 19 to 24 years old eligible for the childless workers’ EITC for the first time, excluding students under 24 who are in college at least half time. (In addition, 29 states and the District of Columbia have state EITCs that supplement the federal credit; most state EITCs are a specified percentage of the federal EITC.)
Across the country, participation in EITC is high (see figure 14). Generally speaking, those who are eligible for the credit but who do not claim it are more commonly in the western part of the United States. The majority of eligible non-claimants are people who are not required to file a federal tax return and do not do so (Tax Policy Center n.d.). Other characteristics of those who are eligible but who do not apply, which relate to differences across states, include living in rural areas; experiencing a change in income, marital, or parental status; and receiving disability benefits (IRS n.d.). Also of note, audits are more common among those who claim the tax credit than among other filers (though only a very small share of EITC filers are subject to audits), and audits are associated with reduced future filing for the EITC (CBO 2020c; Guyton et al. 2018).
While the point estimates vary, studies find that EITC raises labor force participation and annual income among lower income families (Eissa and Liebman 1996; Meyer and Rosenbaum 2001; Hoynes and Patel 2018; Bastian 2020; Schanzenbach and Strain 2020; see Hoynes and Rothstein 2016 for a review of the literature). Indeed, the EITC has a stronger effect in increasing labor force participation than it does in increasing the number of hours worked among those already employed (Saez 2010). Scholars have found that EITC improves many aspects of well-being, including economic (Baughman and Dickert-Conline 2009; Neumark, Asquith, and Bass 2019), health (Hoynes, Miller, and Simon 2015; Braga, Zblavin, and Gangopadhyaya 2020), and human capital (Chetty, Friedman, and Rockoff 2011; Bastian and Michelmore 2018).
Social Security
The Social Security Administration (SSA) administers Social Security, which consists of retirement, survivors, and disability social insurance programs that provide monthly cash benefits to aged or disabled workers, their spouses and children, and survivors of insured workers. Collectively known as Old-Age, Survivors, and Disability Insurance (OASDI), these cash benefits are a crucial income source for many Americans. In 2020 approximately 180 million workers were covered by the Social Security program (SSA 2021). The program sends either monthly checks or direct deposits to its beneficiaries, who numbered 64 million in a typical month of 2020 (CBPP 2020).

To qualify for OASDI benefits, individuals must have worked and paid into the system for at least a specified number of years (or have been married to a qualifying worker for at least a specified number of years or be a child of such a worker). The near-universality of OASDI access for large populations means that administrative costs are very low relative to private retirement annuity maintenance (CBPP 2020).
Retirement
Social Security is the largest federal program in terms of cost and enrollment. Individuals can elect to begin receiving old-age benefits at age 62, but they receive higher monthly benefits for the rest of their lives for each year (until age 70) they wait to begin receiving benefits. A portion of Social Security benefits is taxable for beneficiaries whose current incomes are above certain levels.
As shown in figure 15, the Social Security system is a progressive program that gives larger benefits relative to average lifetime earnings to those who earned low wages (Catherine, Miller, and Sarin 2020). The ratio of average lifetime benefits to prior earnings is referred to as a replacement rate. As shown in figure 15, on average, replacement rates for women are higher than for men because women have both lower average lifetime earnings and longer life expectancies (and hence draw benefits for more years). However, women’s benefits are about 20 percent lower on average than men’s benefits.
Social Security benefits are a critical source of income for older adults. Indeed, without Social Security, more than one in three older adults would live in poverty (Romig 2020). According to the SSA, half of the work force has no private pension coverage, and nearly one in three has no retirement savings (SSA 2021). For about a quarter of older adults, Social Security provides more than 90 percent of their family income (Dushi, Iams, and Trenkamp 2017). It is worth noting that in absence of the Social Security benefits and related payroll taxes to finance it, many households would increase their private saving (Scholz, Seshadri, and Khitatrakun 2006).
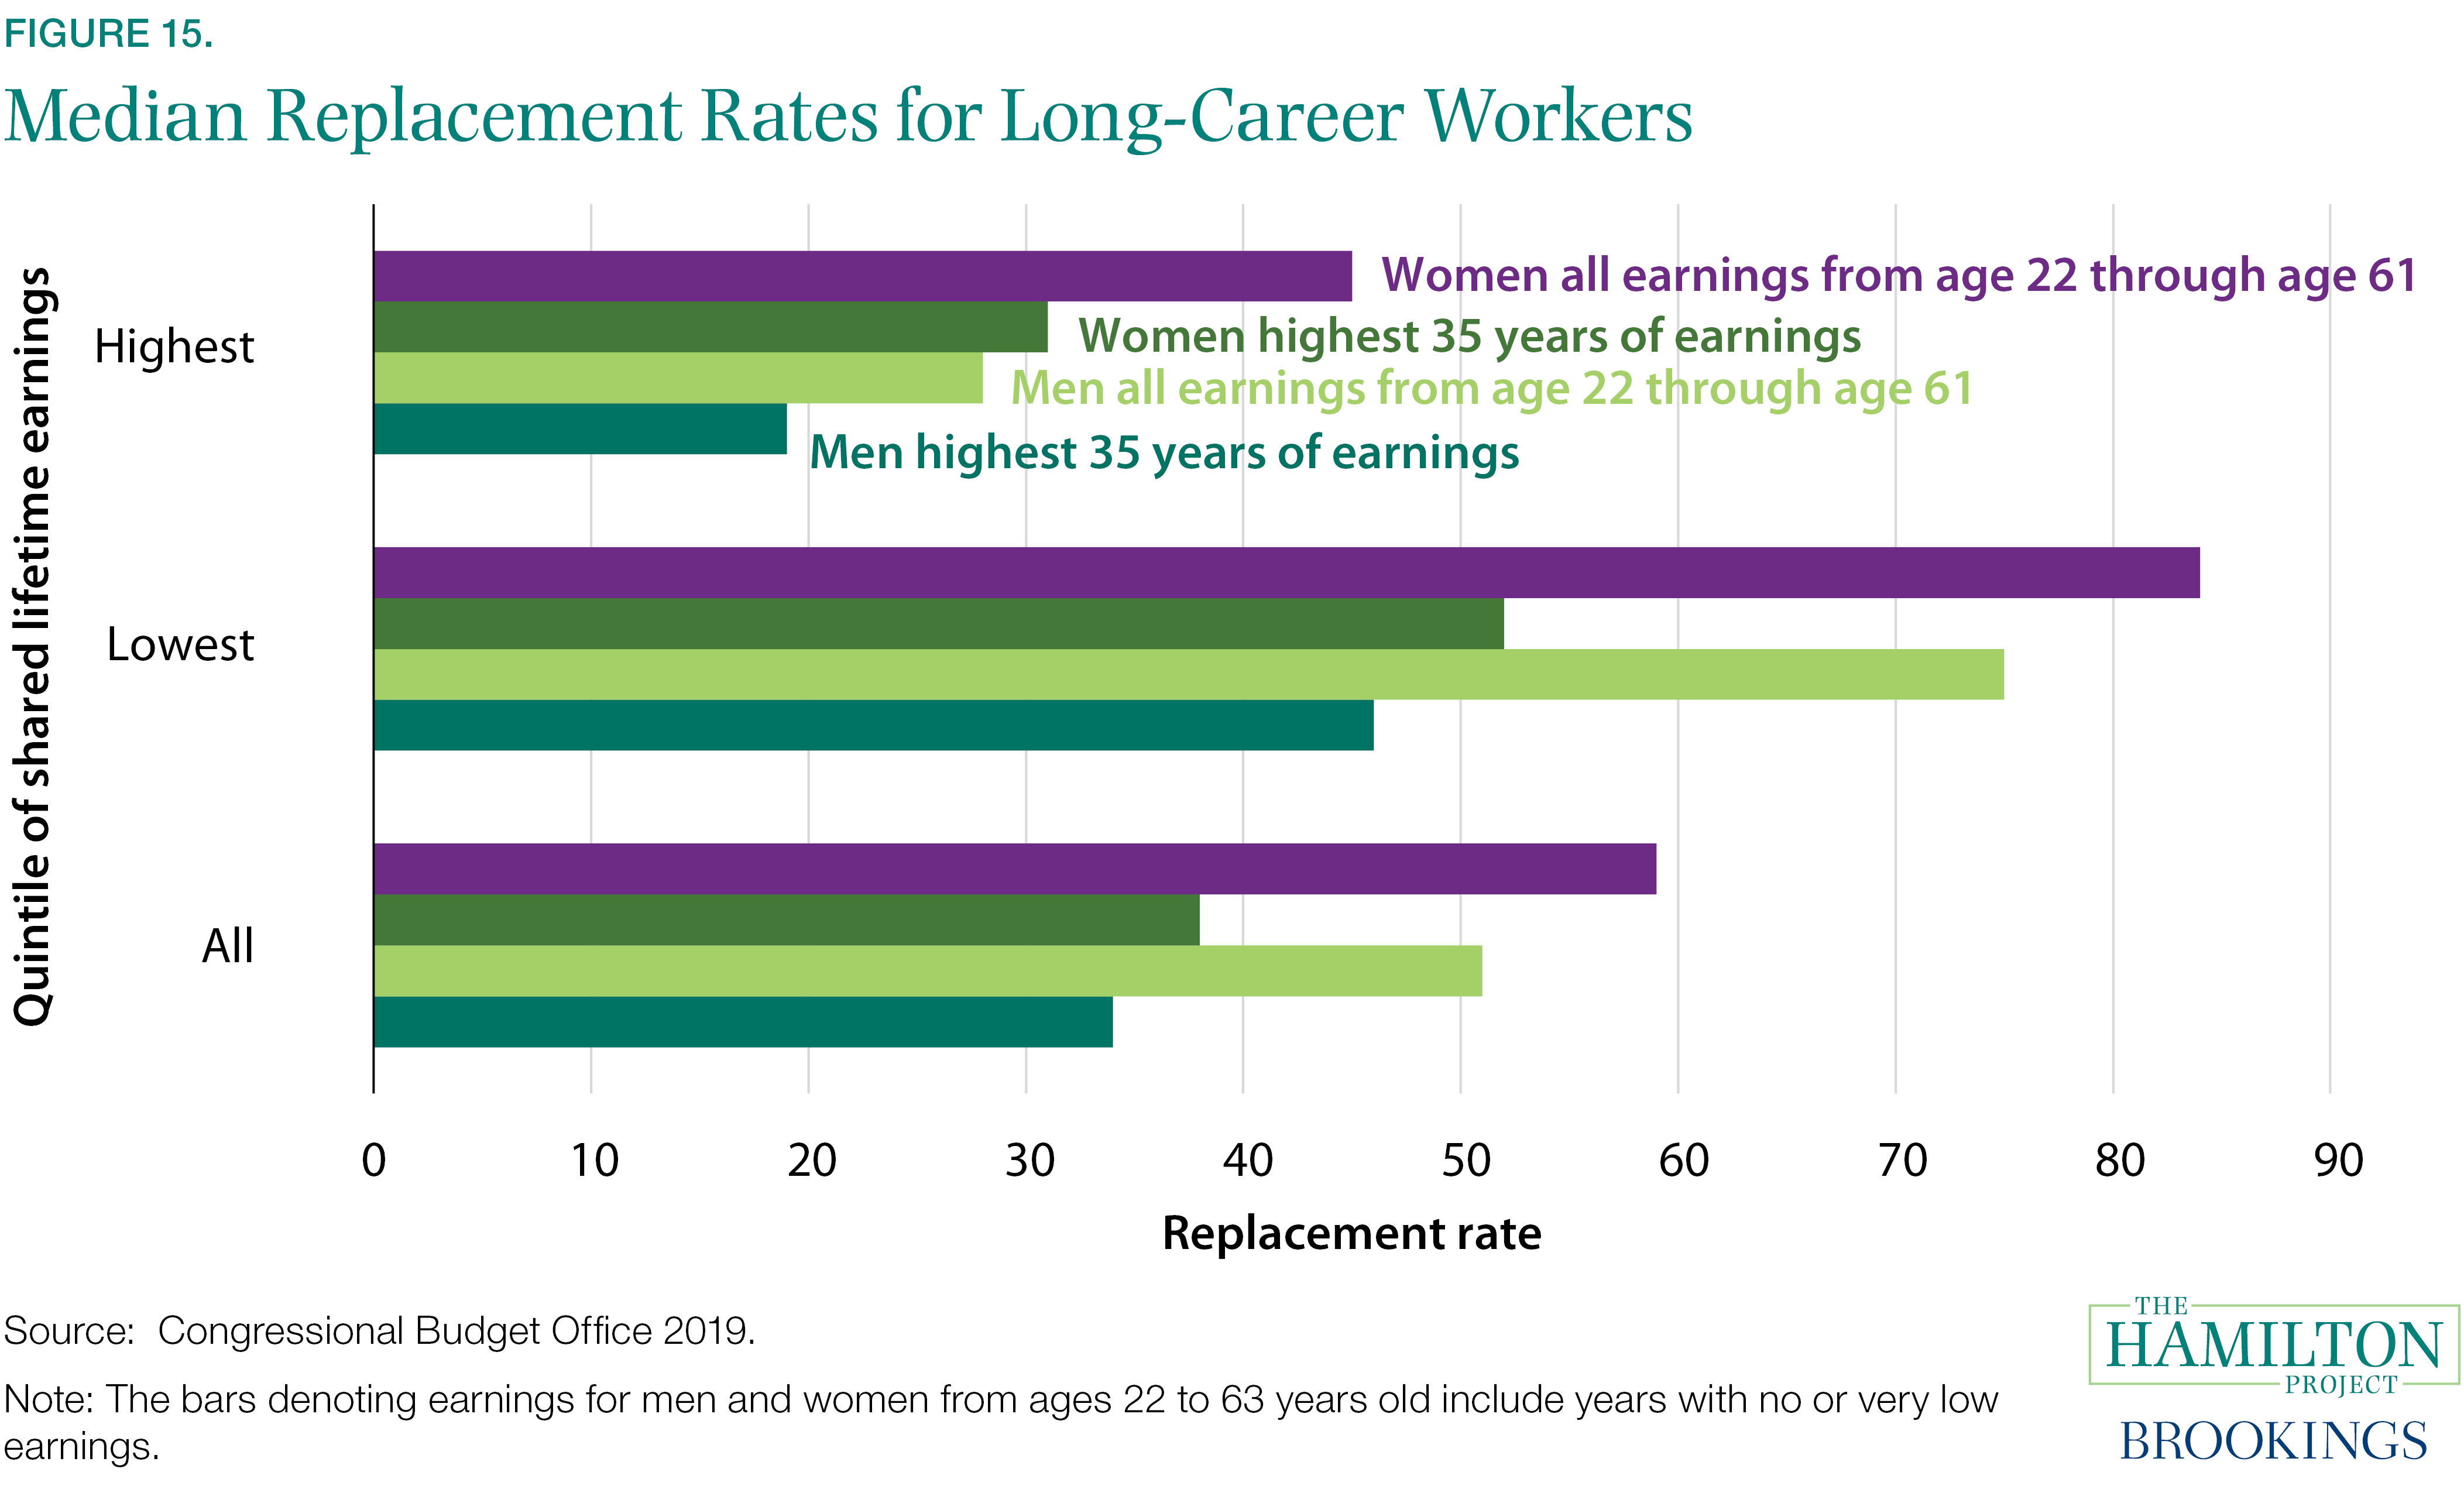
Social Security Disability Insurance (SSDI)
SSDI is another component of OASDI, and it provides cash payments to people who have worked for some time in the past but become restricted from working by a disability. People of any income or resource level can receive SSDI as long as they are under the age of 65, their disability is expected to last at least 12 months or result in death, and they have worked at least a specified number of years, with the exact number of years dependent on the age at which they became disabled. In 2019 people received in aggregate about $125 billion in SSDI benefits. In June 2020, 8.3 million workers received SSDI benefits (CBPP 2020). During economic downturns, SSDI rolls increase somewhat because people with disabilities have a more difficult time finding employment that accommodates their disabilities and more of them enroll in the program. (Autor and Duggan 2003; Kearney, Price, and Wilson 2021; Maestas, Mullen, and Strand 2015). Similarly, because SSDI improves the financial alternative to working with a disability, these benefits decrease labor force participation although the effects are relatively small (Abraham and Kearney 2020).
Supplemental Security Income (SSI)
SSI is a program separate from OASDI (though it applies the same disability test as SSDI) that provides monthly payments to those who are blind or who have a demonstrated disability at any age, as well as to very low-income individuals who are age 65 or older. It provides an income floor for those who have limited work history—usually because of a disability occurring too early in life to amass a significant work record or because they immigrated into the United States too late in life to amass such a record in this country. Like Social Security, SSI is a federal benefit administered through the SSA, which issues monthly payments. Some SSI beneficiaries also receive Social Security, but by law the combined benefit is only $20 a month above the low SSI benefit; most older people who worked for low wages throughout their careers receive Social Security benefits that place them over SSI’s income limits.
SSI also has a strict asset test; countable assets (which exclude things like a home, car, and household goods) cannot exceed $2,000 for an individual and $3,000 for a couple, levels that have not been adjusted for inflation since 1989. In 2021, the maximum monthly federal payment, for beneficiaries with little or no other income, is $794 for a single person and $1,191 for a couple, which is about three-quarters of the poverty line. (Some states provide modest state supplemental benefits.) Many disability advocacy groups argue that these benefit levels and eligibility thresholds are far too low and limit the ability of disabled people to establish any emergency savings (or even get married since the benefit for a couple is only three-fourths the benefit for two single individuals) (SSA 2003). SSI receipt typically brings with it eligibility for Medicaid.
Scholars have found that SSI improves household economic security (Duggan and Kearney 2007; Schmidt, Shore-Sheppard, and Watson 2016). Because households lose benefits at even modest earnings levels, SSI creates some labor supply disincentives (Wittenburg, Mann, and Thompkins 2013). For example, when children cease receiving SSI, parents increase their labor supply (Deshpande 2016a). Conversely, when young children receive SSI, parents decrease their labor supply. However, parents could be using that time to increase child investment (Guldi et al. 2018). By increasing household resources, some research shows that SSI improves children’s human capital development and adult earnings (Deshpande 2016b).
Temporary Assistance for Needy Families (TANF)
TANF is a capped block grant program that gives states a fixed sum of federal money each year. A primary purpose of TANF is supposed to be to provide modest, basic cash assistance to very poor families with children (and pregnant women). When it was established in 1996, 70 percent of the spending went toward such assistance. Today, however, less than a quarter of the funds go toward basic assistance (Safawi and Schott 2021). States use TANF funds for a wide variety of programming beyond direct assistance, including workforce development, child care, and marriage promotion. A number of states also have effectively shifted a portion of TANF funds to other parts of their budget by substituting federal TANF funds for some state expenditures, thereby freeing up state funds for unrelated uses (a practice often referred to as “supplantation”).
The uses of TANF funds and the benefits and services for which they are used vary significantly across the states. The maximum TANF cash benefit for a family of three (typically a mother and two children) with no other income is less than half of the poverty line in every state but one.
It is difficult to disentangle the effects on increased labor supply of TANF and the EITC, given the major and nearly concurrent changes made in both areas in the 1990s (see Ziliak 2016 for a review). Scholars generally attribute relatively high weight to macroeconomic conditions and the expansions of the EITC, however, and less to TANF (Chan 2013; Meyer and Rosenbaum 2001). Evidence of the effect of specific welfare-to-work approaches on caseloads and labor supply is mixed, with long-term gains more likely to result from programs that emphasize human capital development over those that emphasize work first (Bloom, Loprest, and Zedlewski 2011; Dyke et al. 2006; Hotz, Imbens, and Klerman 2006). In addition, after-tax-and- transfer income is estimated to be lower for TANF households than what their income would have been under the policies in effect prior to TANF’s creation (namely, under TANF’s predecessor, the AFDC program) (Bitler, Gelbach, and Hoynes 2006; Bollinger, Gonzalez, and Ziliak 2009).
Unemployment Insurance (UI)
UI is a social insurance program that covers most workers. It is primarily funded by employer payroll taxes levied by states and the federal government and is administered on a state-by-state basis as a federal-state partnership. This means there is significant variation in eligibility requirements, benefit levels, and benefit duration across states. Generally, to receive UI an unemployed worker must meet the following requirements: the worker must meet state requirements for wages earned (and reported to the IRS) and/or for the number of calendar quarters worked during the state’s “base period,” and the worker must either have been laid off or left employment with good cause. Additionally, workers receiving UI must be available for work and must accept a suitable offer of employment.
Because UI eligibility is tied to job characteristics, tenure, and the circumstances of one’s separation from a job, coverage varies. The UI program has eroded over the years. In 2019 fewer than 30 percent of the unemployed received UI benefits in an average month (DOL 2019). In addition, low-wage workers are less likely to receive UI following a job loss than are higher-wage workers, in substantial part because of restrictive eligibility rules in most states. The map (figure 16) shows the estimated percentage of jobs in each state that were covered by UI in 2019. It shows not only the wide geographic variation in UI coverage, but also the reach of the UI system—even in those states with the lowest coverage, at least two-thirds of all jobs are covered. Interestingly, a larger share of jobs are eligible for regular UI benefits in the Midwest than in other regions.8
UI is an automatic stabilizer and has been augmented on an ad hoc basis by Congress during economic downturns. Because UI is administered at the state level, rapid expansions of its use during recessions can significantly affect state unemployment insurance trust funds and state budgets. In recessions, the federal government typically steps in and plays a much larger role, with Congress acting to increase the number of weeks of benefits that an unemployed worker can receive and, in some cases, to increase UI benefit levels, and with the federal government covering those costs. In the pandemic and recession of 2020–21, the federal government has also acted aggressively to broaden markedly the number of unemployed workers who can qualify—with particular gains for laid-off low-wage workers—and to supplement weekly UI benefit levels and raise the number of weeks that people can draw the benefits. In April 2020 alone, the states and federal government provided $48 billion in UI payments to unemployed workers (Treasury 2020).
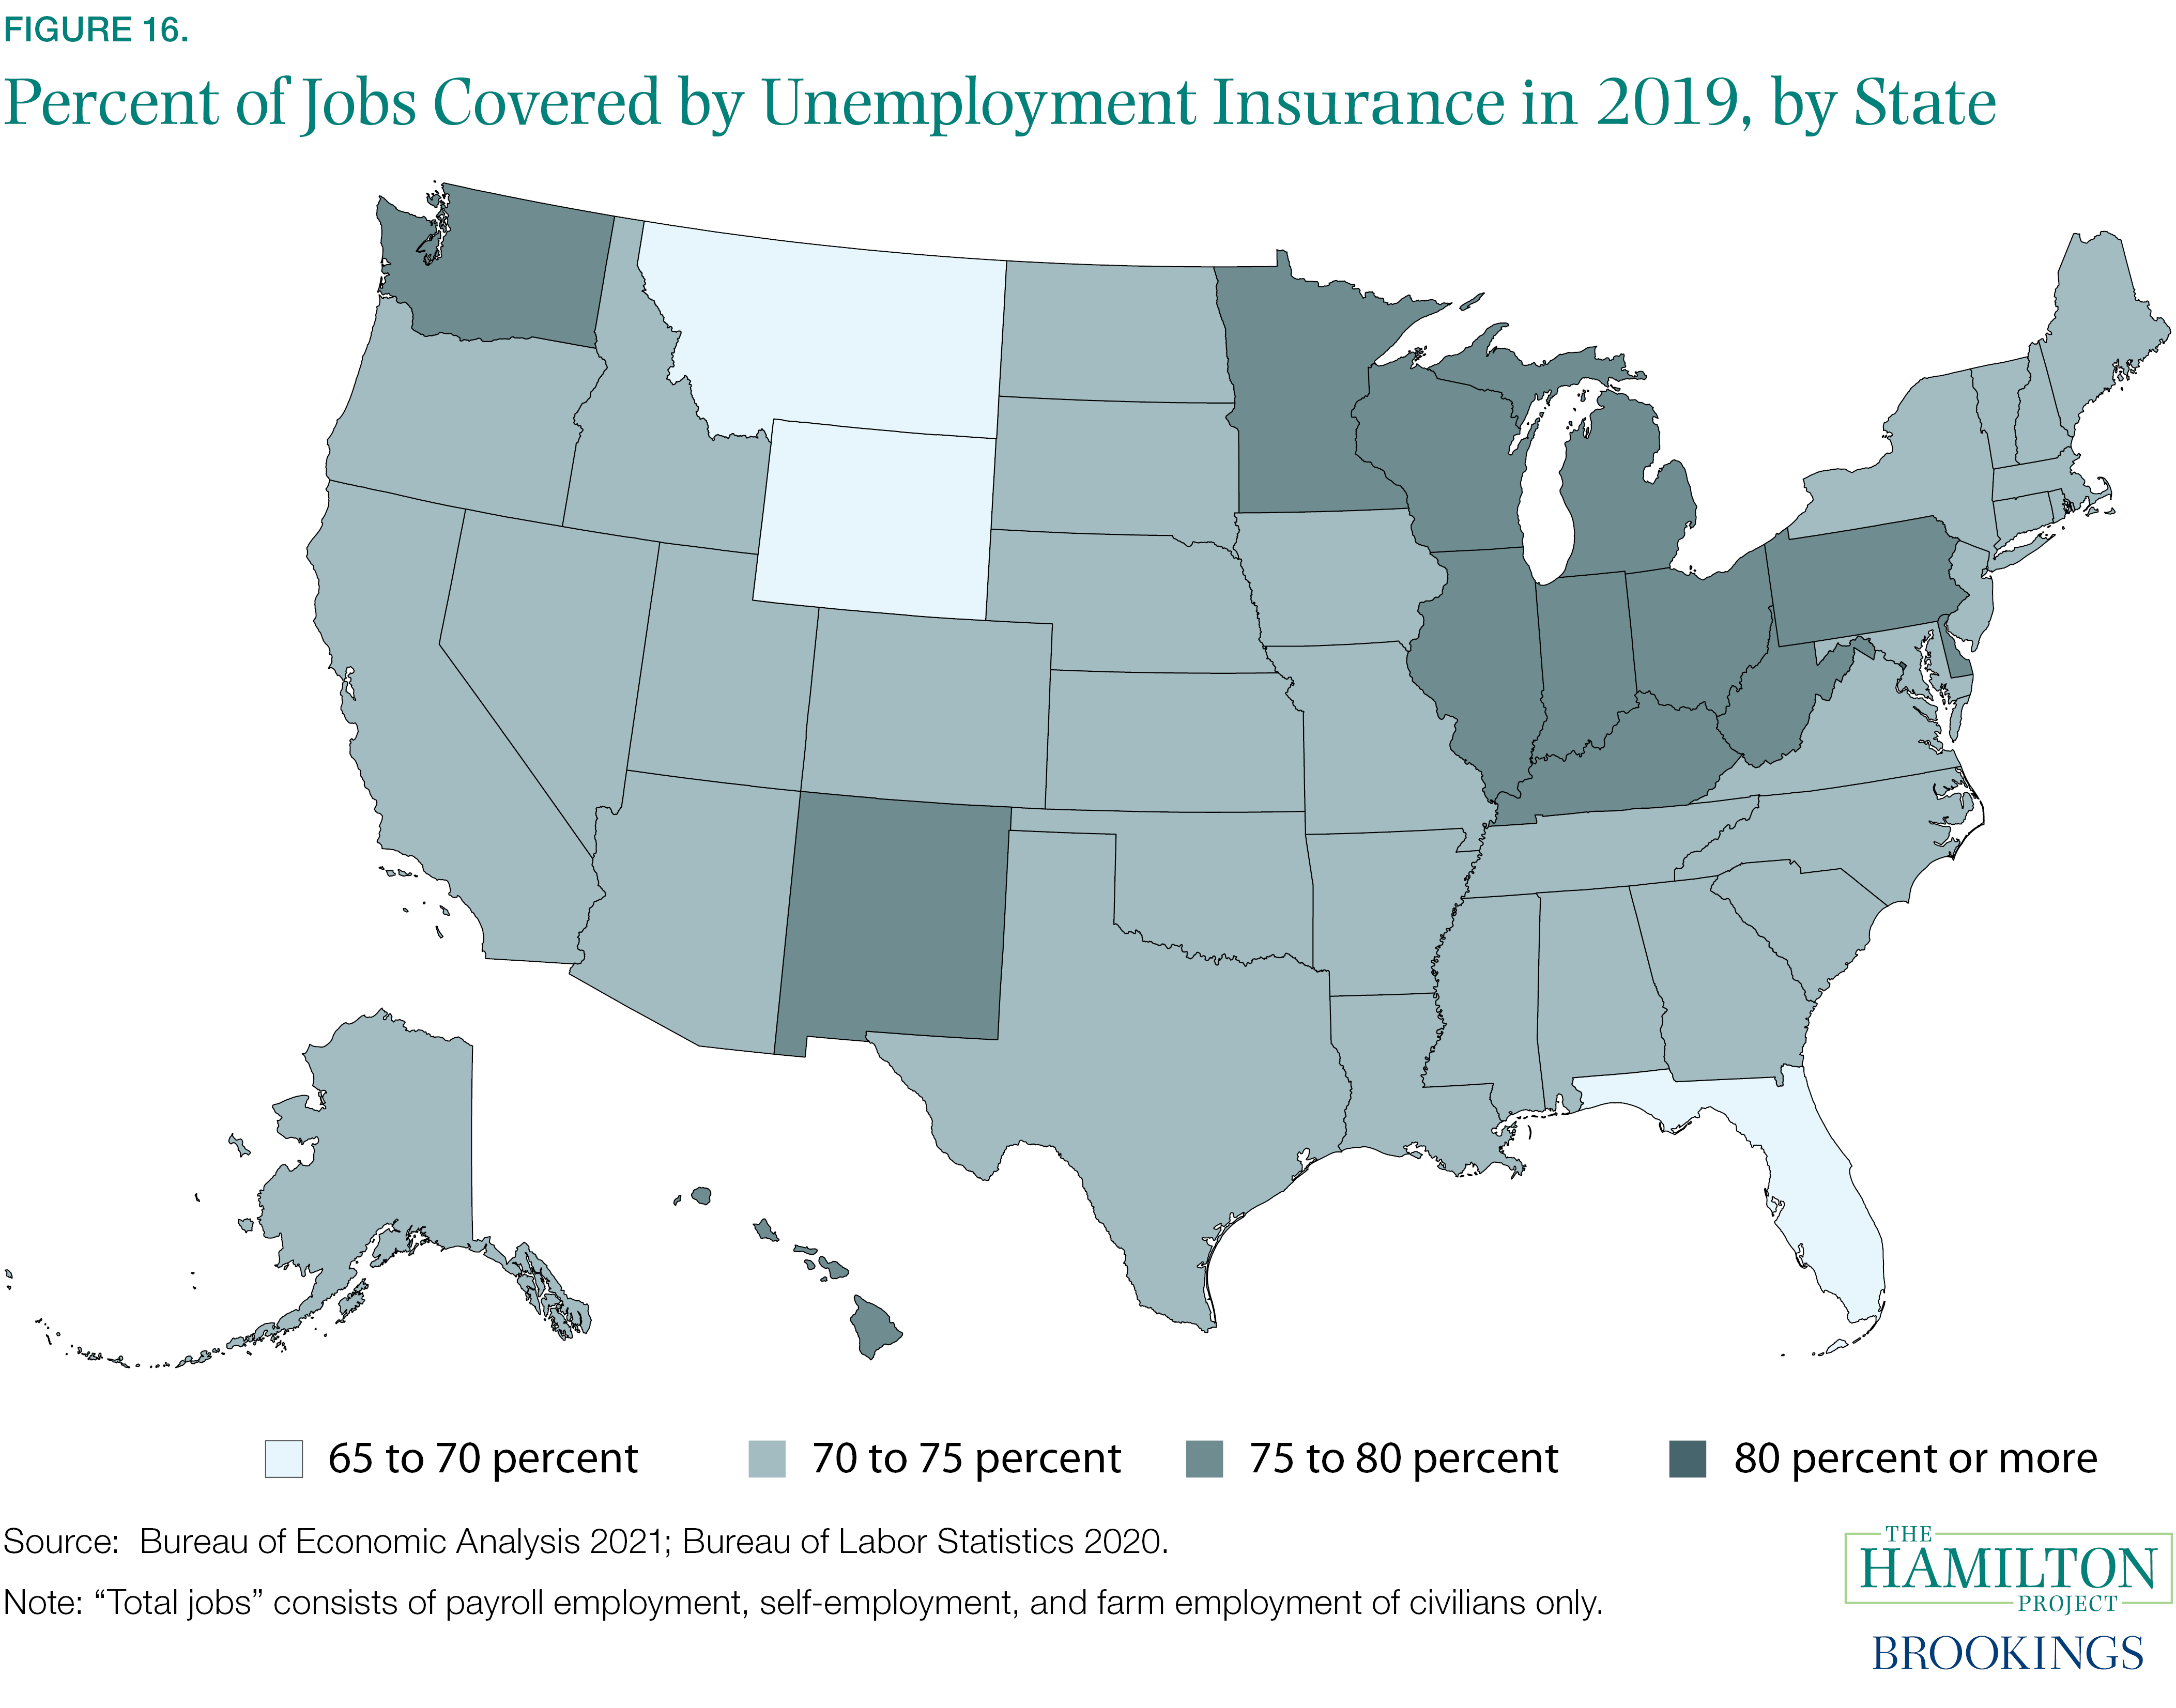
Although federal actions over the past year have helped sustain unemployed workers’ incomes, the fact that these actions were so essential shows there is room for major improvement in the UI program. Moreover, many states had a difficult time responding to the labor market crisis and the extensive changes to the UI system the federal government made. In part, that was because the system is plagued by outdated IT systems. Disturbingly, the unreliability of a state’s IT system appears to be positively correlated with the size of its Black population (Dixon 2020). In June 2020 Black men and women were only about 50 percent and 33 percent, respectively, as likely as their white counterparts to receive UI after applying (Spriggs 2020). Racial disparities in UI recipiency are not just a recent phenomenon, and such patterns also existed during the Great Recession (Grooms, Ortega, and Rubalcaba 2020).
Following job loss, UI helps households maintain consumption (East and Simon 2020; Ganong and Noel 2019); both after being laid off (but before receiving UI benefits), and after exhausting their benefits, households typically reduce their spending (Farrell et al. 2020). Scholars also have found that UI enables workers to extend their job searches, which results in longer spells of unemployment but also better matches (Farooq, Kugler, and Muratori 2020). During the Great Recession, UI receipt increased the unemployment rate modestly by keeping the unemployed actively looking for work instead of dropping out of the labor market (Farber and Valletta 2015; Mazumder 2011; Rothstein 2011). Overall, the effect of UI on the aggregate unemployment rate is smaller when labor demand is weaker (Kroft and Notowidigdo 2016). Similarly, evidence from the depth of the COVID-19 recession shows smaller employment effects from UI than during the depths of previous business cycles, including in states with high average replacement rates (see Dube 2021 for a review).
THP Proposals: Income Support
The effectiveness of TANF’s support—through direct cash assistance and other state-based non-cash programs—has diminished considerably over the past 50 years, partly driven by the decline in real value of federal TANF funding since TANF’s inception in 1997. A THP proposal that would strengthen the program would restore TANF funding to its inflation-adjusted 1997 level and index it to inflation going forward—and periodically revisit the allocation of federal TANF funds across the states to better align the allocations with state-level child poverty rates. The proposal also calls for TANF spending to be more effectively deployed by phasing in requirements that states spend at least a certain percentage of TANF funds on cash assistance and core support categories. And it suggests requiring states to focus all TANF spending on families falling below 150 percent of the official poverty threshold. Still another part of the proposal would establish a permanent emergency TANF fund, modeled on the TANF Pandemic Emergency Assistance Fund enacted in the 2009 recovery legislation. The ability of states to draw on the Fund would be triggered by state-level unemployment metrics. Those metrics also would be used to automatically waive TANF work requirements and lifetime time limits during recessions. (To learn more, read the THP proposal by Marianne Bitler and Hilary Hoynes [2016].)
One other possible reform that would improve the ability of TANF to respond to downturns would be the creation of a TANF Community and Family Stabilization Program. The program, proposed in another THP-commissioned paper, would establish two types of support: (1) Basic cash assistance that can expand countercyclically to act as an automatic stabilizer, and (2) subsidized employment with wraparound supports to stimulate job creation and retention both in downturns and throughout the business cycle, with the resources devoted to this rising during downturns. The program would operate on two triggers—one national and one by state—enabling the program to respond to national and regional economic weakness. Federal funds would then be allocated through a countercyclical federal matching rate that raises federal support when state and national triggers are activated. (To learn more, read the THP proposal by Indivar Dutta-Gupta [2019].)
On the EITC front, a THP proposal would increase the maximum EITC by 10 percent available, representing the first real EITC boost to families with fewer than three children in 25 years. (To learn more, read the THP proposal by Hilary Hoynes, Jesse Rothstein, and Krista Ruffini [2017].) Another proposal would extend EITC eligibility to more childless adults, raise benefit levels for one-child families (the largest group of recipients), thereby increasing the reach of EITC and encourage greater labor-force participation, especially among low-wage workers not raising children. (To learn more, read the THP proposal by Hilary Hoynes [2014].)
Several THP proposals also aim to strengthen UI. One proposal, by Adriana Kugler (2015), offers an experimental approach. Under it, early-stage entrepreneurs, workers pursuing apprenticeships or other on-the-job training, and those accepting part-time work while continuing to seek full-time employment would be allowed to receive UI benefits as well as additional supports including occupational training, stipends for transportation and child care, and retention bonuses awarded to either the worker or the hiring firm following completion of the program.
Other proposed changes to the UI system would automatically boost the level and duration of UI benefits available during recessions to help buffer the economy against periods of sharp job loss and mitigate long-term labor market scarring. One step toward this goal would be to make UI extended benefits fully federally funded, as was the case following the Great Recession and during the COVID-19 recession, in order to remove the disincentive states have to opt into extended benefits. In addition, automatic recession triggers could be created that would extend the number of benefit weeks available (through a combination of regular UI and extended benefits) to 60 weeks during recessions, with an additional 13 weeks added if a state’s unemployment rate breach a certain level. (To learn more, read the THP proposal advancing these recommendations by Gabriel Chodorow-Reich and John Coglianese [2019].)
A more-comprehensive THP proposal by Arindrajit Dube (2021) would reform UI into a fully federally financed and administered program. This structure would improve the responsiveness of the UI system to economic downturns by centralizing data on employment and earnings and by allowing for standardization of eligibility and benefit formulas across states. Maximum benefit duration would scale automatically according to a revised set of national and state economic triggers, reaching up to 98 weeks. Dube also proposes an automatic boost to benefit levels during downturns that would add $100 or $200 to weekly UI benefits when the national unemployment rate breached 6 percent and 8 percent, respectively. In addition, to broaden UI eligibility, the minimum earnings requirement would be lowered, and eligibility would be extended to workers who have voluntarily separated from jobs for good cause such as extenuating family circumstances or cuts to hours or wages outside the employee’s control. Furthermore, a new Jobseeker’s Allowance program would be created that offers less-generous UI benefits to unemployed individuals who have inadequate earnings histories. Finally, workers would be able to receive partial compensation through the UI system when their work hours are reduced.
THP proposals also cover Social Security. One proposal would allow beneficiaries to better match the timing of their benefits to their needs. The proposal would allow beneficiaries to opt into a modified benefit schedule that would reduce the Social Security benefits they receive in earlier years of recipiency or while both spouses are alive, and increase payments later upon the death of one spouse or in the event of later-life disability. (To learn more, read the THP proposal by Jason Brown and Karen Dynan [2016].)
Another, quite expansive THP proposal would create universal insurance to aid families experiencing sharp income declines following life events such as job loss, the death of a spouse, or the onset of an illness or disability. Program benefits would be triggered once a family’s total income declines more than 20 percent (accounting for benefits from other programs) or if its out-of-pocket medical expenses exceed 20 percent of family income. Once one of these thresholds is breached, additional losses would be partially covered on a sliding scale with higher income replacement for the lowest-income families. (To learn more, read the THP proposal by Jacob Hacker [2006].)
Yet another THP proposal, by Claudia Sahm (2019), lays out a plan for automatic, direct stimulus payments to households during downturns. Irrespective of household income, time use, or tax liabilities, one base payment would be given to each adult as well as a half payment for each dependent. The payments would be triggered by the three-month average national unemployment rate rising by 0.5 percentage points over the low of the previous 12-months. In the first year of a recession, the amount of the stimulus payments would be set so that the total federal cost equaled 0.7 percent of GDP, while in the event of extended downturns, subsequent years’ distribution and the benefit amounts would depend on the path of unemployment and be scaled down as unemployment declines.
THP also has commissioned proposals on disability insurance. One proposal would mandate that firms provide private disability insurance coverage to the vast majority of workers. At the onset of a disability, a worker would remain on private disability insurance for 24 months before moving into the SSDI system, during which time they would receive partial wage replacement, workplace accommodations, rehabilitation services, and other services to enable them to reenter or remain in the workforce. The proposal also would offer employers incentives to accommodate workers who become disabled and thereby minimize the movement of workers from employer payrolls to the SSDI system. (To learn more, read the THP proposal by David Autor and Mark Duggan [2010].)
A more experimental path to disability reform, proposed in a THP proposal by Jeffrey Liebman and Jack Smalligan (2013), would institute three demonstration projects to build evidence on the impact of various types of early interventions for disability applicants. The first trial would screen applicants to target those with highest potential for returning to work if provided the proper range of services, and would supply candidates with targeted vocational and health interventions and some form of wage-replacement to test improvements in well-being and employment outcomes. A second trial would allow states to redirect portions of existing funding streams for programs like Medicaid, TANF, and vocational training to target populations that are at risk of receiving lifetime SSI and SSDI benefits, offering states incentive funding for measures to reduce participation in disability programs. The third demonstration project would provide a tax credit incentive to employers against their disability insurance payroll taxes for employers that reduce their disability incidence by at least 20 percent.
4. Nutrition Programs
Between the Great Recession and the COVID-19 pandemic, the prevalence of moderate to severe food insecurity in the United States continued on its downward trajectory as the economy improved, as did participation in nutrition assistance programs (Ganong and Liebman 2013; Ziliak 2015).9 With the COVID-19 pandemic, however, rates of food insecurity rose, particularly for families with children, the children themselves, single mother households, and Black and Hispanic households. (Bauer 2020, Bauer et al. 2020; Bauer 2021; Gupta, Gonzalez, and Waxman, 2020). With additional fiscal support and as the economy has started to recover, these rates have started back down. As of May 24, 2021, rates of food insecurity have come down 30 percent from their December 2020 peak (Schanzenbach 2021).
The COVID-19 pandemic and its associated recession have led, both automatically and through congressional and executive action, to an expansion in eligibility for and the generosity of nutrition assistance programs in the United States. These programs provide resources to households and individuals to support an adequate and healthy diet. Through the automatic expansion of SNAP to serve more households as incomes fell and more households qualified, as well as the provision by policymakers of additional resources for existing programs like SNAP, WIC, and child nutrition programs (NSLP, SBP, and Summer Food Service Program [SFSP]) and the creation of temporary new programs like Pandemic Electronic Benefit Transfer (P-EBT) and USDA’s Farmers to Families Food Box program, millions of eligible households have received billions of additional dollars from federal nutrition programs over the past year in the form of meals, vouchers to purchase food or food boxes. Figure 17 shows the extraordinary increase in spending in 2020.
Supplemental Nutrition Assistance Program (SNAP)
SNAP provides eligible beneficiaries with an electronic benefit transfer (EBT) card that can be used to purchase groceries at more than 250,000 participating grocery retailers. Maximum benefit levels are set based on the cost of the Thrifty Food Plan (TFP) for a reference family of four, with that dollar level then being adjusted by household size. A household’s benefit equals the difference between the cost of the TFP for its household size and 30 percent of the household’s net income (i.e., its income after certain deductions).
SNAP is the largest of the nutrition assistance programs: in fiscal year 2019 there were about 36 million monthly SNAP participants. In general, all low-income households can qualify (though the effective gross income thresholds can vary by state) with two major exceptions. As with most other social insurance programs, undocumented individuals are ineligible, and some categories of legally authorized immigrants are eligible only after a five-year waiting period or aren’t eligible at all. Second, non-disabled individuals aged 18–49 who are not living with minor children can receive benefits for only three months while unemployed or working less than half time out of 36 months, unless they are participating in a qualified work or training program (which typically are in short supply). States can secure temporary waivers from the three-month time limit for areas with elevated unemployment.
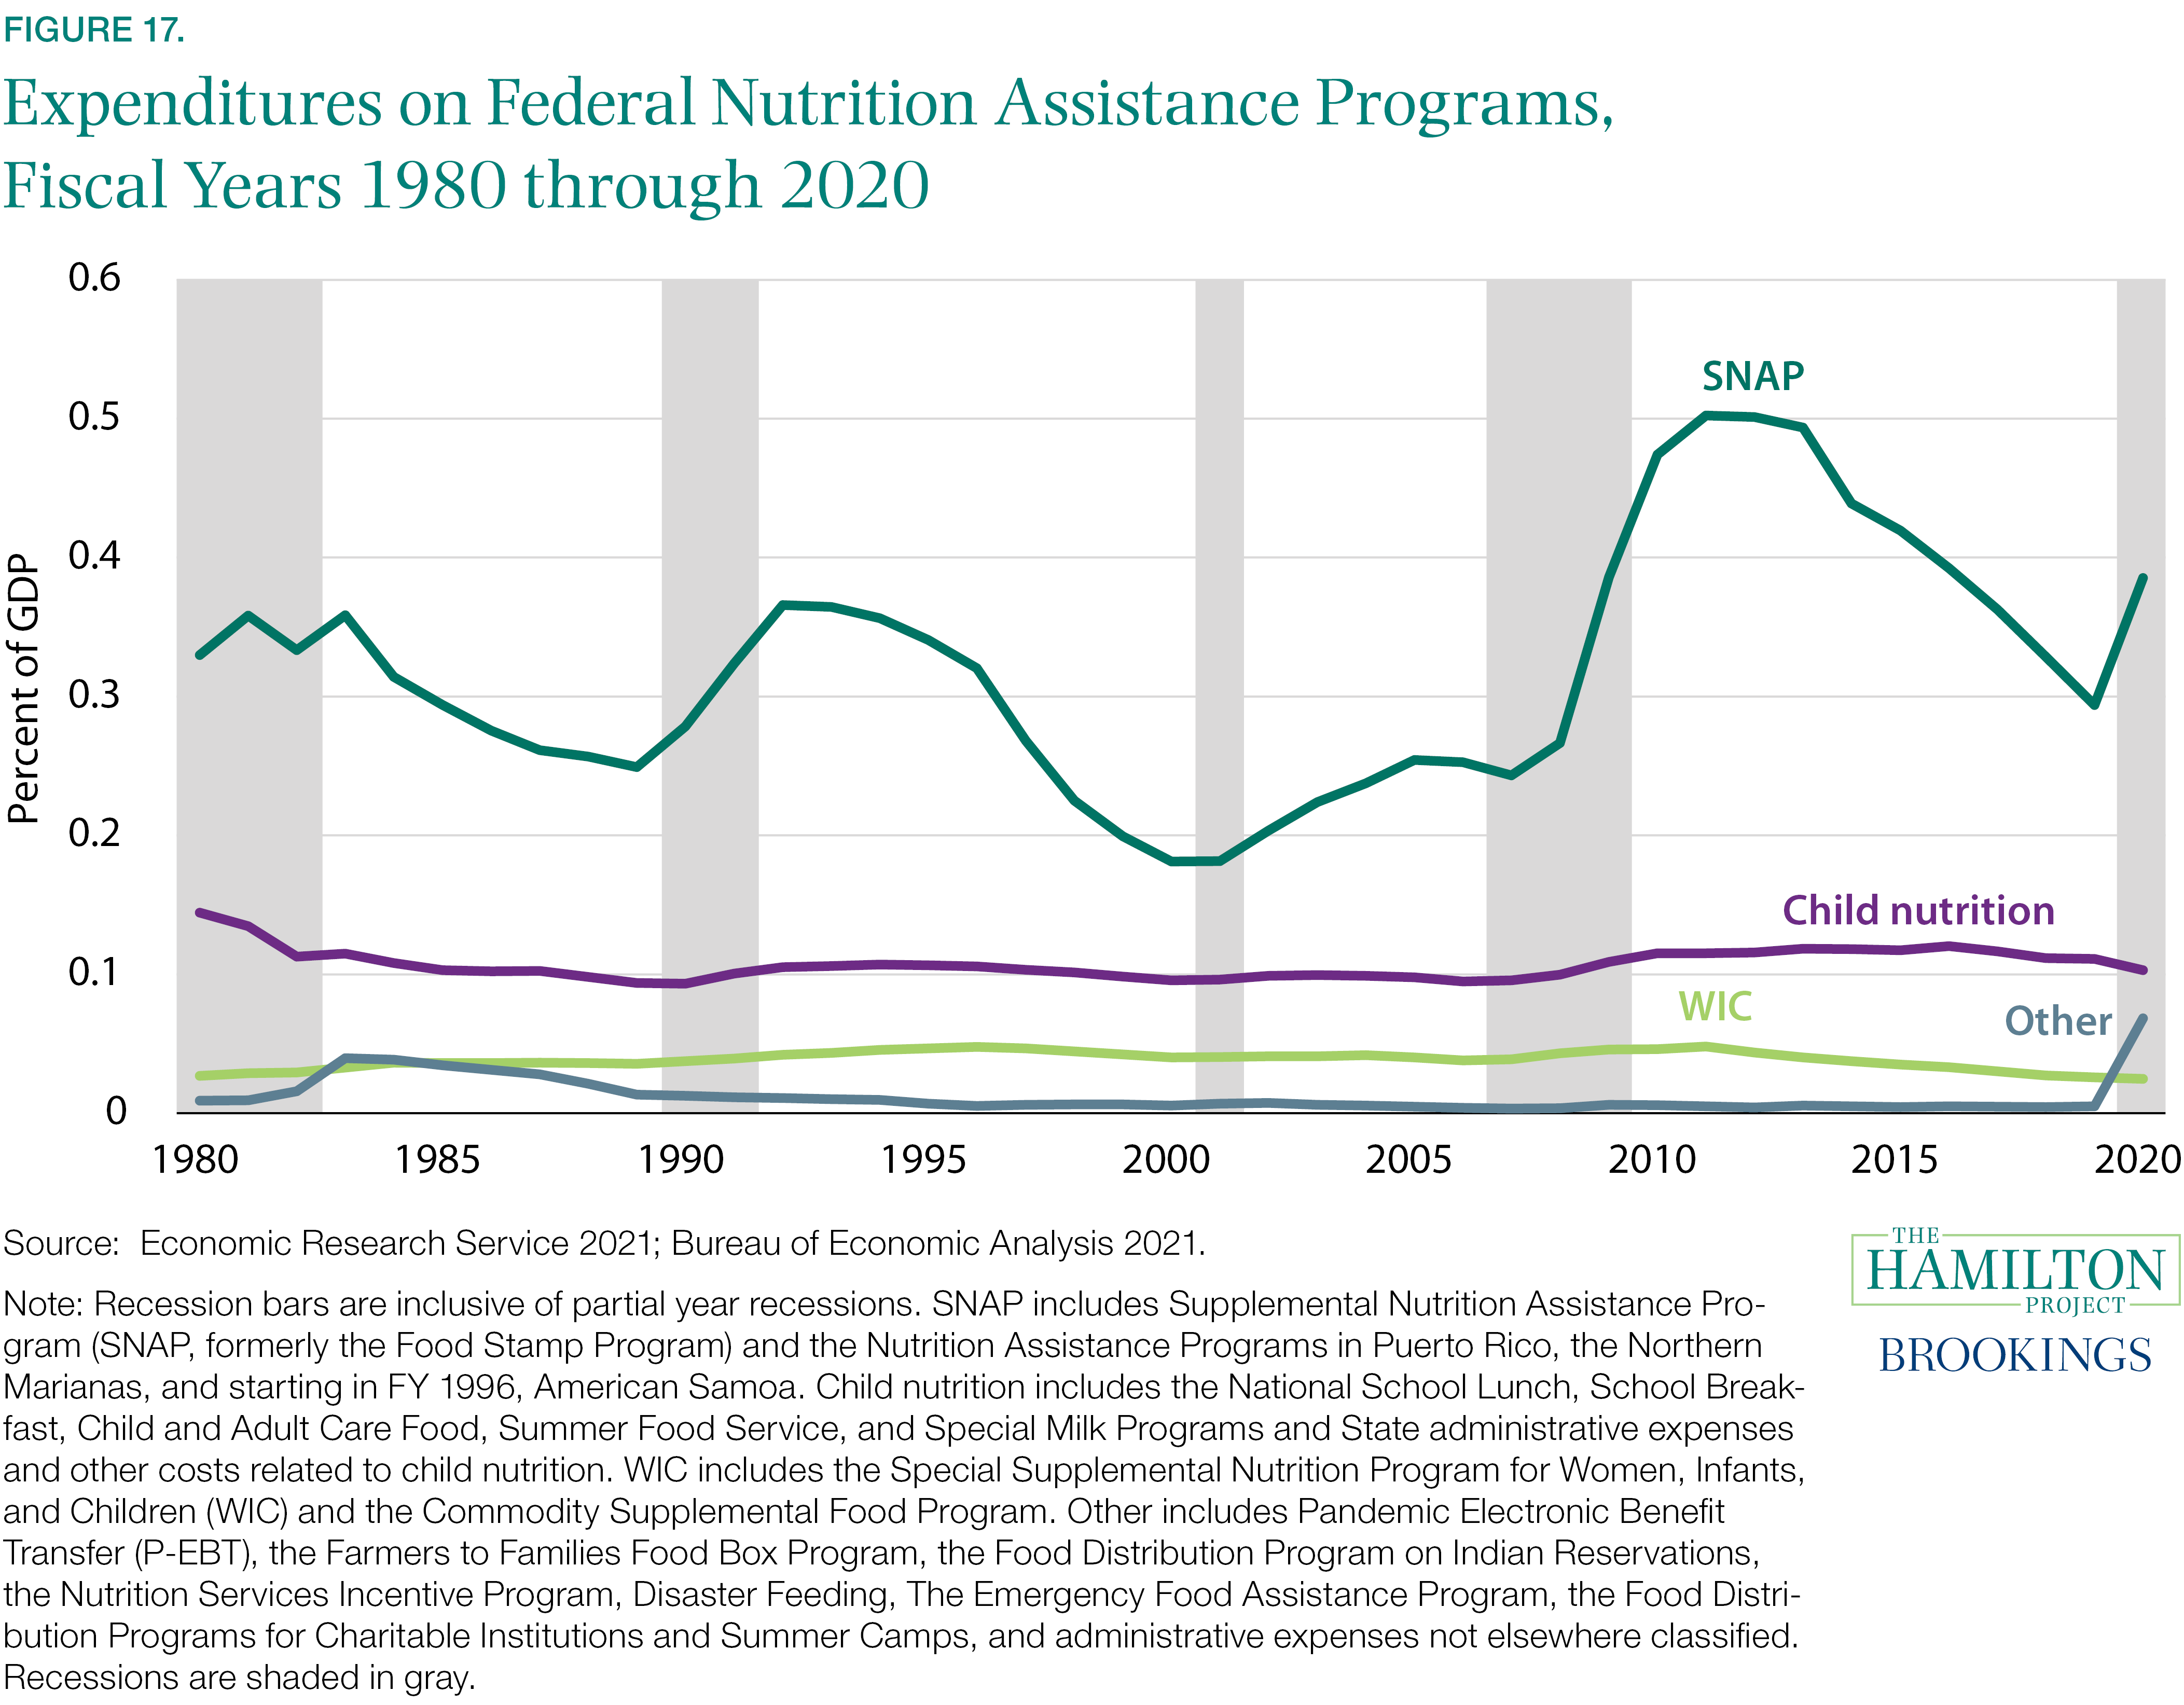
In March 2020, Congress authorized SNAP emergency allotments (EAs), which provided resources to top up participating SNAP households to the maximum benefit amount for their household size, and in early 2021, USDA authorized EAs to also be provided to households already eligible for the maximum benefit. In addition, in December 2020 Congress authorized a 15 percent increase to the SNAP maximum benefit, which expires in September 2021. During the COVID-19 pandemic, SNAP’s three-month time limit for certain individuals not raising minor children has been suspended nationwide.
Evidence shows that SNAP increases health and economic security among families in the short term, as well as economic self-sufficiency in the long term (Bailey et al. 2020; Hoynes, Schanzenbach, and Almond 2016). Several studies have found that SNAP reduces the likelihood that a household will experience food insecurity or very low food security (Hoynes and Schanzenbach 2016). SNAP also improves health among infants and children, including reductions in low-birthweight infants and potentially neonatal deaths (Almond, Hoynes, and Schanzenbach 2011; East 2020). In addition, SNAP improves test scores (Gassman-Pines and Bellows 2018), and increases in SNAP spending during economic downturns are estimated to be among the most effective of the automatic stabilizers (on a bang-for-the-buck basis) in generating economic activity (Zandi and Yaros 2021). SNAP benefits are sometimes referred to as being “near cash” because, on average, a proportion of a household’s benefit substitutes for some household funds that would otherwise go for food, freeing up those funds for other purposes.
Child Nutrition Programs and WIC
The principal child nutrition programs are the WIC, NSLP, and SBP programs. WIC provides federal grants to states for the foods specified in the WIC food package, health-care referrals, and nutrition education for low-income pregnant women, new mothers, and infants and children up to age five who are at nutritional risk, including immigrants. WIC beneficiaries need to have incomes below 185 percent of the poverty line or to be enrolled in an adjunctive program such as Medicaid. As noted, they must also be at nutritional risk, but the nutritional risk standard is broad, and the vast majority of people who meet the program’s income test satisfy its nutritional risk test.
WIC is the third-largest food and nutrition assistance program, serving an average of 6.4 million participants per month in fiscal year 2019 at a federal cost of $5.3 billion, and 6.2 million participants monthly in fiscal year 2020 at a cost of $5 billion. It is not an entitlement, but since about 2007, policymakers have provided sufficient resources for the program to serve all eligible people who apply. Each WIC participant receives the WIC food package for which she and her children are eligible (the food packages do not vary in size according to income among those eligible). Similar to SNAP, there is evidence that WIC reduces low birthweight (Currie and Rajani 2015; Figlio, Hamersma, and Roth 2009; Hoynes, Page, and Stevens 2011), increases birth weight (Bitler and Currie 2005; Rossin-Slater 2013), and improves early childhood health (Chorniy, Currie, and Sonchak 2020).
NSLP and SBP provided free or reduced-cost meals to an average of 29 million and 15 million children daily in fiscal year 2019, respectively. Children can become eligible for free or reduced-price meals based on their family’s income eligibility, through direct certification based on their participation in another means-tested program like SNAP or Medicaid or through the submission of an application. Children also can become eligible for free meals through the programs’ Community Eligibility Provision, which allows all students in a school or district to receive free meals without individual applications if at least a certain share of students in the school or school district qualify for free or reduced-price meals based on data from other sources. These programs, along with the SFSP and the Child and Adult Care Food Program, provided prepared meals for pick-up during 2020 in some areas when schools and child-care centers were closed. Congress also authorized a new program, P-EBT, which replaced missed school meals with a grocery store voucher for families with schoolchildren and which will also operate during summer months while the public health emergency remains in effect.
Evidence suggests that NSLP reduces food insecurity (Nord and Romig 2006), increases educational attainment (Hinrichs 2010), but also increases childhood obesity (Schanzenbach 2009). Increasing access to the school meals programs through the Community Eligibility Provision improves student achievement (Gordanier et al. 2020; Ruffini 2021). Preliminary evidence suggests that P-EBT was effective at reducing food hardship during the summer of 2020, when its initial rollout occurred (Bauer et al. 2020; Keith-Jennings 2020).
THP Proposals: Nutrition
One THP proposal in the nutrition area would revise the TFP, used by the USDA to estimate the cost of an adequate diet, to better align the TFP’s dietary cost estimates with modern food consumption patterns and current dietary guidance. Updating the TFP formula to account for time spent shopping and preparing food is one way to do that and provide more adequate resources to recipients. This proposal also calls for other changes in SNAP that would increase benefit levels for some participants by modifying the program’s calculation of net income, including an increase to the program’s earned income deduction from 20 percent of earnings to 30 percent (to dampen potential work disincentives from the phase-out of benefits as income rises), and by raising the maximum amount that a household can deduct from its gross income to reflect the impact of high housing costs on its ability to buy adequate food (and allowing that maximum amount to vary based on local housing prices). Nutrition programs also could encourage recipients to purchase more fruits and vegetables, as exemplified by the Healthy Incentives Pilot program in Massachusetts. (To learn more about these ideas, read the THP proposal by Diane Schanzenbach [2013].)
Other SNAP proposals would go further in changing existing assumptions underlying the program, such as by allowing SNAP benefit levels to vary across regions, as opposed to today’s single national benefit standard. In addition, in determining the cost of the TFP, USDA relies on antiquated consumption samples and reference families; one of the THP proposals would address that issue. (To learn more, read the THP proposal by James Ziliak [2016].)
Because SNAP is among the most efficient programs at expanding quickly during economic downturns, proposals allowing the program to expand further at the onset of slowdowns and to continue offering elevated benefits for the duration of downturns would boost the program’s efficacy as an automatic stabilizer and as broader stimulus. Proposed reforms in this area would establish national triggers that would automatically suspend SNAP work requirements and raise maximum benefit levels when the 3-month average national unemployment rate rises 0.5 percentage points above its low in the previous 12-months, following the Sahm Rule. (To learn more, read the THP proposal by Hilary Hoynes and Diane Schanzenbach [2019].)
5. Shelter Programs
Before the onset of the COVID-19 pandemic, 34 million people lived in poverty. By August 2020, many households reported increased difficulty covering expenses while others faced eviction or foreclosure (CBPP 2021b; Chun and Grinstein-Weiss 2020; Lake 2020). One analysis found that back-owed rent amounts ranged between $25 billion to $34 billion, with 8 million households and more than 20 million renters possibly facing eviction in early 2021 (National Council of State Housing Agencies [NCSHA] 2020). As of March 2021 households owed a collective $90 billion in deferred principal, interest, taxes and insurance payments (Consumer Financial Protection Bureau [CFPB] 2021). Current housing assistance programs are insufficient to meet these needs, especially among low-income renters. In 2019 only 25 percent of people with incomes less than 50 percent of the poverty threshold lived in units with a housing subsidy (figure 18).
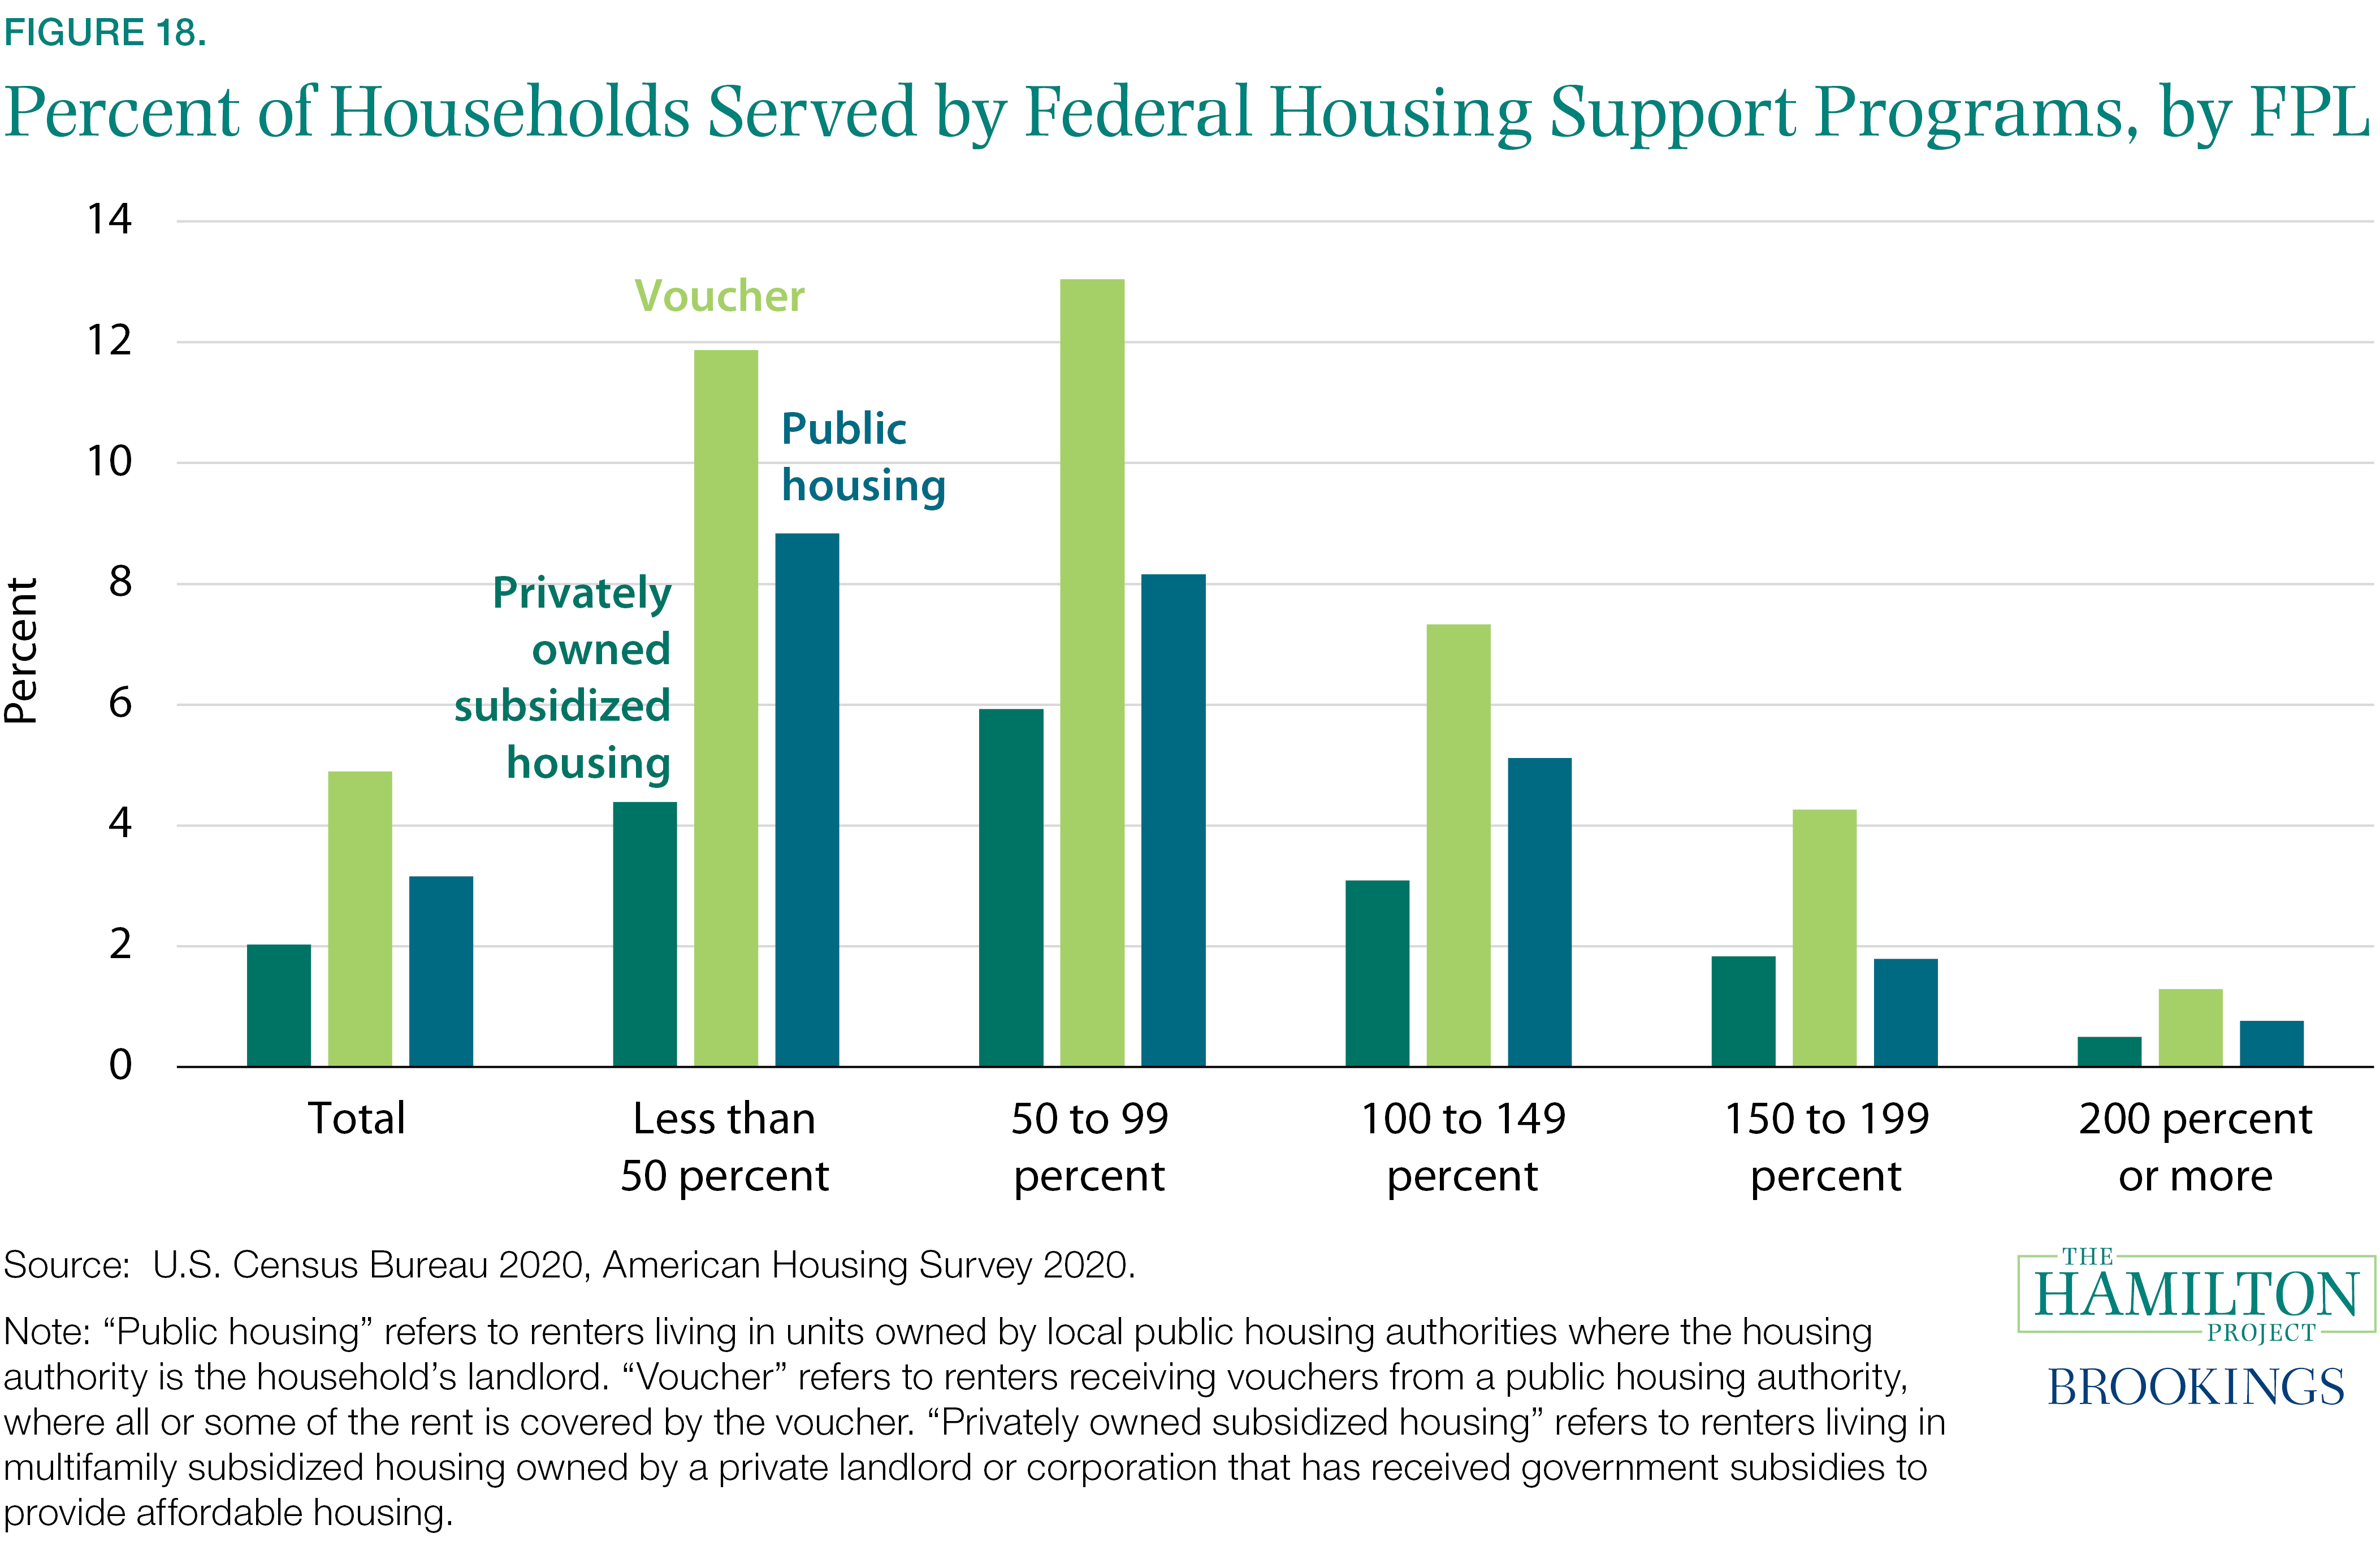
A range of benefits are provided to make housing affordable for a share of the nation’s low-income renters. In addition, some programs help low-income people become first-time homeowners and avoid foreclosure, and there are related programs for special populations such as veterans and people who live in rural areas. However, most programs for homeowners reduce the burden of ownership on middle- to upper-income homeowners, do little for low-income households, and are not appropriately considered social insurance. Programs for renters include the Housing Choice Voucher program, which provides subsidies that lower the cost of renting a unit of a family’s choice, and public housing, where renters are assigned a unit in a specific housing development overseen by the local public housing agency. An alternative program, the Section 8 Project-Based Rental Assistance, shares elements of both of these other programs; under it, the Department of Housing and Urban Development (HUD) enters into long-term contracts with private landlords of multifamily properties to provide affordable housing in exchange for subsidies to cover rental charges that exceed 30 percent of a tenant’s income and to maintain the property.
In addition, LIHEAP, is available to both renters and owners to help with home energy and weatherization costs but is small and meets only a fraction of the need. Another program, the Low Income Housing Tax Credit provides a tax credit to developers and investors to develop affordable housing and is arguably not a social insurance program.
The Housing Choice Voucher Program
The housing choice voucher program is a “tenant-based” program which provides eligible low-income families with housing vouchers that they can use to reduce the cost of rent in a private housing unit (CBPP 2021a). Families pay 30 percent of their income for rent, with the housing program making up the difference as long as the rental charge does not exceed a standard that represents the rental cost of a modest unit in the local area. (Voucher holders can rent units with rents above the standard; if they do, the tenant pays the difference between the standard and the rental charge, in addition to 30 percent of income.) Eligible households typically have extremely low incomes—incomes below the poverty line or below 30 percent of the local median income. The program is the largest low-income housing subsidy program. In 2018, more than 5 million people in 2.2 million households used vouchers to afford safe housing (Mazzara and Knudsen 2019). In general, the vouchers serve a variety of eligible households, including families with children, people with disabilities, and older adults.
Evidence shows that the vouchers reduce rent burdens, sharply reduce homelessness, and reduce the prevalence of overcrowding (Fischer, Rice, and Mazzara 2019; Gubits et al. 2015; Jacob and Ludwig 2012). Research has documented important gains for children under age 13 when a low-income family uses a rental voucher to move to a low-poverty, high-opportunity neighborhood (Chetty et al. 2016). Moreover, research shows that voucher holders are less likely to live in neighborhoods with high crime rates (Lens, Ellen, and O’Regan 2011). That said, not all voucher holders live in safe neighborhoods due to rent prices, limited unit availability, familial ties, and other factors (Collinson and Ganong 2017; McClure 2006; Rosen 2014).
Public Housing
Public housing is one of the nation’s largest and most vital sources of stable, affordable housing for extremely low-income families. Funded by HUD and administered by local Public Housing Agencies (PHAs), more than 2 million low-income Americans are housed in a public housing unit (Docter and Galvez 2020). In recent decades, however, underfunding, especially for public housing maintenance and capital repairs, has led to the degradation of some public housing properties and a decline of available units (Ellen 2020; Hayes and Gerken 2020; Popkin et al. 2020). To provide more reliable funding, some housing agencies have converted some public housing units to long-term Section 8 Project-Based Voucher (PBV) and Project-Based Rental Assistance housing (CBPP 2017a). Unlike public housing, PBVs don’t require families to remain in the project or development to continue receiving rental assistance. Families living in a PBV unit can move out of that unit after one year and retain rental assistance if another voucher (not necessarily one tied to a specific unit) is available (CBPP 2017b, 2017c).
The benefits of public housing are well documented. A recent study by Sarah Gold finds that families who live in public housing are significantly less likely to pay more than 30 percent of their income toward housing compared to families that received another form of housing assistance (Gold 2021). Reduced housing cost burdens are associated with improved adult health, lower rates of food insecurity, and better child development outcomes (Fenelon et al. 2017; Fletcher, Andreyeva, and Busch 2009; Forget 2011). However, the supply of public housing units is limited. A 2012 survey of PHAs found that 1.6 million household were on a public housing waiting list. Between housing choice vouchers, public housing, and project-based rental assistance, only about one in every four eligible low-income renters receives assistance (Collinson, Gould-Ellen, and Ludwig 2016). Researchers and housing agencies alike generally agree that low-income rental assistance programs need adequate funding and other reforms to ensure that adequate, stable housing becomes more widely available (AECOM and STV 2018; Finkel et al. 2010; Fischer, Acosta, and Gartland 2021; Popkin, Cunningham, and Burt 2005; Popkin et al. 2020).
Programs to Help First-Time Homebuyers, and Homeowners at Risk of Foreclosure
First-time homebuyers are offered a range of benefits including preferential terms on Federal Housing Administration (FHA) loans; they can also tap certain retirement savings accounts without penalties to help with their down payments. For mortgage holders in danger of being foreclosed on, FHA oversees several programs to help borrowers stay current on their mortgage payments. In addition, a small federal program, called the Hardest Hit Fund (HHF) program, provides temporary assistance to mortgage borrowers experiencing a loss of income. Research shows that HHF, which spent $8 billion from 2010 through 2019, has been effective at preventing foreclosures (Moulton et al. 2020).
Tax Preferences for Homeowners
The tax system includes several provisions the lower the cost of homeownership, but primarily for higher-income households. Owning is tax preferred over renting because a landlord’s rental income is taxed whereas the imputed rental income of homeowners is not. In addition, mortgage interest payments and property tax payments are deductible from a homeowner’s taxable income and most capital gains from the sale of a primary residence are not subject to taxation. In 2020 the mortgage interest deduction (MID) was estimated to lower homeowners’ tax liability by $30 billion (Keightley 2020). Because the deduction is valuable only to those who itemize their deductions instead of using the standard deduction, and because its value increases with a taxpayer’s marginal tax rate, the MID is regressive—offering a greater benefit as incomes rise.
Low Income Home Energy Assistance Program (LIHEAP)
LIHEAP is a federally funded energy program designed to help low-income renters and homeowners pay energy utilities. The federal government sets broad eligibility guidelines: households must have incomes less than 100 percent of the federal poverty line or be enrolled in another needs-based program, including TANF, SSI, or SNAP. However, states have discretion to design and implement programs based on local needs. The program benefits millions of families. For example, in the winter of 2014, 6.3 million households received financial help through LIHEAP (CRS 2018). For the average household receiving LIHEAP benefits, energy costs as a share of income fell from a range of 5 percent to 18 percent of income pre-benefit to 1 percent to 16 percent post-benefit (Administration for Children and Families [ACF] 2019).
The LIHEAP block grant is severely underfunded. Historically, only 10 to 20 percent of eligible households are served. Additionally, the program does not provide substantial enough benefits to households with the greatest need (Applied Public Policy Research [APPRISE] 2005; Bohr and McCreery 2020; Graff and Pirog 2019; Kaiser and Pulsipher 2006; Kefer and Greenstein 2009).
THP Proposals: Shelter
One proposed THP reform that make tax incentives for homeownership more targeted to lower-income households would convert the MID into a 15 percent refundable tax credit available to all homeowners, including those claiming the standard deduction and those with no income tax liability. This credit would be limited to interest on a moderate level of mortgage debt, and be applicable only for primary homes. (To learn more, read the THP proposal by Alan Viard [2013].)
More targeted initiatives to bolster the housing safety net include the creation of automatic stabilization mechanisms available for renters and homeowners in the case of weak housing markets and acute housing instability. Those mechanisms would be triggered by a recession indicator. Emergency assistance would be automatically provided to renters with incomes below 80 percent of the area’s median income. For homeowners, all mortgages held by low- and moderate-income homeowners with less than 100 percent of area median income would qualify for automatic three-month forbearance in the event of a trigger event. (To learn more, read the THP proposal by Robert Collinson, Ingrid Gould Ellen, and Benjamin Keys [2021].)
Authors


-
Acknowledgements and disclosures
The authors are grateful to Jessica Banthin, Kristen Broady, Indivar Dutta-Gupta, Matthew Fiedler, Will Fischer, Este Griffith, Bradley Hardy, Joseph Llobera, Kriston McIntosh, Zachary Parolin, Isabel Sawhill, Judy Solomon, and Danilo Trisi for insightful comments and input and to Parolin, Trisi, Matthew Saenz, and Sophie Collyer for running and providing analysis on the Supplemental Poverty Measure. Eliana Buckner, Ronnie Clevenstine, Stephanie Lu, Sophia Mariam, Brie Nicker, Elisabeth Raczek, and Winnie Yee provided excellent research assistance. Lastly, the authors would like to thank Jeanine Rees for all of her help with the graphic design and layout of this document.
-
Footnotes
- Categories include all program outlays highlighted in CBPP (2020). The “all other programs” category additionally captures spending for federal student aid; VA and US Department of Defense health services; and employment and training programs.
- Here, as well as in the companion analysis cited in the next footnote, the refundable portion of the EITC and CTC (the part that results in government outlays) is counted, while the portion of these tax credits that reduces some households’ federal income tax liability is not.
- The anchored SPM data from the Columbia University researchers that we cite here use the SPM’s poverty thresholds for 2012 and adjust them for inflation both for years before 2012 and for years after that. for more discussion of why using the anchored SPM is the preferred way to measure changes in the SPM’s poverty rates over time, see Wimer et al., (2016). Other versions of the SPM make different adjustments over time in the poverty-line thresholds, resulting in those other measures being more akin to relative measures of poverty.
- The Urban Institute has developed a model, known as the Transfer Income Model (TRIM), that uses program data from administrative records to adjust the Census data to correct for the underreporting of various program benefits. TRIM-adjusted data are available now only for certain years, however; because we are making historical comparisons here, we are unable to use them. Were we able to do so, those data would show various social insurance programs, and the social insurance system as a whole, as having modestly larger poverty-reduction effects than we describe here.
- Consider two families, one of which falls $1,500 below the poverty line and the other of which is $5,000 below it. Suppose the first family receives a $2,000 benefit, while the second family — because it is poorer — receives a $3,000 benefit. An analysis limited to the change in poverty rates will simply count the first family as being raised out of poverty by the program and portray the second family as still being poor. A poverty gap analysis thus provides important additional information, reflecting reductions in the depth of poverty.
- The PDG is one of the largest federal investments to increase preschool access and quality standards. Grants were awarded to 18 states in December of 2014 and each ran for a four-year period. The goal of the PDG program was to support kindergarten readiness by expanding access to high-quality preschool programs for children in low-income families. The first-wave grants concluded in 2018.
- The 13 states that have not implemented the ACA’s Medicaid expansion include Missouri, where voters approved a ballot initiative to adopt it but the governor and legislature are resisting it and the expansion has not been implemented. We count Oklahoma as implementing the expansion, as the expansion takes effect in that state on July 1, 2021.
- The insured unemployment rates reported by the US Department of Labor (DOL) are calculated by dividing the total number of continued UI claims by the total number of covered jobs (Burtless 1983); these rates consequently do not reflect the actual proportion of workers covered by unemployment insurance.
- Food insecurity is the condition of limited or uncertain access to adequate food, with the severity determined by answers to surveys. For example, those with severe food insecurity reported many times throughout a year when food consumption was reduced because of a lack of money.
The Brookings Institution is committed to quality, independence, and impact.
We are supported by a diverse array of funders. In line with our values and policies, each Brookings publication represents the sole views of its author(s).