


As the first decade of the 2000s drew to a close, the two downturns that bookended the period, combined with slow job growth between, clearly took their toll on the nation’s less fortunate residents.
Over a ten-year span, the country saw the poor population grow by 12.3 million, driving the total number of Americans in poverty to a historic high of 46.2 million. By the end of the decade, over 15 percent of the nation’s population lived below the federal poverty line—$22,314 for a family of four in 2010—though these increases did not occur evenly throughout the country.
Find concentrated poverty statistics for your metropolitan area »
An analysis of data on neighborhood poverty from the 2005–09 American Community Surveys and Census 2000 reveals that:
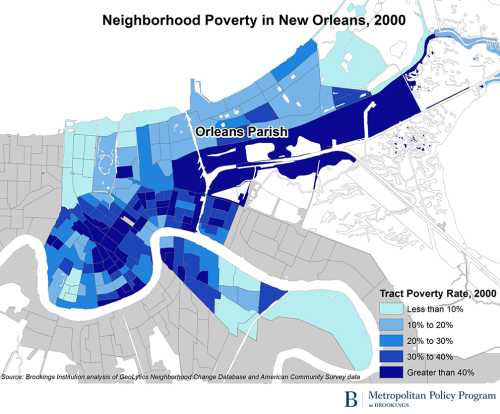
After declining in the 1990s, the population in extreme-poverty neighborhoods—where at least 40 percent of individuals live below the poverty line—rose by one-third from 2000 to 2005–09. By the end of the period, 10.5 percent of poor people nationwide lived in such neighborhoods, up from 9.1 percent in 2000, but still well below the 14.1 percent rate in 1990.
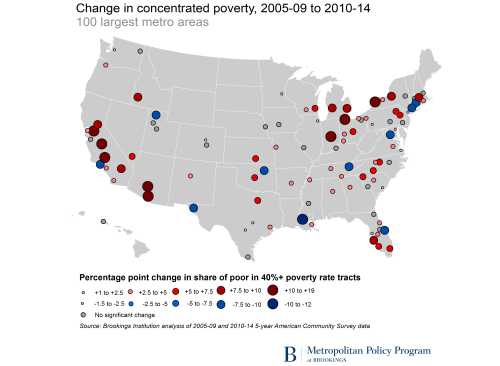
Concentrated poverty nearly doubled in Midwestern metro areas from 2000 to 2005–09, and rose by one-third in Southern metro areas. The Great Lakes metro areas of Toledo, Youngstown, Detroit, and Dayton ranked among those experiencing the largest increases in concentrated poverty rates, while the South was home to metro areas posting both some of the largest increases (El Paso, Baton Rouge, and Jackson) and decreases (McAllen, Virginia Beach, and Charleston). At the same time, concentrated poverty declined in Western metro areas, a trend which may have reversed in the wake of the late 2000s housing crisis.
The population in extreme-poverty neighborhoods rose more than twice as fast in suburbs as in cities from 2000 to 2005–09. The same is true of poor residents in extreme-poverty tracts, who increased by 41 percent in suburbs, compared to 17 percent in cities. However, poor people in cities remain more than four times as likely to live in concentrated poverty as their suburban counterparts.
The shift of concentrated poverty to the Midwest and South in the 2000s altered the average demographic profile of extreme-poverty neighborhoods. Compared to 2000, residents of extreme-poverty neighborhoods in 2005–09 were more likely to be white, native-born, high school or college graduates, homeowners, and not receiving public assistance. However, black residents continued to comprise the largest share of the population in these neighborhoods (45 percent), and over two-thirds of residents had a high school diploma or less.
The recession-induced rise in poverty in the late 2000s likely further increased the concentration of poor individuals into neighborhoods of extreme poverty. While the concentrated poverty rate in large metro areas grew by half a percentage point between 2000 and 2005–09, estimates suggest the concentrated poverty rate rose by 3.5 percentage points in 2010 alone, to reach 15.1 percent. Some of the steepest estimated increases compared to 2005–09 occurred in Sun Belt metro areas like Cape Coral, Fresno, Modesto, and Palm Bay, and in Midwestern places like Indianapolis, Grand Rapids, and Akron.
These trends suggest the strong economy of the late 1990s did not permanently resolve the challenge of concentrated poverty. The slower economic growth of the 2000s, followed by the worst downturn in decades, led to increases in neighborhoods of extreme poverty once again throughout the nation, particularly in suburban and small metropolitan communities and in the Midwest. Policies that foster balanced and sustainable economic growth at the regional level, and that forge connections between growing clusters of low-income neighborhoods and regional economic opportunity, will be key to longer-term progress against concentrated disadvantage.
Related Content

Related Books


The Brookings Institution is committed to quality, independence, and impact.
We are supported by a diverse array of funders. In line with our values and policies, each Brookings publication represents the sole views of its author(s).