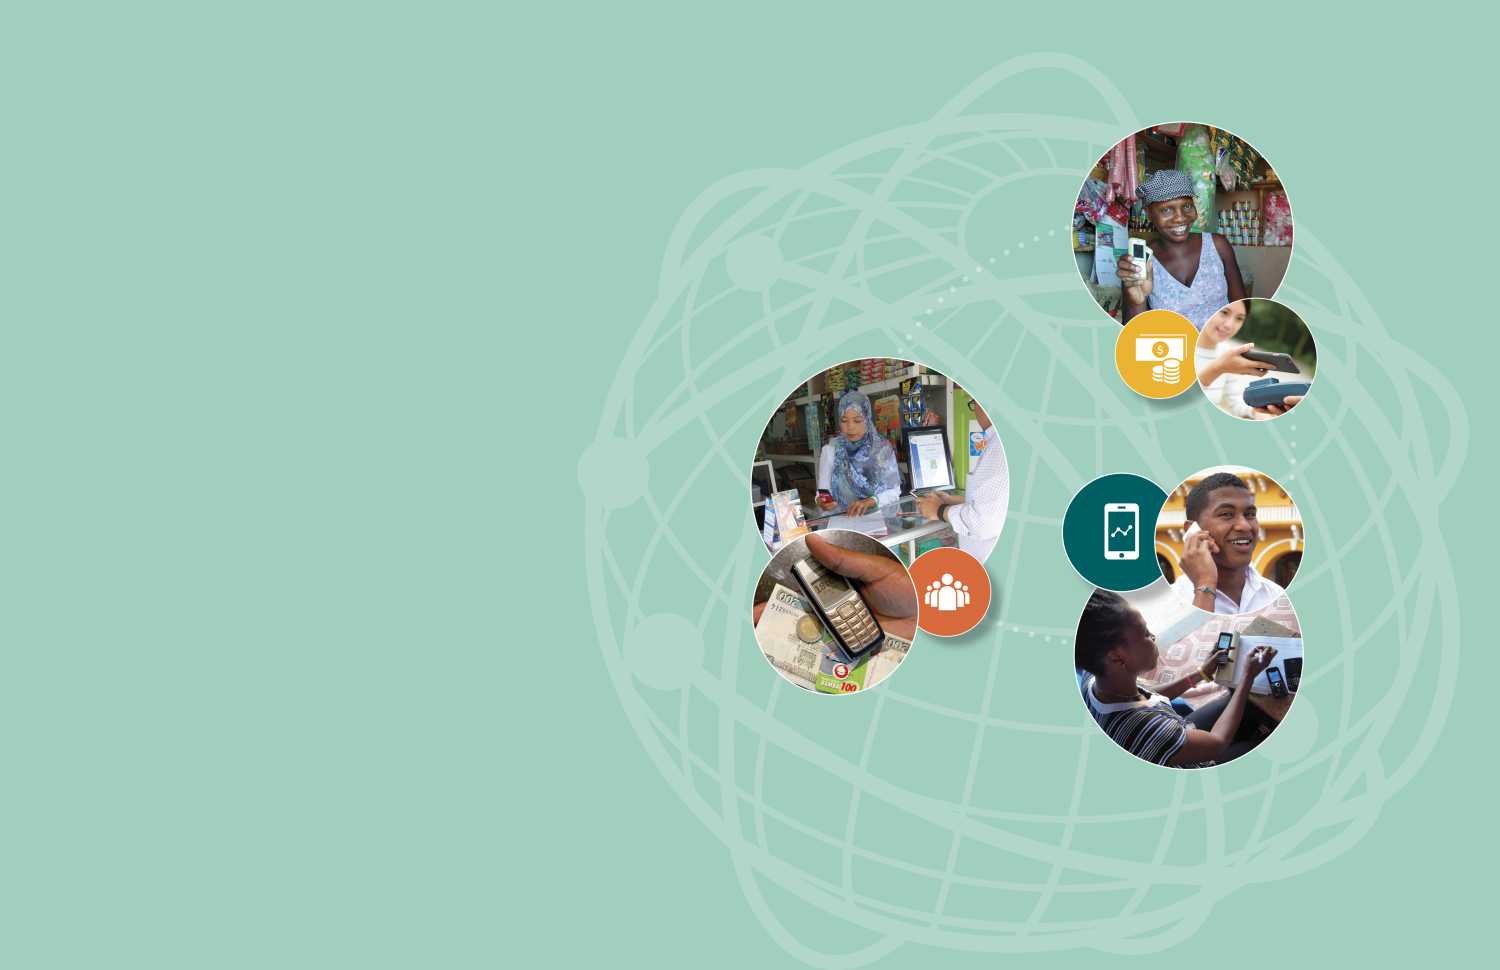
The 2017 Brookings Financial and Digital Inclusion Project (FDIP) report evaluates access to and usage of affordable financial services by underserved people across 26 geographically, politically, and economically diverse countries.
The 2017 report assesses these countries’ financial inclusion ecosystems based on four dimensions of financial inclusion: country commitment, mobile capacity, regulatory environment, and adoption of selected traditional and digital financial services.
The 2017 report builds upon the first annual FDIP report, published in August 2015, and the second annual FDIP report, published in August 2016.
The 2017 report examines key developments in the global financial inclusion landscape, highlights selected financial inclusion initiatives within the 26 FDIP countries over the previous year, and provides targeted recommendations aimed at advancing financial inclusion.
Use the interactive scorecard visualization below to explore and compare overall, dimension, and indicator scores for the FDIP countries. Click on a country’s name or dimension score to view a detailed, country-specific scoring guide.
To learn more about the FDIP scores and methodology, download the 2017 report.
Comments and feedback can be sent to [email protected].
-
 Kenya86%89899478Close Kenya
Score: 86%
Adult Population: 26.8 Million
GDP: $63 Billion USD
Click on the arrows by each indicator title to view a detailed indicator scoring guide. Note that certain indicators are scored out of 1 or 3, while others are scored out of 1, 2, or 3. To compare multiple countries’ scores, scroll down and click on another country’s name or dimension score. To learn more about the FDIP scores and view relevant citations, please read the 2016 report.
Country Commitment89%
National-level participation in international financial inclusion-oriented organizations or networks3/3
Existence of a national financial inclusion strategy3/3
Existence of quantifiable financial inclusion targets3/3
Existence of a recent demand-side financial services survey conducted or supported by a government entity3/3
Existence of a dedicated financial inclusion body within the public sector3/3
Existence of a consumer protection framework regarding financial services1/3
Mobile Capacity89%
Market penetration with respect to unique subscribers2/3
3G mobile coverage by population3/3
Smartphone adoption2/3
Availability of bill payments via mobile money services3/3
Availability of international remittances via mobile money services3/3
Availability of merchant payments via mobile money services3/3
Regulatory Environment94%
Agent banking3/3
Inclusive ecosystem for mobile financial service deployment principals3/3
E-money regulations3/3
Mobile money platform interoperability2/3
Account access and usage3/3
Cash-in/cash-out at agent locations3/3
Adoption78%
Formal financial institution account penetration among lower-income adults2/3
Formal financial institution account penetration among women3/3
Borrowing from a financial institution3/3
Saving at a financial institution3/3
Debit card use1/3
Credit card use1/3
Percentage of adults utilizing online bill payments and purchases1/3
Mobile money account penetration among lower-income adults3/3
Mobile money account penetration among women3/3
Mobile phone used to receive salary or wages (among recent wage-earners)3/3
Mobile phone used to make utility payments (among adults regularly making utility bill payments)3/3
Frequency of account usage2/3
-
 Brazil79%89898367Close Brazil
Score: 79%
Adult Population: 160.0 Million
GDP: $1,804 Billion USD
Click on the arrows by each indicator title to view a detailed indicator scoring guide. Note that certain indicators are scored out of 1 or 3, while others are scored out of 1, 2, or 3. To compare multiple countries’ scores, scroll down and click on another country’s name or dimension score. To learn more about the FDIP scores and view relevant citations, please read the 2016 report.
Country Commitment89%
National-level participation in international financial inclusion-oriented organizations or networks3/3
Existence of a national financial inclusion strategy3/3
Existence of quantifiable financial inclusion targets1/3
Existence of a recent demand-side financial services survey conducted or supported by a government entity3/3
Existence of a dedicated financial inclusion body within the public sector3/3
Existence of a consumer protection framework regarding financial services3/3
Mobile Capacity89%
Market penetration with respect to unique subscribers3/3
3G mobile coverage by population3/3
Smartphone adoption3/3
Availability of bill payments via mobile money services3/3
Availability of international remittances via mobile money services1/3
Availability of merchant payments via mobile money services3/3
Regulatory Environment83%
Agent banking3/3
Inclusive ecosystem for mobile financial service deployment principals3/3
E-money regulations3/3
Mobile money platform interoperability2/3
Account access and usage1/3
Cash-in/cash-out at agent locations3/3
Adoption67%
Formal financial institution account penetration among lower-income adults3/3
Formal financial institution account penetration among women3/3
Borrowing from a financial institution2/3
Saving at a financial institution1/3
Debit card use3/3
Credit card use3/3
Percentage of adults utilizing online bill payments and purchases2/3
Mobile money account penetration among lower-income adults1/3
Mobile money account penetration among women1/3
Mobile phone used to receive salary or wages (among recent wage-earners)1/3
Mobile phone used to make utility payments (among adults regularly making utility bill payments)1/3
Frequency of account usage3/3
-
 Mexico79%100948358Close Mexico
Score: 79%
Adult Population: 92.0 Million
GDP: $1,144 Billion USD
Click on the arrows by each indicator title to view a detailed indicator scoring guide. Note that certain indicators are scored out of 1 or 3, while others are scored out of 1, 2, or 3. To compare multiple countries’ scores, scroll down and click on another country’s name or dimension score. To learn more about the FDIP scores and view relevant citations, please read the 2016 report.
Country Commitment100%
National-level participation in international financial inclusion-oriented organizations or networks3/3
Existence of a national financial inclusion strategy3/3
Existence of quantifiable financial inclusion targets3/3
Existence of a recent demand-side financial services survey conducted or supported by a government entity3/3
Existence of a dedicated financial inclusion body within the public sector3/3
Existence of a consumer protection framework regarding financial services3/3
Mobile Capacity94%
Market penetration with respect to unique subscribers3/3
3G mobile coverage by population3/3
Smartphone adoption2/3
Availability of bill payments via mobile money services3/3
Availability of international remittances via mobile money services3/3
Availability of merchant payments via mobile money services3/3
Regulatory Environment83%
Agent banking3/3
Inclusive ecosystem for mobile financial service deployment principals3/3
E-money regulations1/3
Mobile money platform interoperability3/3
Account access and usage3/3
Cash-in/cash-out at agent locations2/3
Adoption58%
Formal financial institution account penetration among lower-income adults2/3
Formal financial institution account penetration among women2/3
Borrowing from a financial institution2/3
Saving at a financial institution2/3
Debit card use2/3
Credit card use2/3
Percentage of adults utilizing online bill payments and purchases2/3
Mobile money account penetration among lower-income adults1/3
Mobile money account penetration among women1/3
Mobile phone used to receive salary or wages (among recent wage-earners)1/3
Mobile phone used to make utility payments (among adults regularly making utility bill payments)1/3
Frequency of account usage3/3
-
 Colombia78%100898956Close Colombia
Score: 78%
Adult Population: 36.5 Million
GDP: $292 Billion USD
Click on the arrows by each indicator title to view a detailed indicator scoring guide. Note that certain indicators are scored out of 1 or 3, while others are scored out of 1, 2, or 3. To compare multiple countries’ scores, scroll down and click on another country’s name or dimension score. To learn more about the FDIP scores and view relevant citations, please read the 2016 report.
Country Commitment100%
National-level participation in international financial inclusion-oriented organizations or networks3/3
Existence of a national financial inclusion strategy3/3
Existence of quantifiable financial inclusion targets3/3
Existence of a recent demand-side financial services survey conducted or supported by a government entity3/3
Existence of a dedicated financial inclusion body within the public sector3/3
Existence of a consumer protection framework regarding financial services3/3
Mobile Capacity89%
Market penetration with respect to unique subscribers2/3
3G mobile coverage by population3/3
Smartphone adoption2/3
Availability of bill payments via mobile money services3/3
Availability of international remittances via mobile money services3/3
Availability of merchant payments via mobile money services3/3
Regulatory Environment89%
Agent banking3/3
Inclusive ecosystem for mobile financial service deployment principals3/3
E-money regulations3/3
Mobile money platform interoperability1/3
Account access and usage3/3
Cash-in/cash-out at agent locations3/3
Adoption56%
Formal financial institution account penetration among lower-income adults2/3
Formal financial institution account penetration among women2/3
Borrowing from a financial institution3/3
Saving at a financial institution1/3
Debit card use2/3
Credit card use2/3
Percentage of adults utilizing online bill payments and purchases2/3
Mobile money account penetration among lower-income adults1/3
Mobile money account penetration among women1/3
Mobile phone used to receive salary or wages (among recent wage-earners)1/3
Mobile phone used to make utility payments (among adults regularly making utility bill payments)1/3
Frequency of account usage2/3
-
 South Africa78%83946772Close South Africa
Score: 78%
Adult Population: 38.9 Million
GDP: $315 Billion USD
Click on the arrows by each indicator title to view a detailed indicator scoring guide. Note that certain indicators are scored out of 1 or 3, while others are scored out of 1, 2, or 3. To compare multiple countries’ scores, scroll down and click on another country’s name or dimension score. To learn more about the FDIP scores and view relevant citations, please read the 2016 report.
Country Commitment83%
National-level participation in international financial inclusion-oriented organizations or networks3/3
Existence of a national financial inclusion strategy2/3
Existence of quantifiable financial inclusion targets3/3
Existence of a recent demand-side financial services survey conducted or supported by a government entity3/3
Existence of a dedicated financial inclusion body within the public sector2/3
Existence of a consumer protection framework regarding financial services2/3
Mobile Capacity94%
Market penetration with respect to unique subscribers3/3
3G mobile coverage by population3/3
Smartphone adoption2/3
Availability of bill payments via mobile money services3/3
Availability of international remittances via mobile money services3/3
Availability of merchant payments via mobile money services3/3
Regulatory Environment67%
Agent banking3/3
Inclusive ecosystem for mobile financial service deployment principals1/3
E-money regulations3/3
Mobile money platform interoperability1/3
Account access and usage1/3
Cash-in/cash-out at agent locations3/3
Adoption72%
Formal financial institution account penetration among lower-income adults3/3
Formal financial institution account penetration among women3/3
Borrowing from a financial institution2/3
Saving at a financial institution3/3
Debit card use3/3
Credit card use2/3
Percentage of adults utilizing online bill payments and purchases2/3
Mobile money account penetration among lower-income adults1/3
Mobile money account penetration among women1/3
Mobile phone used to receive salary or wages (among recent wage-earners)2/3
Mobile phone used to make utility payments (among adults regularly making utility bill payments)1/3
Frequency of account usage3/3
-
 Uganda78%100789458Close Uganda
Score: 78%
Adult Population: 20.3 Million
GDP: $28 Billion USD
Click on the arrows by each indicator title to view a detailed indicator scoring guide. Note that certain indicators are scored out of 1 or 3, while others are scored out of 1, 2, or 3. To compare multiple countries’ scores, scroll down and click on another country’s name or dimension score. To learn more about the FDIP scores and view relevant citations, please read the 2016 report.
Country Commitment100%
National-level participation in international financial inclusion-oriented organizations or networks3/3
Existence of a national financial inclusion strategy3/3
Existence of quantifiable financial inclusion targets3/3
Existence of a recent demand-side financial services survey conducted or supported by a government entity3/3
Existence of a dedicated financial inclusion body within the public sector3/3
Existence of a consumer protection framework regarding financial services3/3
Mobile Capacity78%
Market penetration with respect to unique subscribers2/3
3G mobile coverage by population2/3
Smartphone adoption1/3
Availability of bill payments via mobile money services3/3
Availability of international remittances via mobile money services3/3
Availability of merchant payments via mobile money services3/3
Regulatory Environment94%
Agent banking3/3
Inclusive ecosystem for mobile financial service deployment principals3/3
E-money regulations3/3
Mobile money platform interoperability2/3
Account access and usage3/3
Cash-in/cash-out at agent locations3/3
Adoption58%
Formal financial institution account penetration among lower-income adults1/3
Formal financial institution account penetration among women1/3
Borrowing from a financial institution3/3
Saving at a financial institution2/3
Debit card use1/3
Credit card use1/3
Percentage of adults utilizing online bill payments and purchases1/3
Mobile money account penetration among lower-income adults2/3
Mobile money account penetration among women2/3
Mobile phone used to receive salary or wages (among recent wage-earners)2/3
Mobile phone used to make utility payments (among adults regularly making utility bill payments)3/3
Frequency of account usage2/3
-
 Philippines76%1009410042Close Philippines
Score: 76%
Adult Population: 68.5 Million
GDP: $292 Billion USD
Click on the arrows by each indicator title to view a detailed indicator scoring guide. Note that certain indicators are scored out of 1 or 3, while others are scored out of 1, 2, or 3. To compare multiple countries’ scores, scroll down and click on another country’s name or dimension score. To learn more about the FDIP scores and view relevant citations, please read the 2016 report.
Country Commitment100%
National-level participation in international financial inclusion-oriented organizations or networks3/3
Existence of a national financial inclusion strategy3/3
Existence of quantifiable financial inclusion targets3/3
Existence of a recent demand-side financial services survey conducted or supported by a government entity3/3
Existence of a dedicated financial inclusion body within the public sector3/3
Existence of a consumer protection framework regarding financial services3/3
Mobile Capacity94%
Market penetration with respect to unique subscribers3/3
3G mobile coverage by population3/3
Smartphone adoption2/3
Availability of bill payments via mobile money services3/3
Availability of international remittances via mobile money services3/3
Availability of merchant payments via mobile money services3/3
Regulatory Environment100%
Agent banking3/3
Inclusive ecosystem for mobile financial service deployment principals3/3
E-money regulations3/3
Mobile money platform interoperability3/3
Account access and usage3/3
Cash-in/cash-out at agent locations3/3
Adoption42%
Formal financial institution account penetration among lower-income adults1/3
Formal financial institution account penetration among women2/3
Borrowing from a financial institution2/3
Saving at a financial institution2/3
Debit card use1/3
Credit card use1/3
Percentage of adults utilizing online bill payments and purchases1/3
Mobile money account penetration among lower-income adults1/3
Mobile money account penetration among women1/3
Mobile phone used to receive salary or wages (among recent wage-earners)1/3
Mobile phone used to make utility payments (among adults regularly making utility bill payments)1/3
Frequency of account usage1/3
-
 Rwanda76%948310050Close Rwanda
Score: 76%
Adult Population: 6.8 Million
GDP: $8 Billion USD
Click on the arrows by each indicator title to view a detailed indicator scoring guide. Note that certain indicators are scored out of 1 or 3, while others are scored out of 1, 2, or 3. To compare multiple countries’ scores, scroll down and click on another country’s name or dimension score. To learn more about the FDIP scores and view relevant citations, please read the 2016 report.
Country Commitment94%
National-level participation in international financial inclusion-oriented organizations or networks3/3
Existence of a national financial inclusion strategy3/3
Existence of quantifiable financial inclusion targets3/3
Existence of a recent demand-side financial services survey conducted or supported by a government entity3/3
Existence of a dedicated financial inclusion body within the public sector3/3
Existence of a consumer protection framework regarding financial services2/3
Mobile Capacity83%
Market penetration with respect to unique subscribers2/3
3G mobile coverage by population3/3
Smartphone adoption1/3
Availability of bill payments via mobile money services3/3
Availability of international remittances via mobile money services3/3
Availability of merchant payments via mobile money services3/3
Regulatory Environment100%
Agent banking3/3
Inclusive ecosystem for mobile financial service deployment principals3/3
E-money regulations3/3
Mobile money platform interoperability3/3
Account access and usage3/3
Cash-in/cash-out at agent locations3/3
Adoption50%
Formal financial institution account penetration among lower-income adults1/3
Formal financial institution account penetration among women2/3
Borrowing from a financial institution2/3
Saving at a financial institution3/3
Debit card use1/3
Credit card use1/3
Percentage of adults utilizing online bill payments and purchases1/3
Mobile money account penetration among lower-income adults1/3
Mobile money account penetration among women1/3
Mobile phone used to receive salary or wages (among recent wage-earners)1/3
Mobile phone used to make utility payments (among adults regularly making utility bill payments)2/3
Frequency of account usage2/3
-
 Chile74%89726175Close Chile
Score: 74%
Adult Population: 14.3 Million
GDP: $241 Billion USD
Click on the arrows by each indicator title to view a detailed indicator scoring guide. Note that certain indicators are scored out of 1 or 3, while others are scored out of 1, 2, or 3. To compare multiple countries’ scores, scroll down and click on another country’s name or dimension score. To learn more about the FDIP scores and view relevant citations, please read the 2016 report.
Country Commitment89%
National-level participation in international financial inclusion-oriented organizations or networks3/3
Existence of a national financial inclusion strategy3/3
Existence of quantifiable financial inclusion targets1/3
Existence of a recent demand-side financial services survey conducted or supported by a government entity3/3
Existence of a dedicated financial inclusion body within the public sector3/3
Existence of a consumer protection framework regarding financial services3/3
Mobile Capacity72%
Market penetration with respect to unique subscribers3/3
3G mobile coverage by population3/3
Smartphone adoption2/3
Availability of bill payments via mobile money services3/3
Availability of international remittances via mobile money services1/3
Availability of merchant payments via mobile money services1/3
Regulatory Environment61%
Agent banking3/3
Inclusive ecosystem for mobile financial service deployment principals1/3
E-money regulations1/3
Mobile money platform interoperability1/3
Account access and usage3/3
Cash-in/cash-out at agent locations2/3
Adoption75%
Formal financial institution account penetration among lower-income adults3/3
Formal financial institution account penetration among women3/3
Borrowing from a financial institution3/3
Saving at a financial institution2/3
Debit card use3/3
Credit card use3/3
Percentage of adults utilizing online bill payments and purchases3/3
Mobile money account penetration among lower-income adults1/3
Mobile money account penetration among women1/3
Mobile phone used to receive salary or wages (among recent wage-earners)1/3
Mobile phone used to make utility payments (among adults regularly making utility bill payments)1/3
Frequency of account usage3/3
-
 Nigeria74%94838953Close Nigeria
Score: 74%
Adult Population: 102.1 Million
GDP: $487 Billion USD
Click on the arrows by each indicator title to view a detailed indicator scoring guide. Note that certain indicators are scored out of 1 or 3, while others are scored out of 1, 2, or 3. To compare multiple countries’ scores, scroll down and click on another country’s name or dimension score. To learn more about the FDIP scores and view relevant citations, please read the 2016 report.
Country Commitment94%
National-level participation in international financial inclusion-oriented organizations or networks3/3
Existence of a national financial inclusion strategy3/3
Existence of quantifiable financial inclusion targets3/3
Existence of a recent demand-side financial services survey conducted or supported by a government entity3/3
Existence of a dedicated financial inclusion body within the public sector3/3
Existence of a consumer protection framework regarding financial services2/3
Mobile Capacity83%
Market penetration with respect to unique subscribers2/3
3G mobile coverage by population3/3
Smartphone adoption1/3
Availability of bill payments via mobile money services3/3
Availability of international remittances via mobile money services3/3
Availability of merchant payments via mobile money services3/3
Regulatory Environment89%
Agent banking3/3
Inclusive ecosystem for mobile financial service deployment principals1/3
E-money regulations3/3
Mobile money platform interoperability3/3
Account access and usage3/3
Cash-in/cash-out at agent locations3/3
Adoption53%
Formal financial institution account penetration among lower-income adults2/3
Formal financial institution account penetration among women2/3
Borrowing from a financial institution1/3
Saving at a financial institution3/3
Debit card use2/3
Credit card use1/3
Percentage of adults utilizing online bill payments and purchases1/3
Mobile money account penetration among lower-income adults1/3
Mobile money account penetration among women1/3
Mobile phone used to receive salary or wages (among recent wage-earners)1/3
Mobile phone used to make utility payments (among adults regularly making utility bill payments)1/3
Frequency of account usage3/3
-
 Turkey73%89836764Close Turkey
Score: 73%
Adult Population: 58.5 Million
GDP: $718 Billion USD
Click on the arrows by each indicator title to view a detailed indicator scoring guide. Note that certain indicators are scored out of 1 or 3, while others are scored out of 1, 2, or 3. To compare multiple countries’ scores, scroll down and click on another country’s name or dimension score. To learn more about the FDIP scores and view relevant citations, please read the 2016 report.
Country Commitment89%
National-level participation in international financial inclusion-oriented organizations or networks3/3
Existence of a national financial inclusion strategy3/3
Existence of quantifiable financial inclusion targets1/3
Existence of a recent demand-side financial services survey conducted or supported by a government entity3/3
Existence of a dedicated financial inclusion body within the public sector3/3
Existence of a consumer protection framework regarding financial services3/3
Mobile Capacity83%
Market penetration with respect to unique subscribers2/3
3G mobile coverage by population3/3
Smartphone adoption3/3
Availability of bill payments via mobile money services3/3
Availability of international remittances via mobile money services1/3
Availability of merchant payments via mobile money services3/3
Regulatory Environment67%
Agent banking1/3
Inclusive ecosystem for mobile financial service deployment principals3/3
E-money regulations3/3
Mobile money platform interoperability1/3
Account access and usage1/3
Cash-in/cash-out at agent locations3/3
Adoption64%
Formal financial institution account penetration among lower-income adults3/3
Formal financial institution account penetration among women2/3
Borrowing from a financial institution3/3
Saving at a financial institution1/3
Debit card use2/3
Credit card use3/3
Percentage of adults utilizing online bill payments and purchases3/3
Mobile money account penetration among lower-income adults1/3
Mobile money account penetration among women1/3
Mobile phone used to receive salary or wages (among recent wage-earners)1/3
Mobile phone used to make utility payments (among adults regularly making utility bill payments)1/3
Frequency of account usage2/3
-
 India72%1007210044Close India
Score: 72%
Adult Population: 933.6 Million
GDP: $2,089 Billion USD
Click on the arrows by each indicator title to view a detailed indicator scoring guide. Note that certain indicators are scored out of 1 or 3, while others are scored out of 1, 2, or 3. To compare multiple countries’ scores, scroll down and click on another country’s name or dimension score. To learn more about the FDIP scores and view relevant citations, please read the 2016 report.
Country Commitment100%
National-level participation in international financial inclusion-oriented organizations or networks3/3
Existence of a national financial inclusion strategy3/3
Existence of quantifiable financial inclusion targets3/3
Existence of a recent demand-side financial services survey conducted or supported by a government entity3/3
Existence of a dedicated financial inclusion body within the public sector3/3
Existence of a consumer protection framework regarding financial services3/3
Mobile Capacity72%
Market penetration with respect to unique subscribers2/3
3G mobile coverage by population3/3
Smartphone adoption1/3
Availability of bill payments via mobile money services3/3
Availability of international remittances via mobile money services1/3
Availability of merchant payments via mobile money services3/3
Regulatory Environment100%
Agent banking3/3
Inclusive ecosystem for mobile financial service deployment principals3/3
E-money regulations3/3
Mobile money platform interoperability3/3
Account access and usage3/3
Cash-in/cash-out at agent locations3/3
Adoption44%
Formal financial institution account penetration among lower-income adults3/3
Formal financial institution account penetration among women2/3
Borrowing from a financial institution1/3
Saving at a financial institution2/3
Debit card use1/3
Credit card use1/3
Percentage of adults utilizing online bill payments and purchases1/3
Mobile money account penetration among lower-income adults1/3
Mobile money account penetration among women1/3
Mobile phone used to receive salary or wages (among recent wage-earners)1/3
Mobile phone used to make utility payments (among adults regularly making utility bill payments)1/3
Frequency of account usage1/3
-
 Peru72%1007210044Close Peru
Score: 72%
Adult Population: 22.6 Million
GDP: $189 Billion USD
Click on the arrows by each indicator title to view a detailed indicator scoring guide. Note that certain indicators are scored out of 1 or 3, while others are scored out of 1, 2, or 3. To compare multiple countries’ scores, scroll down and click on another country’s name or dimension score. To learn more about the FDIP scores and view relevant citations, please read the 2016 report.
Country Commitment100%
National-level participation in international financial inclusion-oriented organizations or networks3/3
Existence of a national financial inclusion strategy3/3
Existence of quantifiable financial inclusion targets3/3
Existence of a recent demand-side financial services survey conducted or supported by a government entity3/3
Existence of a dedicated financial inclusion body within the public sector3/3
Existence of a consumer protection framework regarding financial services3/3
Mobile Capacity72%
Market penetration with respect to unique subscribers3/3
3G mobile coverage by population3/3
Smartphone adoption2/3
Availability of bill payments via mobile money services1/3
Availability of international remittances via mobile money services1/3
Availability of merchant payments via mobile money services3/3
Regulatory Environment100%
Agent banking3/3
Inclusive ecosystem for mobile financial service deployment principals3/3
E-money regulations3/3
Mobile money platform interoperability3/3
Account access and usage3/3
Cash-in/cash-out at agent locations3/3
Adoption44%
Formal financial institution account penetration among lower-income adults1/3
Formal financial institution account penetration among women1/3
Borrowing from a financial institution2/3
Saving at a financial institution1/3
Debit card use1/3
Credit card use2/3
Percentage of adults utilizing online bill payments and purchases1/3
Mobile money account penetration among lower-income adults1/3
Mobile money account penetration among women1/3
Mobile phone used to receive salary or wages (among recent wage-earners)1/3
Mobile phone used to make utility payments (among adults regularly making utility bill payments)1/3
Frequency of account usage3/3
-
 Indonesia71%72949447Close Indonesia
Score: 71%
Adult Population: 186.2 Million
GDP: $862 Billion USD
Click on the arrows by each indicator title to view a detailed indicator scoring guide. Note that certain indicators are scored out of 1 or 3, while others are scored out of 1, 2, or 3. To compare multiple countries’ scores, scroll down and click on another country’s name or dimension score. To learn more about the FDIP scores and view relevant citations, please read the 2016 report.
Country Commitment72%
National-level participation in international financial inclusion-oriented organizations or networks3/3
Existence of a national financial inclusion strategy3/3
Existence of quantifiable financial inclusion targets1/3
Existence of a recent demand-side financial services survey conducted or supported by a government entity1/3
Existence of a dedicated financial inclusion body within the public sector2/3
Existence of a consumer protection framework regarding financial services3/3
Mobile Capacity94%
Market penetration with respect to unique subscribers3/3
3G mobile coverage by population3/3
Smartphone adoption2/3
Availability of bill payments via mobile money services3/3
Availability of international remittances via mobile money services3/3
Availability of merchant payments via mobile money services3/3
Regulatory Environment94%
Agent banking3/3
Inclusive ecosystem for mobile financial service deployment principals3/3
E-money regulations3/3
Mobile money platform interoperability3/3
Account access and usage3/3
Cash-in/cash-out at agent locations2/3
Adoption47%
Formal financial institution account penetration among lower-income adults1/3
Formal financial institution account penetration among women2/3
Borrowing from a financial institution2/3
Saving at a financial institution3/3
Debit card use1/3
Credit card use1/3
Percentage of adults utilizing online bill payments and purchases1/3
Mobile money account penetration among lower-income adults1/3
Mobile money account penetration among women1/3
Mobile phone used to receive salary or wages (among recent wage-earners)1/3
Mobile phone used to make utility payments (among adults regularly making utility bill payments)1/3
Frequency of account usage2/3
-
 El Salvador69%72948347Close El Salvador
Score: 69%
Adult Population: 4.5 Million
GDP: $26 Billion USD
Click on the arrows by each indicator title to view a detailed indicator scoring guide. Note that certain indicators are scored out of 1 or 3, while others are scored out of 1, 2, or 3. To compare multiple countries’ scores, scroll down and click on another country’s name or dimension score. To learn more about the FDIP scores and view relevant citations, please read the 2016 report.
Country Commitment72%
National-level participation in international financial inclusion-oriented organizations or networks3/3
Existence of a national financial inclusion strategy3/3
Existence of quantifiable financial inclusion targets1/3
Existence of a recent demand-side financial services survey conducted or supported by a government entity1/3
Existence of a dedicated financial inclusion body within the public sector3/3
Existence of a consumer protection framework regarding financial services2/3
Mobile Capacity94%
Market penetration with respect to unique subscribers3/3
3G mobile coverage by population3/3
Smartphone adoption2/3
Availability of bill payments via mobile money services3/3
Availability of international remittances via mobile money services3/3
Availability of merchant payments via mobile money services3/3
Regulatory Environment83%
Agent banking3/3
Inclusive ecosystem for mobile financial service deployment principals3/3
E-money regulations3/3
Mobile money platform interoperability2/3
Account access and usage1/3
Cash-in/cash-out at agent locations3/3
Adoption47%
Formal financial institution account penetration among lower-income adults1/3
Formal financial institution account penetration among women2/3
Borrowing from a financial institution3/3
Saving at a financial institution2/3
Debit card use1/3
Credit card use1/3
Percentage of adults utilizing online bill payments and purchases1/3
Mobile money account penetration among lower-income adults1/3
Mobile money account penetration among women1/3
Mobile phone used to receive salary or wages (among recent wage-earners)1/3
Mobile phone used to make utility payments (among adults regularly making utility bill payments)1/3
Frequency of account usage2/3
-
 Pakistan69%100838936Close Pakistan
Score: 69%
Adult Population: 122.8 Million
GDP: $271 Billion USD
Click on the arrows by each indicator title to view a detailed indicator scoring guide. Note that certain indicators are scored out of 1 or 3, while others are scored out of 1, 2, or 3. To compare multiple countries’ scores, scroll down and click on another country’s name or dimension score. To learn more about the FDIP scores and view relevant citations, please read the 2016 report.
Country Commitment100%
National-level participation in international financial inclusion-oriented organizations or networks3/3
Existence of a national financial inclusion strategy3/3
Existence of quantifiable financial inclusion targets3/3
Existence of a recent demand-side financial services survey conducted or supported by a government entity3/3
Existence of a dedicated financial inclusion body within the public sector3/3
Existence of a consumer protection framework regarding financial services3/3
Mobile Capacity83%
Market penetration with respect to unique subscribers2/3
3G mobile coverage by population3/3
Smartphone adoption1/3
Availability of bill payments via mobile money services3/3
Availability of international remittances via mobile money services3/3
Availability of merchant payments via mobile money services3/3
Regulatory Environment89%
Agent banking3/3
Inclusive ecosystem for mobile financial service deployment principals1/3
E-money regulations3/3
Mobile money platform interoperability3/3
Account access and usage3/3
Cash-in/cash-out at agent locations3/3
Adoption36%
Formal financial institution account penetration among lower-income adults1/3
Formal financial institution account penetration among women1/3
Borrowing from a financial institution1/3
Saving at a financial institution1/3
Debit card use1/3
Credit card use1/3
Percentage of adults utilizing online bill payments and purchases1/3
Mobile money account penetration among lower-income adults1/3
Mobile money account penetration among women1/3
Mobile phone used to receive salary or wages (among recent wage-earners)1/3
Mobile phone used to make utility payments (among adults regularly making utility bill payments)1/3
Frequency of account usage2/3
-
 Tanzania68%94728942Close Tanzania
Score: 68%
Adult Population: 29.3 Million
GDP: $46 Billion USD
Click on the arrows by each indicator title to view a detailed indicator scoring guide. Note that certain indicators are scored out of 1 or 3, while others are scored out of 1, 2, or 3. To compare multiple countries’ scores, scroll down and click on another country’s name or dimension score. To learn more about the FDIP scores and view relevant citations, please read the 2016 report.
Country Commitment94%
National-level participation in international financial inclusion-oriented organizations or networks3/3
Existence of a national financial inclusion strategy3/3
Existence of quantifiable financial inclusion targets3/3
Existence of a recent demand-side financial services survey conducted or supported by a government entity3/3
Existence of a dedicated financial inclusion body within the public sector3/3
Existence of a consumer protection framework regarding financial services2/3
Mobile Capacity72%
Market penetration with respect to unique subscribers2/3
3G mobile coverage by population1/3
Smartphone adoption1/3
Availability of bill payments via mobile money services3/3
Availability of international remittances via mobile money services3/3
Availability of merchant payments via mobile money services3/3
Regulatory Environment89%
Agent banking3/3
Inclusive ecosystem for mobile financial service deployment principals3/3
E-money regulations3/3
Mobile money platform interoperability3/3
Account access and usage1/3
Cash-in/cash-out at agent locations3/3
Adoption42%
Formal financial institution account penetration among lower-income adults1/3
Formal financial institution account penetration among women1/3
Borrowing from a financial institution1/3
Saving at a financial institution1/3
Debit card use1/3
Credit card use1/3
Percentage of adults utilizing online bill payments and purchases1/3
Mobile money account penetration among lower-income adults1/3
Mobile money account penetration among women2/3
Mobile phone used to receive salary or wages (among recent wage-earners)1/3
Mobile phone used to make utility payments (among adults regularly making utility bill payments)2/3
Frequency of account usage2/3
-
 Zambia67%94787842Close Zambia
Score: 67%
Adult Population: 8.8 Million
GDP: $21 Billion USD
Click on the arrows by each indicator title to view a detailed indicator scoring guide. Note that certain indicators are scored out of 1 or 3, while others are scored out of 1, 2, or 3. To compare multiple countries’ scores, scroll down and click on another country’s name or dimension score. To learn more about the FDIP scores and view relevant citations, please read the 2016 report.
Country Commitment94%
National-level participation in international financial inclusion-oriented organizations or networks3/3
Existence of a national financial inclusion strategy2/3
Existence of quantifiable financial inclusion targets3/3
Existence of a recent demand-side financial services survey conducted or supported by a government entity3/3
Existence of a dedicated financial inclusion body within the public sector3/3
Existence of a consumer protection framework regarding financial services3/3
Mobile Capacity78%
Market penetration with respect to unique subscribers2/3
3G mobile coverage by population2/3
Smartphone adoption1/3
Availability of bill payments via mobile money services3/3
Availability of international remittances via mobile money services3/3
Availability of merchant payments via mobile money services3/3
Regulatory Environment78%
Agent banking3/3
Inclusive ecosystem for mobile financial service deployment principals3/3
E-money regulations3/3
Mobile money platform interoperability1/3
Account access and usage1/3
Cash-in/cash-out at agent locations3/3
Adoption42%
Formal financial institution account penetration among lower-income adults1/3
Formal financial institution account penetration among women2/3
Borrowing from a financial institution1/3
Saving at a financial institution2/3
Debit card use1/3
Credit card use1/3
Percentage of adults utilizing online bill payments and purchases1/3
Mobile money account penetration among lower-income adults1/3
Mobile money account penetration among women1/3
Mobile phone used to receive salary or wages (among recent wage-earners)1/3
Mobile phone used to make utility payments (among adults regularly making utility bill payments)1/3
Frequency of account usage2/3
-
 Bangladesh66%89837839Close Bangladesh
Score: 66%
Adult Population: 113.6 Million
GDP: $195 Billion USD
Click on the arrows by each indicator title to view a detailed indicator scoring guide. Note that certain indicators are scored out of 1 or 3, while others are scored out of 1, 2, or 3. To compare multiple countries’ scores, scroll down and click on another country’s name or dimension score. To learn more about the FDIP scores and view relevant citations, please read the 2016 report.
Country Commitment89%
National-level participation in international financial inclusion-oriented organizations or networks3/3
Existence of a national financial inclusion strategy2/3
Existence of quantifiable financial inclusion targets3/3
Existence of a recent demand-side financial services survey conducted or supported by a government entity3/3
Existence of a dedicated financial inclusion body within the public sector3/3
Existence of a consumer protection framework regarding financial services2/3
Mobile Capacity83%
Market penetration with respect to unique subscribers2/3
3G mobile coverage by population3/3
Smartphone adoption1/3
Availability of bill payments via mobile money services3/3
Availability of international remittances via mobile money services3/3
Availability of merchant payments via mobile money services3/3
Regulatory Environment78%
Agent banking3/3
Inclusive ecosystem for mobile financial service deployment principals1/3
E-money regulations3/3
Mobile money platform interoperability1/3
Account access and usage3/3
Cash-in/cash-out at agent locations3/3
Adoption39%
Formal financial institution account penetration among lower-income adults1/3
Formal financial institution account penetration among women2/3
Borrowing from a financial institution2/3
Saving at a financial institution1/3
Debit card use1/3
Credit card use1/3
Percentage of adults utilizing online bill payments and purchases1/3
Mobile money account penetration among lower-income adults1/3
Mobile money account penetration among women1/3
Mobile phone used to receive salary or wages (among recent wage-earners)1/3
Mobile phone used to make utility payments (among adults regularly making utility bill payments)1/3
Frequency of account usage1/3
-
 Dominican Rep.64%72785658Close Dominican Rep.
Score: 64%
Adult Population: 7.4 Million
GDP: $68 Billion USD
Click on the arrows by each indicator title to view a detailed indicator scoring guide. Note that certain indicators are scored out of 1 or 3, while others are scored out of 1, 2, or 3. To compare multiple countries’ scores, scroll down and click on another country’s name or dimension score. To learn more about the FDIP scores and view relevant citations, please read the 2016 report.
Country Commitment72%
National-level participation in international financial inclusion-oriented organizations or networks3/3
Existence of a national financial inclusion strategy2/3
Existence of quantifiable financial inclusion targets1/3
Existence of a recent demand-side financial services survey conducted or supported by a government entity3/3
Existence of a dedicated financial inclusion body within the public sector1/3
Existence of a consumer protection framework regarding financial services3/3
Mobile Capacity78%
Market penetration with respect to unique subscribers2/3
3G mobile coverage by population3/3
Smartphone adoption2/3
Availability of bill payments via mobile money services3/3
Availability of international remittances via mobile money services1/3
Availability of merchant payments via mobile money services3/3
Regulatory Environment56%
Agent banking3/3
Inclusive ecosystem for mobile financial service deployment principals1/3
E-money regulations1/3
Mobile money platform interoperability1/3
Account access and usage1/3
Cash-in/cash-out at agent locations3/3
Adoption58%
Formal financial institution account penetration among lower-income adults3/3
Formal financial institution account penetration among women3/3
Borrowing from a financial institution3/3
Saving at a financial institution3/3
Debit card use1/3
Credit card use1/3
Percentage of adults utilizing online bill payments and purchases1/3
Mobile money account penetration among lower-income adults1/3
Mobile money account penetration among women1/3
Mobile phone used to receive salary or wages (among recent wage-earners)1/3
Mobile phone used to make utility payments (among adults regularly making utility bill payments)1/3
Frequency of account usage2/3
-
 Vietnam64%72836750Close Vietnam
Score: 64%
Adult Population: 70.5 Million
GDP: $194 Billion USD
Click on the arrows by each indicator title to view a detailed indicator scoring guide. Note that certain indicators are scored out of 1 or 3, while others are scored out of 1, 2, or 3. To compare multiple countries’ scores, scroll down and click on another country’s name or dimension score. To learn more about the FDIP scores and view relevant citations, please read the 2016 report.
Country Commitment72%
National-level participation in international financial inclusion-oriented organizations or networks3/3
Existence of a national financial inclusion strategy1/3
Existence of quantifiable financial inclusion targets3/3
Existence of a recent demand-side financial services survey conducted or supported by a government entity3/3
Existence of a dedicated financial inclusion body within the public sector1/3
Existence of a consumer protection framework regarding financial services2/3
Mobile Capacity83%
Market penetration with respect to unique subscribers3/3
3G mobile coverage by population3/3
Smartphone adoption2/3
Availability of bill payments via mobile money services3/3
Availability of international remittances via mobile money services1/3
Availability of merchant payments via mobile money services3/3
Regulatory Environment67%
Agent banking1/3
Inclusive ecosystem for mobile financial service deployment principals1/3
E-money regulations3/3
Mobile money platform interoperability1/3
Account access and usage3/3
Cash-in/cash-out at agent locations3/3
Adoption50%
Formal financial institution account penetration among lower-income adults1/3
Formal financial institution account penetration among women2/3
Borrowing from a financial institution3/3
Saving at a financial institution2/3
Debit card use1/3
Credit card use1/3
Percentage of adults utilizing online bill payments and purchases2/3
Mobile money account penetration among lower-income adults1/3
Mobile money account penetration among women1/3
Mobile phone used to receive salary or wages (among recent wage-earners)1/3
Mobile phone used to make utility payments (among adults regularly making utility bill payments)1/3
Frequency of account usage2/3
-
 Malawi61%83678336Close Malawi
Score: 61%
Adult Population: 9.4 Million
GDP: $6 Billion USD
Click on the arrows by each indicator title to view a detailed indicator scoring guide. Note that certain indicators are scored out of 1 or 3, while others are scored out of 1, 2, or 3. To compare multiple countries’ scores, scroll down and click on another country’s name or dimension score. To learn more about the FDIP scores and view relevant citations, please read the 2016 report.
Country Commitment83%
National-level participation in international financial inclusion-oriented organizations or networks3/3
Existence of a national financial inclusion strategy3/3
Existence of quantifiable financial inclusion targets3/3
Existence of a recent demand-side financial services survey conducted or supported by a government entity3/3
Existence of a dedicated financial inclusion body within the public sector1/3
Existence of a consumer protection framework regarding financial services2/3
Mobile Capacity67%
Market penetration with respect to unique subscribers1/3
3G mobile coverage by population1/3
Smartphone adoption1/3
Availability of bill payments via mobile money services3/3
Availability of international remittances via mobile money services3/3
Availability of merchant payments via mobile money services3/3
Regulatory Environment83%
Agent banking3/3
Inclusive ecosystem for mobile financial service deployment principals3/3
E-money regulations3/3
Mobile money platform interoperability2/3
Account access and usage1/3
Cash-in/cash-out at agent locations3/3
Adoption36%
Formal financial institution account penetration among lower-income adults1/3
Formal financial institution account penetration among women1/3
Borrowing from a financial institution1/3
Saving at a financial institution1/3
Debit card use1/3
Credit card use1/3
Percentage of adults utilizing online bill payments and purchases1/3
Mobile money account penetration among lower-income adults1/3
Mobile money account penetration among women1/3
Mobile phone used to receive salary or wages (among recent wage-earners)1/3
Mobile phone used to make utility payments (among adults regularly making utility bill payments)1/3
Frequency of account usage2/3
-
 Afghanistan60%61897836Close Afghanistan
Score: 60%
Adult Population: 18.2 Million
GDP: $19 Billion USD
Click on the arrows by each indicator title to view a detailed indicator scoring guide. Note that certain indicators are scored out of 1 or 3, while others are scored out of 1, 2, or 3. To compare multiple countries’ scores, scroll down and click on another country’s name or dimension score. To learn more about the FDIP scores and view relevant citations, please read the 2016 report.
Country Commitment61%
National-level participation in international financial inclusion-oriented organizations or networks3/3
Existence of a national financial inclusion strategy2/3
Existence of quantifiable financial inclusion targets1/3
Existence of a recent demand-side financial services survey conducted or supported by a government entity1/3
Existence of a dedicated financial inclusion body within the public sector3/3
Existence of a consumer protection framework regarding financial services1/3
Mobile Capacity89%
Market penetration with respect to unique subscribers2/3
3G mobile coverage by population3/3
Smartphone adoption2/3
Availability of bill payments via mobile money services3/3
Availability of international remittances via mobile money services3/3
Availability of merchant payments via mobile money services3/3
Regulatory Environment78%
Agent banking1/3
Inclusive ecosystem for mobile financial service deployment principals3/3
E-money regulations3/3
Mobile money platform interoperability3/3
Account access and usage1/3
Cash-in/cash-out at agent locations3/3
Adoption36%
Formal financial institution account penetration among lower-income adults1/3
Formal financial institution account penetration among women1/3
Borrowing from a financial institution1/3
Saving at a financial institution1/3
Debit card use1/3
Credit card use1/3
Percentage of adults utilizing online bill payments and purchases1/3
Mobile money account penetration among lower-income adults1/3
Mobile money account penetration among women1/3
Mobile phone used to receive salary or wages (among recent wage-earners)1/3
Mobile phone used to make utility payments (among adults regularly making utility bill payments)1/3
Frequency of account usage2/3
-
 Haiti60%72727242Close Haiti
Score: 60%
Adult Population: 7.1 Million
GDP: $9 Billion USD
Click on the arrows by each indicator title to view a detailed indicator scoring guide. Note that certain indicators are scored out of 1 or 3, while others are scored out of 1, 2, or 3. To compare multiple countries’ scores, scroll down and click on another country’s name or dimension score. To learn more about the FDIP scores and view relevant citations, please read the 2016 report.
Country Commitment72%
National-level participation in international financial inclusion-oriented organizations or networks3/3
Existence of a national financial inclusion strategy3/3
Existence of quantifiable financial inclusion targets3/3
Existence of a recent demand-side financial services survey conducted or supported by a government entity1/3
Existence of a dedicated financial inclusion body within the public sector1/3
Existence of a consumer protection framework regarding financial services2/3
Mobile Capacity72%
Market penetration with respect to unique subscribers2/3
3G mobile coverage by population3/3
Smartphone adoption1/3
Availability of bill payments via mobile money services3/3
Availability of international remittances via mobile money services1/3
Availability of merchant payments via mobile money services3/3
Regulatory Environment72%
Agent banking3/3
Inclusive ecosystem for mobile financial service deployment principals1/3
E-money regulations3/3
Mobile money platform interoperability2/3
Account access and usage1/3
Cash-in/cash-out at agent locations3/3
Adoption42%
Formal financial institution account penetration among lower-income adults1/3
Formal financial institution account penetration among women1/3
Borrowing from a financial institution3/3
Saving at a financial institution1/3
Debit card use1/3
Credit card use1/3
Percentage of adults utilizing online bill payments and purchases1/3
Mobile money account penetration among lower-income adults1/3
Mobile money account penetration among women1/3
Mobile phone used to receive salary or wages (among recent wage-earners)1/3
Mobile phone used to make utility payments (among adults regularly making utility bill payments)1/3
Frequency of account usage2/3
-
 Ethiopia54%67617236Close Ethiopia
Score: 54%
Adult Population: 58.2 Million
GDP: $62 Billion USD
Click on the arrows by each indicator title to view a detailed indicator scoring guide. Note that certain indicators are scored out of 1 or 3, while others are scored out of 1, 2, or 3. To compare multiple countries’ scores, scroll down and click on another country’s name or dimension score. To learn more about the FDIP scores and view relevant citations, please read the 2016 report.
Country Commitment67%
National-level participation in international financial inclusion-oriented organizations or networks3/3
Existence of a national financial inclusion strategy3/3
Existence of quantifiable financial inclusion targets1/3
Existence of a recent demand-side financial services survey conducted or supported by a government entity1/3
Existence of a dedicated financial inclusion body within the public sector3/3
Existence of a consumer protection framework regarding financial services1/3
Mobile Capacity61%
Market penetration with respect to unique subscribers2/3
3G mobile coverage by population1/3
Smartphone adoption1/3
Availability of bill payments via mobile money services3/3
Availability of international remittances via mobile money services1/3
Availability of merchant payments via mobile money services3/3
Regulatory Environment72%
Agent banking3/3
Inclusive ecosystem for mobile financial service deployment principals1/3
E-money regulations3/3
Mobile money platform interoperability2/3
Account access and usage1/3
Cash-in/cash-out at agent locations3/3
Adoption36%
Formal financial institution account penetration among lower-income adults1/3
Formal financial institution account penetration among women1/3
Borrowing from a financial institution1/3
Saving at a financial institution2/3
Debit card use1/3
Credit card use1/3
Percentage of adults utilizing online bill payments and purchases1/3
Mobile money account penetration among lower-income adults1/3
Mobile money account penetration among women1/3
Mobile phone used to receive salary or wages (among recent wage-earners)1/3
Mobile phone used to make utility payments (among adults regularly making utility bill payments)1/3
Frequency of account usage1/3
-
 Egypt53%61677233Close Egypt
Score: 53%
Adult Population: 61.2 Million
GDP: $331 Billion USD
Click on the arrows by each indicator title to view a detailed indicator scoring guide. Note that certain indicators are scored out of 1 or 3, while others are scored out of 1, 2, or 3. To compare multiple countries’ scores, scroll down and click on another country’s name or dimension score. To learn more about the FDIP scores and view relevant citations, please read the 2016 report.
Country Commitment61%
National-level participation in international financial inclusion-oriented organizations or networks3/3
Existence of a national financial inclusion strategy1/3
Existence of quantifiable financial inclusion targets1/3
Existence of a recent demand-side financial services survey conducted or supported by a government entity1/3
Existence of a dedicated financial inclusion body within the public sector3/3
Existence of a consumer protection framework regarding financial services2/3
Mobile Capacity67%
Market penetration with respect to unique subscribers2/3
3G mobile coverage by population3/3
Smartphone adoption2/3
Availability of bill payments via mobile money services3/3
Availability of international remittances via mobile money services1/3
Availability of merchant payments via mobile money services1/3
Regulatory Environment72%
Agent banking3/3
Inclusive ecosystem for mobile financial service deployment principals1/3
E-money regulations3/3
Mobile money platform interoperability3/3
Account access and usage1/3
Cash-in/cash-out at agent locations2/3
Adoption33%
Formal financial institution account penetration among lower-income adults1/3
Formal financial institution account penetration among women1/3
Borrowing from a financial institution1/3
Saving at a financial institution1/3
Debit card use1/3
Credit card use1/3
Percentage of adults utilizing online bill payments and purchases1/3
Mobile money account penetration among lower-income adults1/3
Mobile money account penetration among women1/3
Mobile phone used to receive salary or wages (among recent wage-earners)1/3
Mobile phone used to make utility payments (among adults regularly making utility bill payments)1/3
Frequency of account usage1/3
Authors


The Brookings Institution is committed to quality, independence, and impact.
We are supported by a diverse array of funders. In line with our values and policies, each Brookings publication represents the sole views of its author(s).