

State revenues have been rebounding for the last six quarters after experiencing a severe decline caused by the Great Recession that ran from December 2007 through June 2009. Nevertheless, tax collections remain below their 2008 peak level and state and local governments continue to shed jobs. As states prepare their fiscal year 2013 budgets, some are projecting a fifth consecutive year of gaps between expected revenues and spending. This policy brief analyzes recent developments in state government finances and prospects for the future. After an overview of state revenue sources and spending priorities, it discusses what happened in the Great Recession and how states and the federal government responded. The brief then considers challenges to states’ long term fiscal sustainability. The brief is organized into four key questions:
1. Where do state revenues come from and where does state spending go?
States draw most of their general revenue (66%) from taxes, service charges, and other sources such as special assessments, property sales, rents, and royalties. The remainder comes from intergovernmental grants. Most state general expenditures (72%) go toward education, public welfare (including Medicaid), health, and hospitals. Beyond these functional categories, states organize their activities according to funds, the largest of which (on average 45% of total spending) is the General Fund. In fiscal year 2009, elementary and secondary education was the largest category of General Fund spending (36%), followed by Medicaid (16%).
2. What happened during the Great Recession?
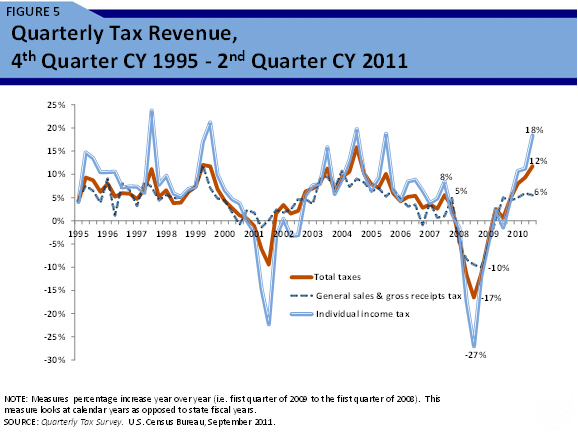
During the recession that began in December 2007, state revenues plummeted. By the second quarter of 2009, income tax collections were 27% below their level one year earlier and total state taxes were 17% lower. At the same time, spending demand continued or escalated, particularly for Medicaid. As a result, budget gaps opened in nearly every state, including several states that were forced to confront midyear shortfalls. The American Recovery and Reinvestment Act of 2009 (ARRA) appropriated nearly $145 billion to state and local governments for general fiscal relief, including $90 billion in enhanced federal Medicaid payments. However, these funds covered at most 40% of state budget gaps and are now nearly exhausted.
3. What is happening now?
Although the Great Recession officially ended in June 2009, the economy remains in a slump. Real annual GDP growth was just 1.3% in the second quarter of 2011, and the Congressional Budget Office projects it will stay under 3% through the end of 2012. Unemployment has hovered above 9% for 26 of the past 28 months. State tax revenues have been improving for six consecutive quarters, but state taxes remain 6% below their level three years earlier, or 11% lower after adjusting for inflation. Meanwhile, state and local property taxes have been falling for three consecutive quarters, consistent with a two to three year lag between declining home values and property tax rolls. These reductions coincide with state cutbacks in local aid, further squeezing local budgets.
4. What challenges lie ahead and what can states do?
Looking ahead, states will face challenges related to rising health care costs, aging populations, unfunded pensions and retiree health care liabilities. States could also be affected by changes made at the federal level to address the federal deficit. Some states have weathered the recession more easily than others thanks to rich natural resource endowments and diverse regional economies. Others have taken aggressive steps to close their budget gaps and to address long term structural imbalances. For example, more than half have appointed performance review or tax reform commissions. Some are considering institutional reforms, including longer forecasting horizons and multi-year budgeting. These steps may yield long term gains regardless of whether they help states to emerge from the current downturn.
1. Where do state revenues come from and where does state spending go?
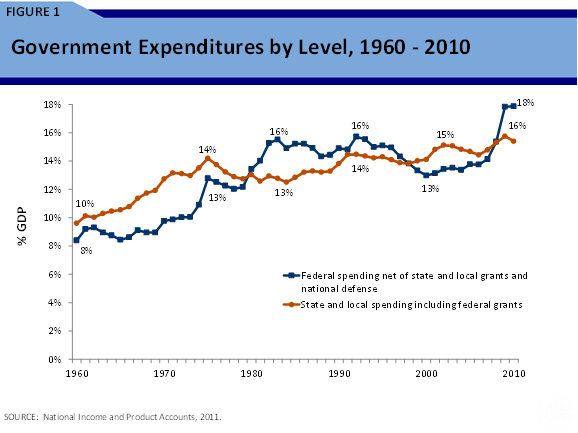
States are at the forefront of the U.S. public sector. Together with local governments, they undertake most spending on public goods and services – such as education, roads, and other infrastructure – that shape Americans’ economy and quality of life. In most years, states and localities outspend the federal government when national defense is excluded from totals and grants are assigned to the level of government where they are ultimately spent (Figure 1).
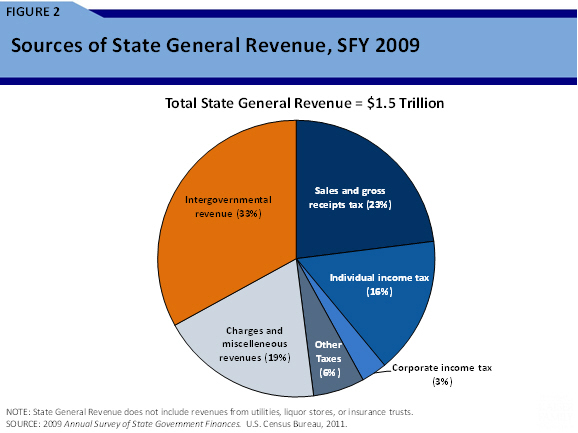
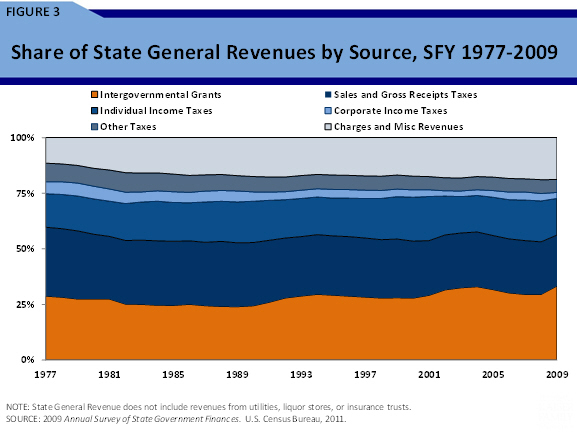
States draw most of their general revenue (66 percent) from taxes, service charges, and other miscellaneous sources such as special assessments, property sales, rents, and royalties. [i] The remainder comes from intergovernmental grants (Figure 2). These shares have remained fairly constant over the past thirty years, although the most recent data show an uptick in federal grants in response to the recession (Figure 3).
Beyond these national averages, states exhibit considerable variation as a result of differences in economic performance as well as underlying tax structure (Appendix Table 1). For example, in 2011, seven states (Alaska, Florida, Nevada, South Dakota, Texas, Washington, and Wyoming) did not levy an individual income tax. Four states (Nevada, Texas, Washington, and Wyoming) did not tax corporate income, and five (Alaska, Delaware, Montana, New Hampshire, and Oregon) did not tax general retail sales although they did tax specific goods such as alcohol and tobacco.
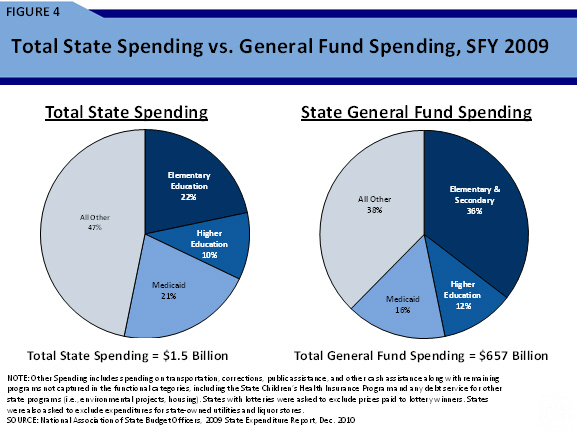
Most state general expenditures (72 percent) go toward education, public welfare (including Medicaid), health, and hospitals. These shares have also remained fairly stable over time. Beyond these functional categories, states organize their activities according to funds, the largest of which (typically representing 45 percent of total spending) and the one over which lawmakers exercise the most discretion is the General Fund. In fiscal year 2009, elementary and secondary education was the largest category of General Fund spending, followed by Medicaid (Figure 4).
As with taxes, state expenditures vary based on background characteristics, such as demographics and labor costs, as well as and policy choices made by each state in how they run their programs such as what level of services to provide and to how many people (Appendix Table 2).
2. What Happened During the Great Recession?
The recession that began in December 2007 dealt a major blow to state revenues. Both sales and income taxes began to drop in the fourth quarter of 2008, but income taxes ultimately fell harder (Figure 5). By the second quarter of 2009, individual income tax collections were 27 percent below their level one year earlier and total state taxes were 17 percent lower.
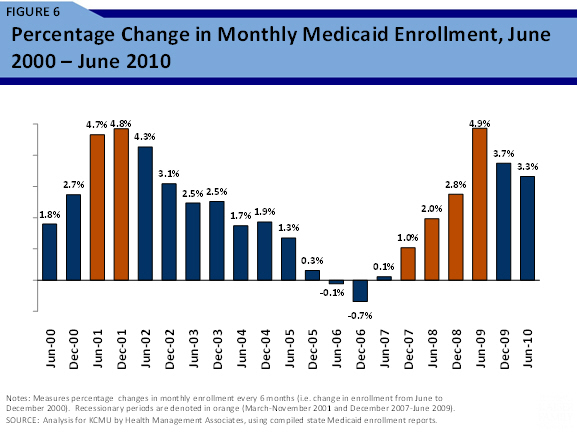
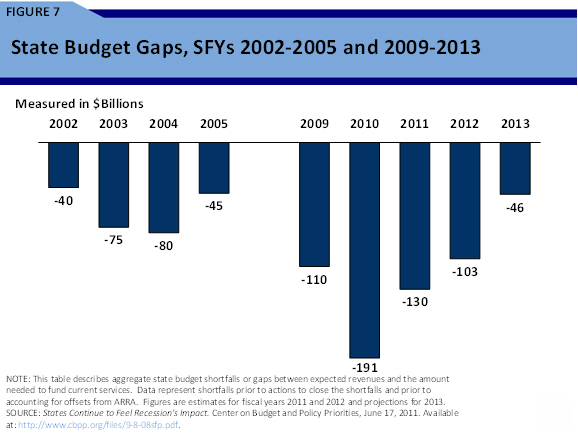
At the same time, spending demand continued or escalated. In particular, enrollments climbed in Medicaid and other social safety net programs as in previous recessions (Figure 6). As a result, budget gaps opened in nearly every state (Figure 7). A record number of states saw budget gaps open mid-year, necessitating new revenue increases or spending cuts beyond actions already taken.
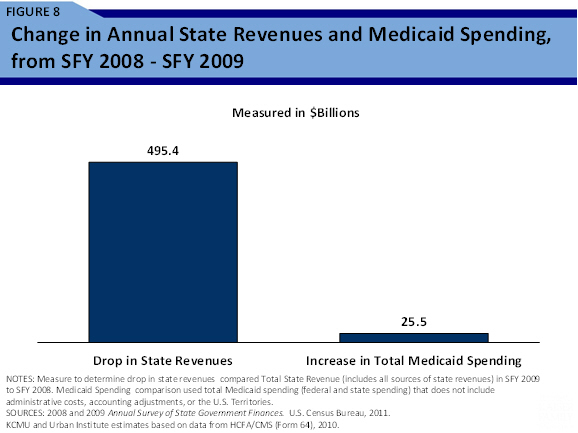
It is worth keeping in mind relative magnitudes here – total state revenues, including investment income as well as taxes, dropped by 30 percent ($495.4 billion across all states) in state fiscal year 2009 compared to total Medicaid spending increases of about 7.6 percent in that year ($25.5 billion across all states) (Figure 8).
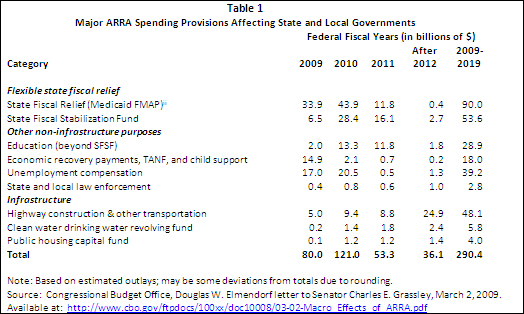
The American Recovery and Reinvestment Act of 2009 appropriated roughly $290 billion to state and local governments (Table 1). However, only about $145 billion of these funds were available for general fiscal relief, with the remainder going to aid individuals affected by the recession and to spur infrastructure investments. Fiscal relief funds covered at most 40 percent of state budget gaps and are now nearly exhausted.
Unlike the federal government, states are generally expected to balance their budgets annually. States closed their budget gaps mainly by reducing spending. Cuts fell mostly in areas where states concentrate their activities. According to the Center on Budget and Policy Priorities, states reduced expenditures on K-12 education (34 states and DC), on colleges and universities (43 states), on health care (31 states), on services to the elderly and disabled (29 states and DC), and on employee compensation (44 states and DC) since 2008.
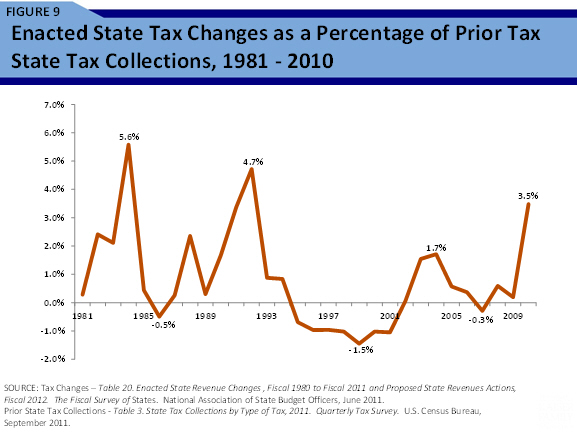
Some states also increased revenues. For example, New York and California raised income taxes on high earners, but these increases were temporary and have expired. Despite this recession’s magnitude, tax increases were smaller as a share of total taxes than in previous downturns (Figure 9). As in previous budget cycles, states also relied on temporary measures such as borrowing, fund shifts, deferred expenses, and asset sales.
3. What Is Happening Now?
Although the Great Recession officially ended in June 2009, the economy remains in a slump. Real annual GDP growth was just 1.3 percent in the second quarter of 2011, and the Congressional Budget Office projects it will stay under 3 percent through the end of 2012. Unemployment has hovered above 9 percent for 26 of the past 28 months.
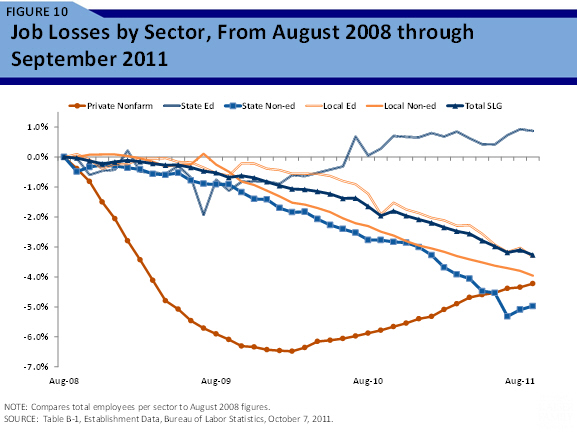
Although the private sector has been adding jobs since early 2010, state and local governments have been shedding them. State governments have cut 120,000 jobs since their peak in August 2008, while local governments have cut 527,000. Overall, state payrolls have declined by 2.3 percent and local by 3.6 percent (Figure 10).
On a more positive note, state tax revenues have been improving for six consecutive quarters. According to the U.S. Census Bureau, the second quarter of 2011 saw total taxes rise about 11 percent compared to one year earlier. Growth was particularly robust in individual and corporate income taxes (18 and 23 percent) compared to general sales taxes (6 percent), although it’s worth bearing in mind that these are very volatile revenue sources (Figure 5).
Moreover, state taxes remain 6 percent below their level three years earlier, or 11 percent lower after adjusting for inflation.[ii] Meanwhile, state and local property taxes have been falling for three consecutive quarters, consistent with a two to three year lag between declining home values and property tax rolls.[iii] These reductions coincide with state cutbacks in local aid, further squeezing local budgets.[iv]
4. What Challenges Lie Ahead and What Can States Do?
Looking ahead, states will face the same budget challenges as the federal government –rising health care costs and aging populations. In particular, unfunded pension and retiree health care liabilities have been variously estimated at $1 to $3 trillion depending on modeling assumptions.[v] Faced with its own fiscal challenges, the federal government will be seeking cuts to discretionary spending in the near term and possibly long range changes to the joint federal-state Medicaid program and provisions of the U.S. tax code benefiting state and local governments. Furthermore, the effects of federal health care reform on state budgets are uncertain.
Nevertheless, variation and innovation are hallmarks of the local public sector. Some states have weathered the recession more easily than others thanks to rich natural resource endowments and diverse regional economies. Others have taken aggressive steps to close their budget gaps and to address long term structural imbalances. For example, more than half have appointed performance review or tax reform commissions. Some are considering institutional reforms, including longer forecasting horizons and multi-year budgeting. Others are rethinking service delivery, including realigning programs and responsibilities to lower levels of government and engaging citizens in productive conversations about budget tradeoffs. These steps may yield long term gains regardless of whether they help states to emerge from the current downturn.
References:
Hoene, Christopher W. and Michael A. Pagano. “City Fiscal Conditions in 2011,” Research Brief on America’s Cities. Washington, DC: National League of Cities, September 2011.
Johnson, Nicholas, Phil Oliff and Erica Williams. An Update on State Budget Cuts: At Least 46 States Have Imposed Cuts That Hurt Vulnerable Residents and the Economy. Washington, DC: Center for Budget and Policy Priorities, February 9, 2011.
Kaiser Family Foundation. Medicaid Enrollment: June 2010 Data Snapshot. Washington, DC: 2011
Lutz, Byron. “The Connection Between House Price Appreciation and Property Tax Revenues,” National Tax Journal LXI(3), September 2008: 555-572.
McNichol, Elizabeth, Phil Oliff, and Nicholas Johnson. States Continue to Feel Recession’s Impact. Washington, DC: Center for Budget and Policy Priorities, June 17, 2011.
Novy-Marx, Robert, and Joshua Rauh. “Policy Options for State Pension Systems and Their Impact on Plan Liabilities,” Journal of Pension Economics and Finance 10(2) (2011): 173 – 194.
Pew Center on the States. The Widening Gap: The Great Recession’s Impact on State Pension and Retiree Health Care Costs. Washington, DC: Pew Center on the States, 2011.
U.S. Bureau of the Census. Annual Survey of State and Local Government Finances. Washington, DC: 2011.
U.S. Bureau of the Census. Quarterly Tax Survey. Washington, DC: 2011b.
U.S. Bureau of Economic Analysis. National Income and Product Accounts. Washington, DC: 2011.
U.S. Congressional Budget Office, Douglas W. Elmendorf letter to Senator Charles E. Grassley, March 2, 2009. U.S. Government Accountability Office. State and Local Governments’ Fiscal Outlook. Washington D.C.: April 2011. U.S. Office of Management and Budget. Historical Tables, Budget of the United States Government, Fiscal Year 2012. Washington, DC: 2011.
Endnotes
[i] “General revenue” is a category developed by the U.S. Census Bureau in its Census of Governments and Annual Survey of State and Local Government Finances. The Census Bureau distinguishes between four broad sectors of government activity: general government, utilities (water supply, electric power, gas supply, and transit), insurance trust systems (retirement, unemployment compensation, workers’ compensation, and disability), and liquor stores. In 2009, general revenues were $1.495 trillion and general expenditures were $1.554 trillion, compared to total revenues and expenditures of $1.124 and $1.827 trillion, respectively. The negative difference between total and general revenues reflects investment losses that insurant trust systems experienced that year.
[ii] Adjustment is based on state and local government consumption and gross investment implicit price deflator.
[iii] E.g., Lutz, 2008.
[iv] E.g., Hoene and Pagano, 2011
[v] E.g., Novy-Marx and Rauh, 2011; Pew Center on the States, 2011.
The Brookings Institution is committed to quality, independence, and impact.
We are supported by a diverse array of funders. In line with our values and policies, each Brookings publication represents the sole views of its author(s).