
What does a successful economy look like? Regular economic news coverage suggests that success is defined largely by growing U.S. Gross Domestic Product (GDP), expanding jobs, falling unemployment, and rising stock prices.
While those trends have been underway for the better part of a decade now, many Americans do not seem to feel that the economy is working well for them. That’s in part because those headline indicators bypass more salient measures of worker and family well-being, like standards of living and household incomes. It’s also because national figures paint with a broad brush our $19 trillion, 320 million-person economy, which varies dramatically across the diverse communities where Americans live their daily lives. The Metro Monitor aims to deepen understanding of economic success by broadening its definition, and measuring it at the regional scale. This year’s edition explores trends in growth, prosperity, and inclusion (including by race) for the 100 largest U.S. metro areas, both for the latest year of complete data (2016 to 2017), and across a decade period (2007 to 2017) that illuminates how metro economies are performing today compared to before the Great Recession.
Table of contents
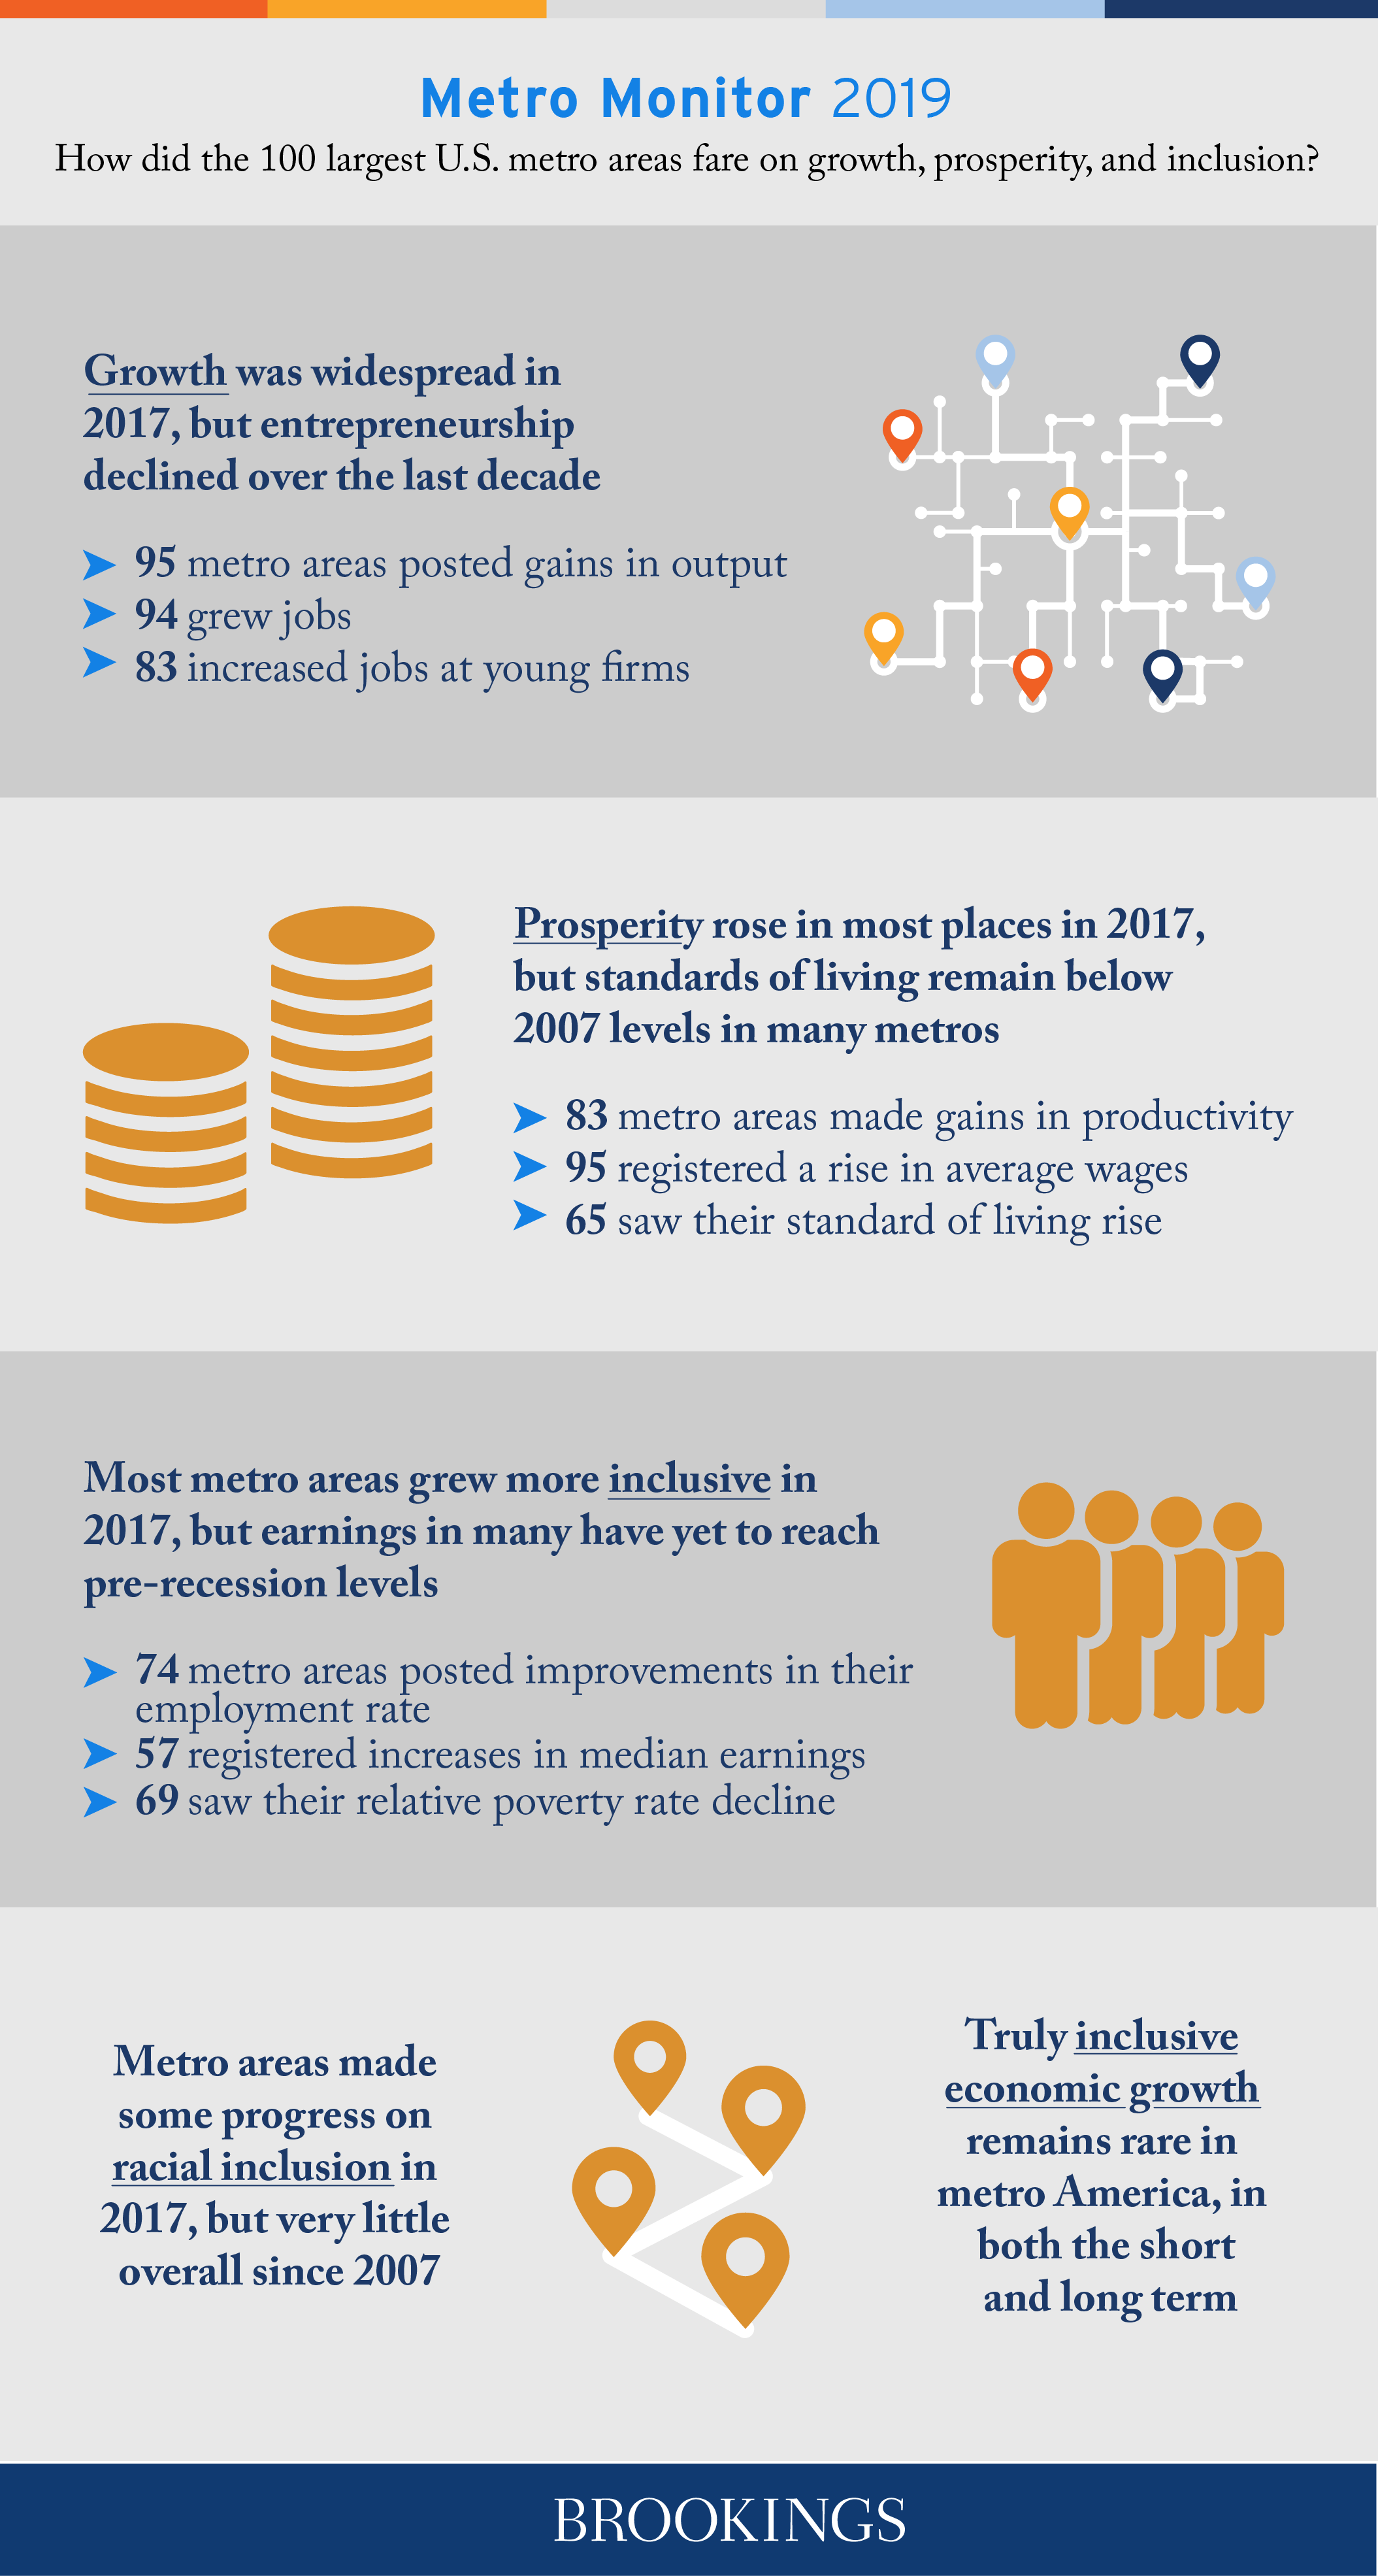
Growth was widespread in 2017 »
Prosperity rose in most places »
Most metro areas grew more inclusive »
Interactive by Alec Friedhoff.
Authors


The Brookings Institution is committed to quality, independence, and impact.
We are supported by a diverse array of funders. In line with our values and policies, each Brookings publication represents the sole views of its author(s).


