Introduction
India has been struck hard by the second wave of the COVID-19 pandemic—daily cases and deaths peaked at more than 400,000 cases and 4,000 deaths, respectively, almost four to five times higher than the peak number of cases and deaths in the first wave.1 The second wave was largely attributed to complacency by the Indian government.2 As important as this may have been, it is crucial to examine the role of the media during the pandemic. In particular, what were the discussion topics on the eve of the second wave, and was COVID-19 a fading topic of discussion when the tragedy struck? In this paper, we answer this question and discuss how inadequate media coverage may have slowed India’s COVID-19 response.
News media is an important institution in a democracy. It is instrumental in conveying information to people and drawing the government’s attention to issues of concern, and provides a platform for advocacy and criticism of policies of the government in power.3 In the context of a pandemic, the media’s role becomes even more significant: It can be a vital source to identify early outbreaks, and it can inform the public about non-pharmaceutical interventions (NPIs) like maintaining physical distance, hand hygiene, wearing a mask, etc. to contain the spread of the disease and limit its impact.4 Although NPIs and government-imposed travel restrictions can be burdensome—requiring significant alterations in human behavior, which is difficult to maintain over extended periods5—the media can ensure compliance with these important measures by educating the public on their effectiveness at fighting diseases and preventing additional outbreaks.
Furthermore, research on epidemics has shown a cyclical behavioral response with respect to the disease; that is, more disease leads to more demand for self-protection, in turn leading to less disease; however, this results in less self-protection, which then leads to more disease.6 Unfortunately, this implies that until a sufficiently large number of people are vaccinated or protected from the disease, an epidemic is likely to come in waves. Therefore, it becomes imperative for the media and the government to repeatedly, perhaps in a novel manner, convey messages to the public regarding NPIs to the public to lessen the impact of the disease, primarily when the prevalence of the disease is in a downward trend.
Related Content

This paper uses data from Twitter for 20 English-language media outlets across print, digital, and broadcasting and uses structural topic modeling (STM)7 to identify discussion topics and the evolution of these topics during the pandemic from March 2020 to April 2021. Our primary objective was to understand whether, on the eve of the second wave in India, topics related to COVID-19—in contrast to other topics of discussion, such as politics, protests, and entertainment—were a fading topic of discussion.
In the Indian context, this is the first paper to our knowledge that relies on Twitter data to look at the role of media during the pandemic using STM methods,8 a machine-assisted text reading tool. Our article complements the literature that has explored how mass media in post-independence India forced the Indian government to respond to threats of famine; as a result of this public pressure, India—despite its high level of poverty—has not had a large-scale famine post-independence.9 Moreover, research has also shown that state governments with a higher circulation of newspapers were more responsive to a decline in food production or damage caused to the crops by flooding.10 These papers highlight how media can draw government attention to issues of grave concern, especially for lower-income and historically disadvantaged groups and areas.
Data and Methodology
Our data consists of tweets posted by 20 English-language media outlets11 from March 1, 2020 through April 30, 2021. Twint, an advanced Twitter scraping tool written in Python, was used to scrape all the tweets posted by the media outlets for the given dates. A total of 1,253,531 tweets were downloaded, of which the media outlet TIMES NOW, with more than 10 million followers, accounted for 156,523 (12.5%) of the tweets (see table 1). The data include the date and time of the tweet, the name of the media outlet, the actual content of the tweet, and the number of the retweets, likes, and replies for each tweet.
Table 1: Summary table
| Media Outlet | Followers (in millions) | Total number of tweets | Sample for STM analysis |
| Overall | 81.59 | 1,253,531 | 125,606 |
| ANI | 5.7 | 85,612 (6.8%) | 8,579 (6.8%) |
| DD News | 3.2 | 23,411 (1.9%) | 2,347 (1.9%) |
| Deccan Herald | .07 | 70,103 (5.6%) | 7,025 (5.6%) |
| Hindustan Times | 8 | 145,150 (11.6%) | 14,544 (11.6%) |
| IndiaToday | 5.6 | 120,789 (9.6%) | 12,102 (9.6%) |
| NDTV | 15.4 | 86,074 (6.9%) | 8,620 (6.9%) |
| OpIndia.com | .6 | 26,917 (2.2%) | 2,696 (2.2%) |
| PIB India | 2.3 | 14,257 (1.1%) | 1,429 (1.1%) |
| Press Trust of India | 3.3 | 34,919 (2.8%) | 3,498 (2.8%) |
| Swarajya | .3 | 22,100 (1.8%) | 2,215 (1.8%) |
| TIMES NOW | 10 | 156,523 (12.5%) | 15,691 (12.5%) |
| The Hindu | 6.9 | 53,432 (4.3%) | 5,357 (4.3%) |
| The Indian Express | 3.8 | 66,071 (5.3%) | 6,617 (5.3%) |
| The Quint | .667 | 52,057 (4.2%) | 5,215 (4.2%) |
| The Telegraph | .3 | 19,115 (1.5%) | 1,914 (1.5%) |
| The Times Of India | 13.6 | 103,563 (8.3%) | 10,377 (8.3%) |
| The Tribune | .1 | 55,093 (4.4%) | 5,522 (4.4%) |
| The Wire | 1 | 23,518 (1.9%) | 2,356 (1.9%) |
| ThePrintIndia | .339 | 41,194 (3.3%) | 4,128 (3.3%) |
| scroll.in | .418 | 53,633 (4.3%) | 5,374 (4.3%) |
To identify tweets for this study, the data were analyzed to identify if “COVID” or “coronavirus” was mentioned in the tweet. If it was mentioned, then the tweet was labeled as a COVID-19 tweet. We then ran a logistic regression of the following form:

To get the proportion of tweets labeled as a COVID-19 tweet each month, we compute the average predicted probabilities for each month, using the margins command in STATA MP 16.1.
The second part of our analysis involves text mining of the tweets to discover topics associated with the tweet and how these topics evolve for different media outlets. We used STM to analyze the texts of tweets for each media outlet are analyzed using machine-assisted reading of text corpora.12
The STM model builds on the probabilistic topic models such as the Latent Dirichlet Allocation,13 Correlated Topic Models,14 and extensions of these models.15 However, the critical innovation in STM is to relate the topic models with information associated with the document or the tweet. In our paper, this information relates to the media outlet and the month they posted the tweet. In other words, STM, while discovering the latent topics in the tweet, also uses the information associated with the tweet, such as the media outlet that posted the tweet and the date when the tweet was posted.
Moreover, our structural model also allows the evolution of the topic to vary with each of the media outlets. Our purpose for this is to differentiate the topics of discussion across different media outlets. In particular, in our STM models, topic prevalence takes the following structural form:

In this, i is the topic of discussion, and the effect of the month on topic prevalence is estimated with a spline. The media outlet is interacted with the spline of the month to allow for topic prevalence to vary for the media outlet. Since STM can be computationally challenging, we select 10% of the population of tweets. The tweets were selected based on stratified random sampling without replacement. In particular, for each month, we randomly selected 10% of every media outlet’s tweets. A total of 125,606 tweets were part of the STM analysis (see table 1). Before the STM analysis, we prepared the data by removing infrequent words; in our analysis, if a word appears only in one tweet, it is dropped from the vocabulary. Based on this, a total of 107 (<0.1%) tweets were dropped. Our final data for the STM analysis was 125,499 tweets with a vocabulary of 29,999 words. The default initialization that we used was spectral, primarily because of its stability.
Next, we took the sample of 125,499 tweets and labeled each tweet with the dominant topic of discussion based on the STM analysis. We then made five categories based on the topic of discussion related to (1) coronavirus, case, vaccine, (2) China, border, import, (3) farmer, protest, law, Delhi, (4) elections, poll, assembly, and (5) others. We created a count of engagement for each tweet, which is the sum of retweets, likes, and replies. We then regress this count over the months while controlling for the media outlet, using negative binomial regression. In particular, we run the following regression:

Here, nbreg is negative binomial regression and subscript i is the index for the tweet.
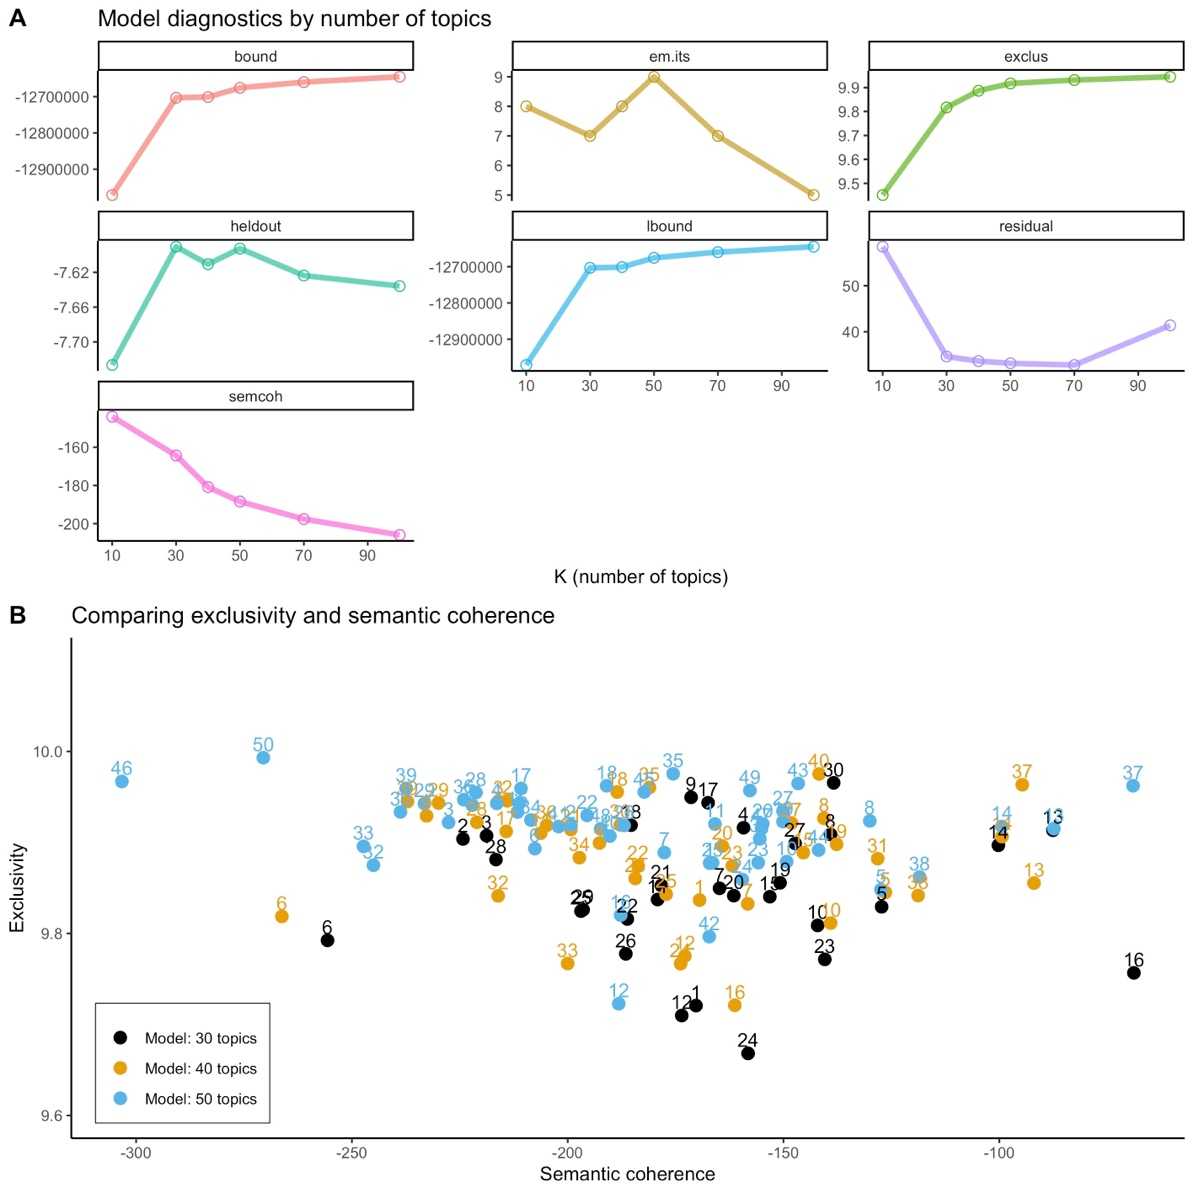
Our model selection for the number of topics was based on a data-driven approach. We performed several automated diagnostic tests, such as computation of held-out likelihood and residual analysis and compared the models with the varying topic along each of these criteria. In addition, we also report results associated with semantic-coherence for each of the models.16 There is always a possibility in STMs to produce topics that would be judged nonsensical by human domain experts. To minimize this, we selected the model that had fewer outlier topics based on semantic-coherence and also had higher exclusivity of the topics. Exclusivity of topic refers to words that have high overall frequency but at the same time are exclusive to the topic. Based on our diagnostic tests, we selected a model with 40 topics.
We should note that possible limitations of our analysis are that these data are limited to English media outlets and their messages on Twitter. The stories covered on Twitter could be very different from stories covered in print or discussed on news broadcasts, so they are not representative of the overall media discussion. In addition, the audience of the English-language media outlets on social media platforms could be different, for example, from the audience on other vernacular media outlets. It could be possible that other vernacular media outlets have a higher coverage of COVID-19 compared to the English-language media outlets.
Results
Based on the logistic regression, we found that the average proportion of daily tweets that mention “covid” or “coronavirus” was lowest in February 2021. It fell from a high of 52.9% (95% confidence interval [CI]; 52.6% to 53.3%) in April 2020 to 9.2% (95% CI; 9.0% to 9.4%) in February 2021. This pattern was observed across all the media outlets (see figure 1).
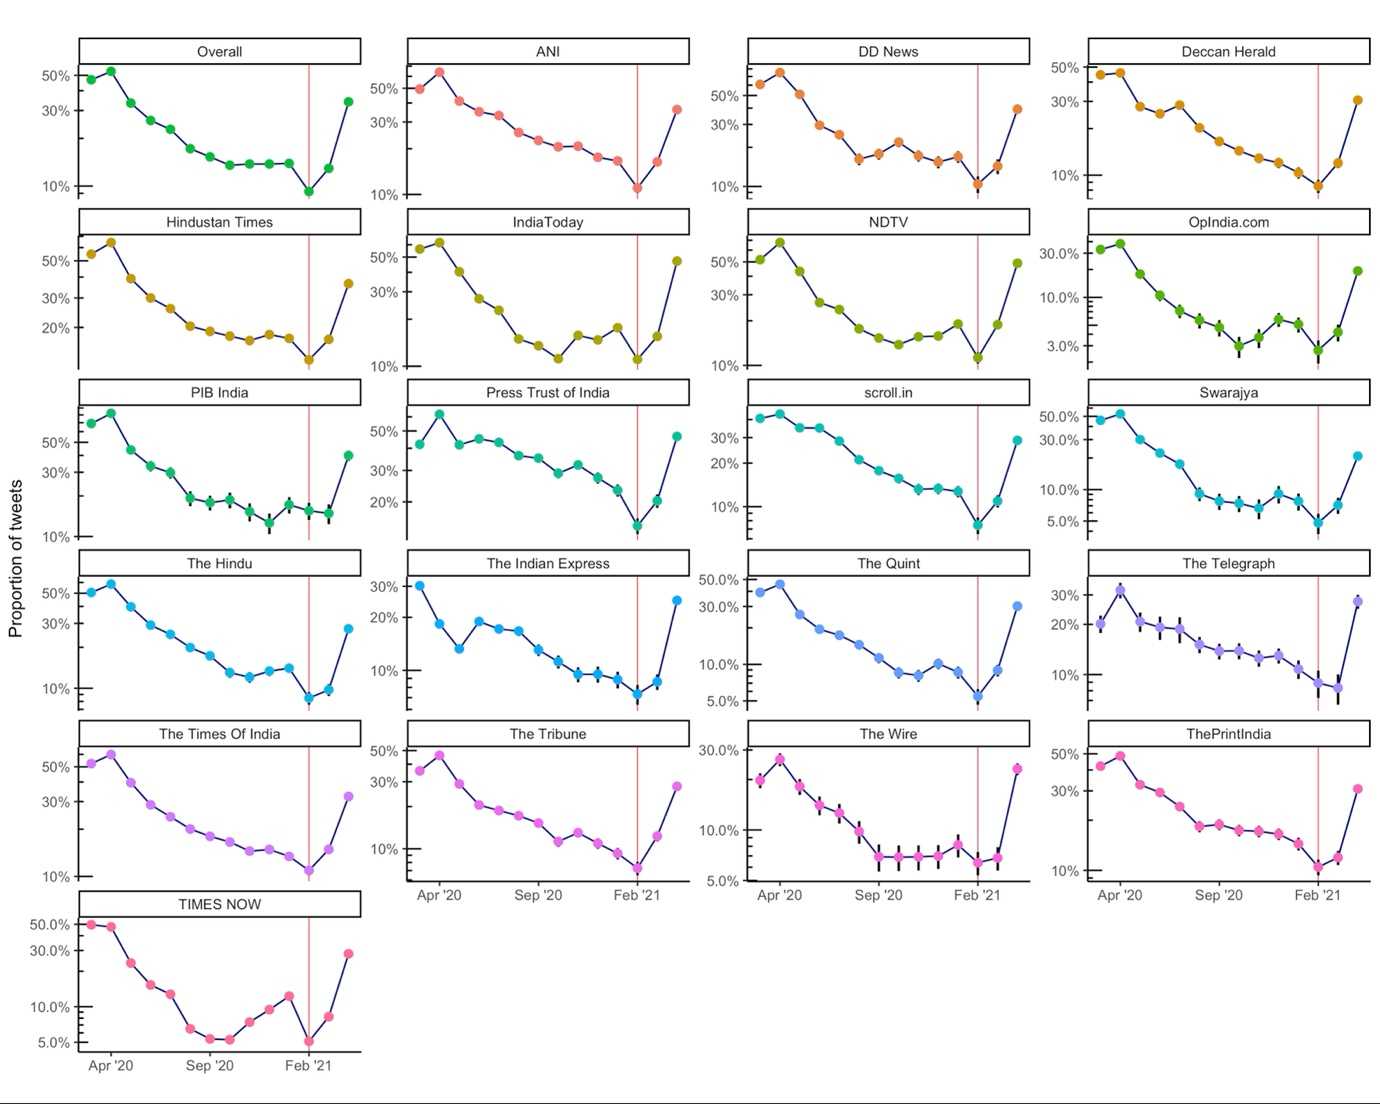
Figure 1: Average proportion of daily tweets that mention “covid” or “coronavirus”
Our next set of results relates to the STM analysis. The objective was to exploit the machine-assisted reading of the tweets across all the media outlets to discover the topics of discussion and how each of these topics evolved. Based on model diagnostics (see appendix 1 for a discussion on this), a 40-topic model was estimated with spectral initialization using STM. For our paper, we focus on general topics that relate to (a) COVID-19, coronavirus, vaccine, (b) elections and politics, (c) farmers protests and agitations, and (d) foreign affairs that include border issues with China.
Next, we plotted topic prevalence as a smooth function of time, which in our setting is the month (the topic prevalence model was related to the spline of the month), holding the media outlet at the sample median (see figure 2). Our results indicate that topics related to COVID-19 were the dominant topics of discussion from March 2020 until mid-May 2020; from then until the middle of June 2020, the conversation shifted to foreign affairs and border-related issues with China. Beginning in mid-September 2020, the topic of discussion turned to elections and farmers’ protests. State assembly elections in Bihar17 dominated the debate from mid-September until December 2020, when farmers’ protests began to dominate the discussion, even though there was an influx of debate related to COVID-19 vaccination.
Figure 2: Topic prevalence as a smooth function of the month, where the media outlet is at the sample median
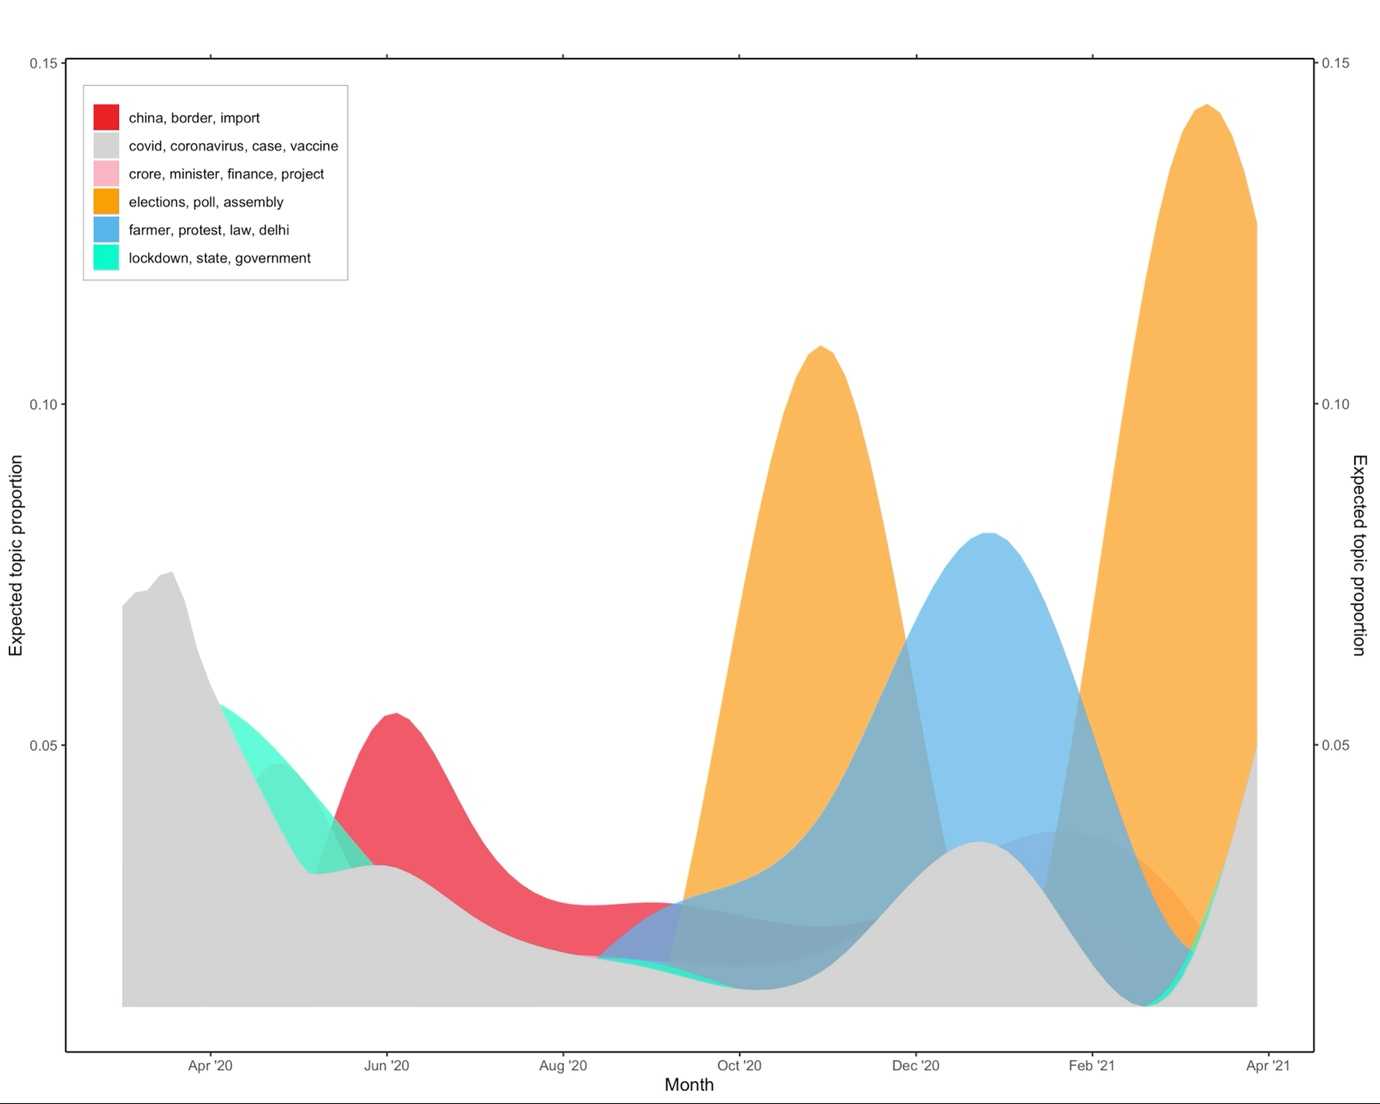
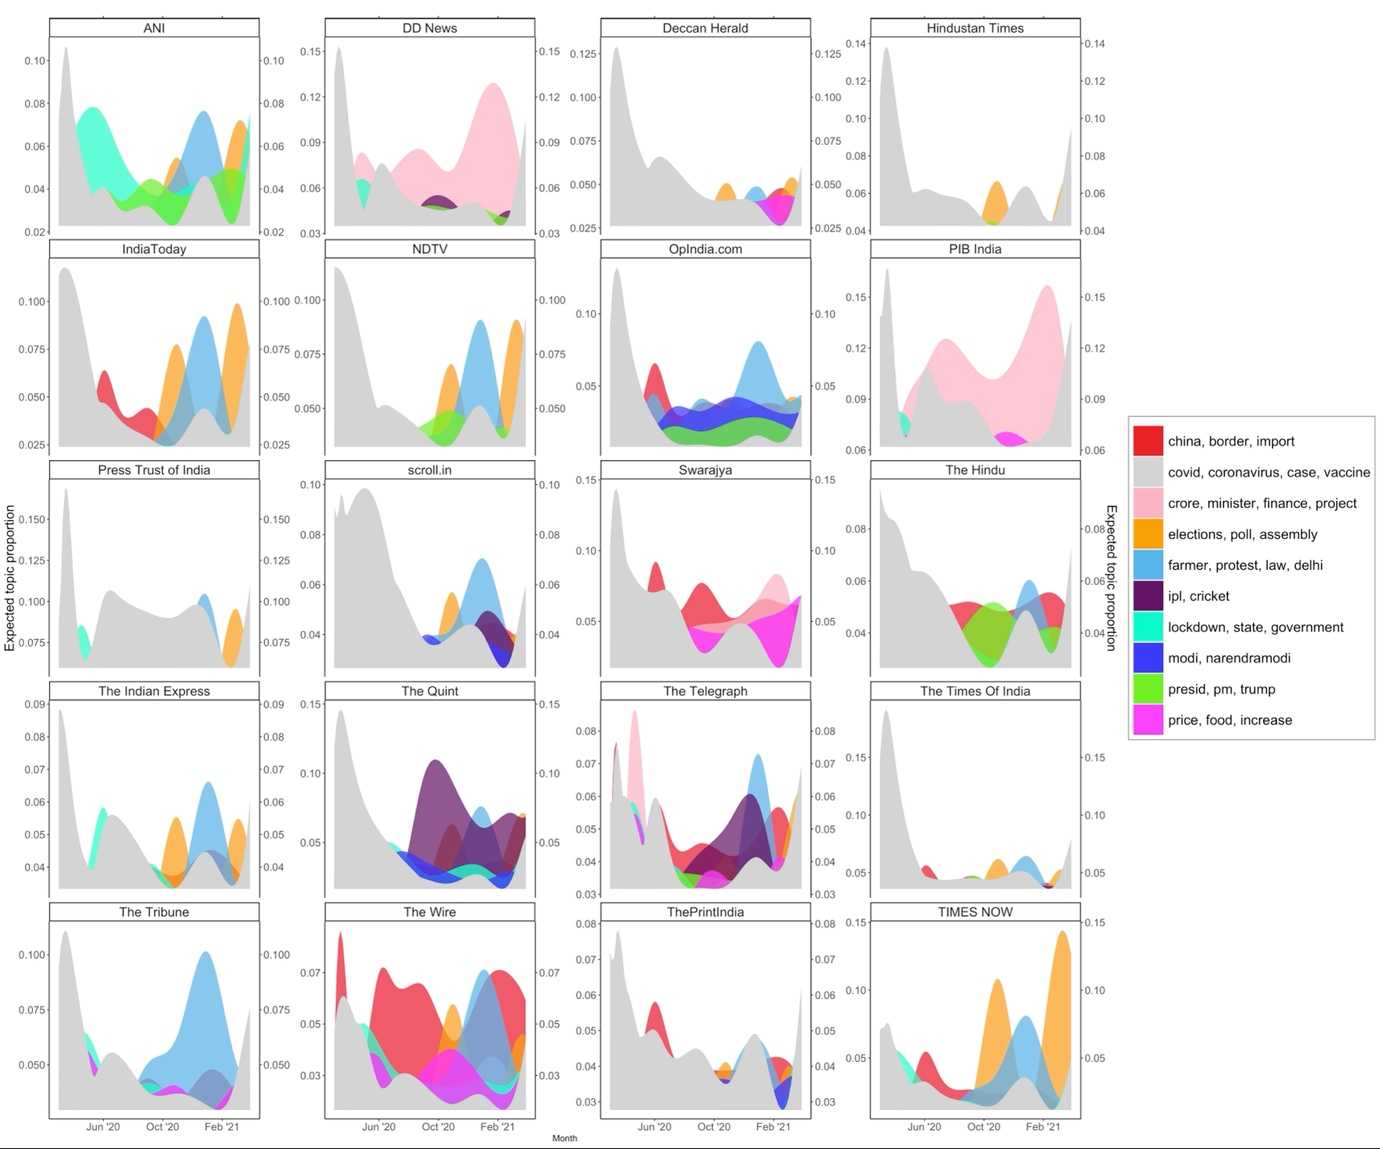
From early February 2021, state elections (in West Bengal, Tamil Nadu, and Puducherry)18 dominated the conversation (see figure 2). Next, we conducted a similar analysis that allowed for topic prevalence to differ across media outlets (see figure 3). Topic prevalence varied across media outlets; for example, for public news agencies such as DD News and PIB India, the dominant topic of discussion in the initial months was related to COVID-19 and coronavirus. However, over time, this declined and shifted to the issues related to finance and projects. For private media outlets in broadcasting, such as IndiaToday, NDTV, TIMES NOW, the dominant topic in the early months of the pandemic was related to COVID-19 and coronavirus; however, in subsequent months, border-related issues with China, elections, and farmers’ protests gained prominence. A similar pattern was observed for print media outlets such as The Hindu, The Indian Express, and The Times of India. However, a common feature across all media outlets was that, on the eve of the second wave (the period between mid-February 2021 and mid-March 2021), topics related to COVID-19 and coronavirus had insignificant coverage relative to other topics; the news instead was focused on topics like farmers protests, India-China border issues, state assembly elections, and cricket.
Figure 3: Topic prevalence as a smooth function of the month, across media outlets
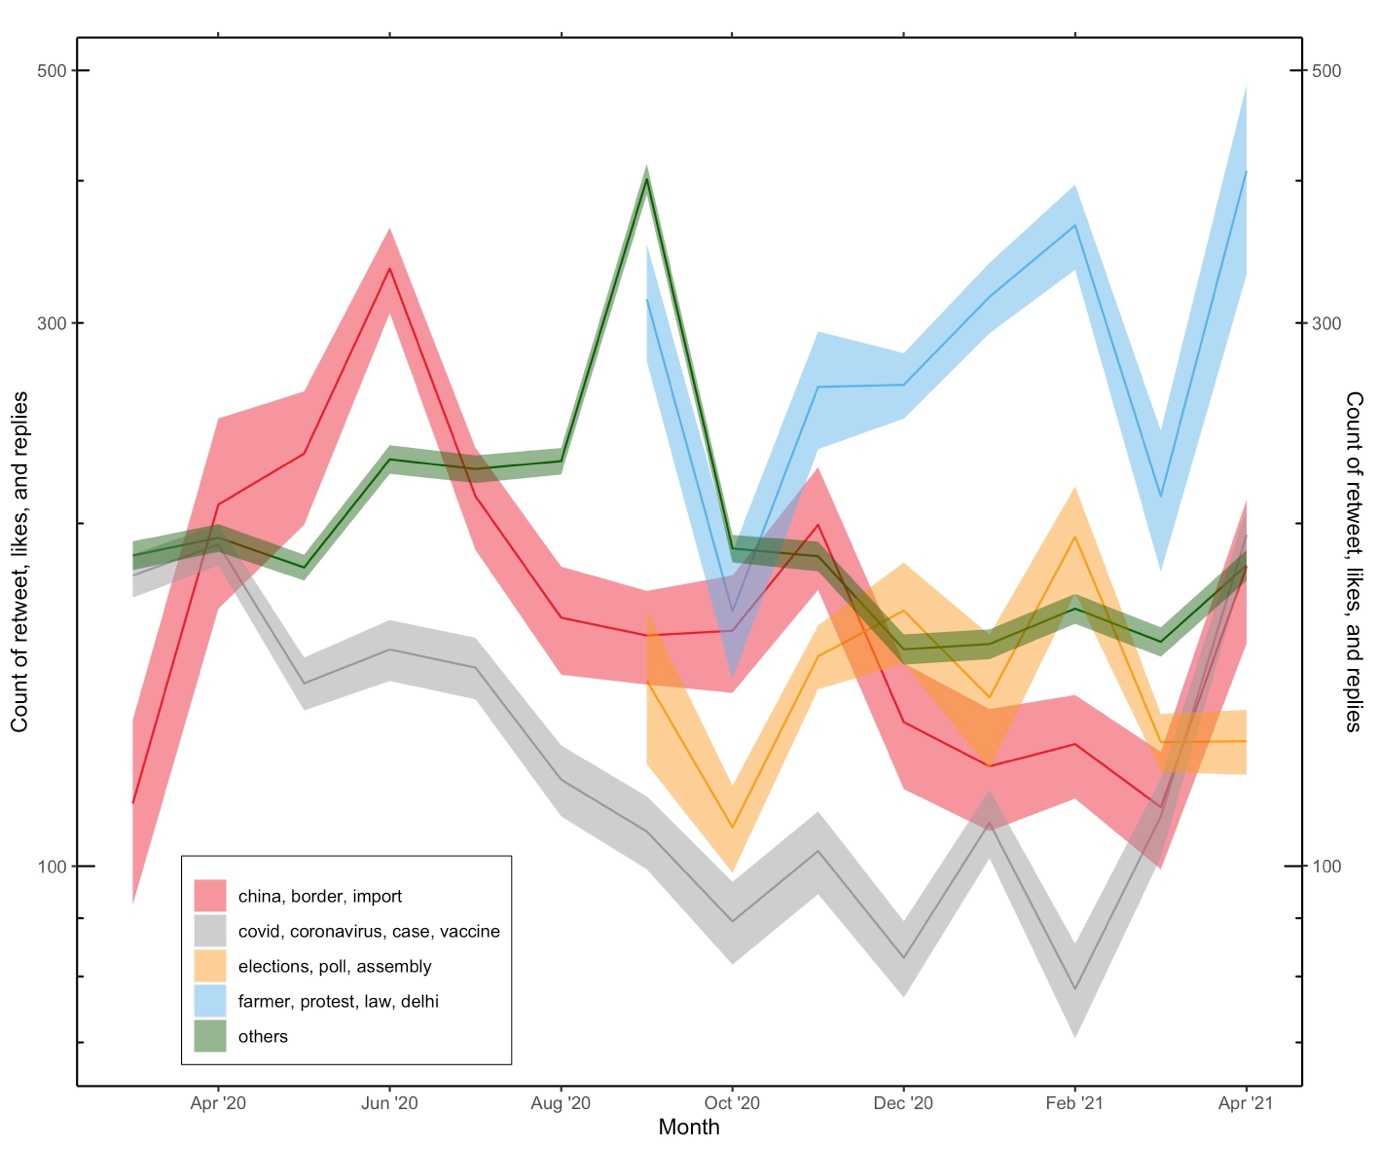
For the next part of the analysis, we study the response that a particular topic elicits from the audience in the form of count of retweets, likes, and replies. In particular, in our sample of 125,499 tweets used for the STM analysis, we label each tweet with the dominant topic of discussion. We then made five categories based on the topic of discussion related to (1) COVID-19, coronavirus, case, and vaccine, (2) China, border, import, (3) farmer, protest, law, Delhi, (4) elections, poll, assembly, and (5) others. Our results indicate that COVID-19 related topics had the least engagement in terms of the number of retweets, likes, and replies compared to other issues—and this trend is consistent across the entire timeline of the study. Issues related to China, elections, and farmers’ protests had significantly higher counts of retweets, likes, and replies (see figure 4). This is an important finding, as it shows that, compared to other topics, there is a relative lack of engagement on (or interest in) topics related to COVID-19 among Twitter users.
Figure 4: Count of Twitter retweets, likes, and replies over time across topics
Conclusion
Government complacency was identified as a critical factor for the surge of COVID-19 cases in India during the second wave.19 However, little attention has been paid to the activities of the media on the eve of the second COVID-19 surge, where peak daily cases and deaths were four to five times larger than the peak in the first wave.20 In this paper, using structural topic models based on machine-assisted text reading of tweets, we identify topics of discussion that were making waves in the time of the pandemic in Indian media, and particularly the period immediately before the second surge in COVID-19 cases and deaths. Our results show that discussions related to COVID-19 were at the lowest ebb on the eve of the second wave of the pandemic. Media attention was diverted from COVID-19 to topics related to farmers’ protests, elections, and entertainment (such as cricket matches in the Indian Premier League). This was true across all media outlets—print, broadcasting, and digital, both private and public—with varying agendas.
Media is an important institution in a democracy. It conveys information to the public and draws the government’s attention to issues that concern the public. It acts as a bridge between the people and the government. During a global pandemic that has devasted lives and livelihoods, the media’s role becomes crucial. News institutions are essential to bringing the government’s attention to early outbreaks while also nudging, using novel messaging, the tired public to adopt and sustain potentially burdensome NPIs, such as maintaining physical distance and hand hygiene, wearing a mask, etc. to contain the spread of the disease and limit its impact.21 Unfortunately, on the eve of the second COVID-19 surge, discussion related to COVID-19 was at its lowest point across all the media outlets. Moreover, COVID-19 related discussions attracted the least attention on Twitter compared to other topics, such as farmers protests, elections, court cases, and police activity.
Our paper has important implications for the future role of media in the Indian context. As we move forward, it is evident that new variants of the virus with varying transmissibility will emerge. There is also limited evidence on the efficacy of existing vaccines on newer variants.22 Therefore, NPIs will continue to play an important role in containing the deadly impact of the virus.23 Given its vast networks of reporters, the media could play a more proactive role in identifying early outbreaks. Secondly, along with the government, the media would need to innovate its messaging regarding the NPIs to the broader public because NPIs are costly to sustain. Thirdly, research on epidemics has shown a cyclical behavioral response with respect to the disease; that is, more disease leads to more demand for self-protection, in turn leading to less disease; however, this results in less self-protection, and this behavior change then leads to more disease.24
In light of this, it becomes imperative for both media institutions and governments to reinforce the messaging regarding the pandemic when the prevalence of the disease is at its lowest—which is just the opposite of what we observed in this analysis. Even though media is free to cover any topic in a democracy, we argue that it has to play an essential role during a pandemic to limit the disease’s impact on people. This did not happen on the eve of the second wave, and the lack of relevant information likely intensified the disastrous impact of the wave.
Appendix 1: Model selection for the number of topics
Our model selection for the number of topics was based on a data-driven approach. We performed several automated diagnostic tests, such as computation of held-out likelihood and residual analysis and compared the models with the varying topics along each of these criteria. In addition, we also report results associated with semantic-coherence for each of the models.25 There is always a possibility of statistical topic models to produce topics that would be judged nonsensical by human domain experts. To minimize this probability, we selected the model with fewer topics that were outliers based on the semantic-coherence and at the same time had higher exclusivity of the topics. Exclusivity of topic refers to words that have high overall frequency but at the same time are exclusive to the topic. Based on our diagnostic tests, we selected a model with 40 topics.
The Brookings Institution is a nonprofit organization devoted to independent research and policy solutions. Its mission is to conduct high-quality, independent research and, based on that research, to provide innovative, practical recommendations for policymakers and the public. The conclusions and recommendations of any Brookings publication are solely those of its author(s), and do not reflect the views of the Institution, its management, or its other scholars.
The findings, interpretations, and conclusions posted in this piece are not influenced by any donation. Brookings recognizes that the value it provides is in its absolute commitment to quality, independence, and impact. Activities supported by its donors reflect this commitment.
Authors

-
Footnotes
- Ministry of Health and Family Welfare (MoHFW), Government of India. https://www.mohfw.gov.in/.
- “India’s COVID-19 emergency.” The Lancet 397, 1683 (2021).
- Drèze, J. & Sen, A. Hunger and Public Action. Hunger and Public Action (Oxford: Oxford University Press).
- “Guidelines for the implementation of non-pharmaceutical interventions against COVID-19.” European Centre for Disease Prevention and Control, https://www.ecdc.europa.eu/en/publications-data/covid-19-guidelines-non-pharmaceutical-interventions (2020).
- Philipson, T. J. “Economic Epidemiology and Infectious Diseases” in Handbook of Health Economics (eds. Culyer, A. J. & Newhouse, J. P.) vol. 1 (Cambridge: Elsevier, 2000).
- Geoffard, P.Y. & Philipson, T. “Rational Epidemics and Their Public Control.” International Economic Rev. 37, 603–624 (1996); Philipson, T. “Private Vaccination and Public Health: An Empirical Examination for U.S. Measles.” The Journal of Human Resources. 31, 611–630 (1996); Kremer, M. Integrating Behavioral Choice into Epidemiological Models of the AIDS Epidemic. https://www.nber.org/papers/w5428 (1996) doi:10.3386/w5428
- Roberts, M. E., Stewart, B. M. & Tingley, D. stm: An R Package for Structural Topic Models. Journal of Statistical Software. 91, 1–40 (2019).
- Ibid.
- Dreze, J. & Sen, A.; Sen, A. “Food battles: conflicts in the access to food.” Food Nutrition (Roma) 10, 81–89 (1984).
- Besley, T. & Burgess, R. “The Political Economy of Government Responsiveness: Theory and Evidence from India.” Quarterly Journal of Economics 117, 1415–1451 (2002).
- Data is pulled from the following news sources: ANI, DD News, Deccan Herald, Hindustan Times, IndiaToday, NDTV, OpIndia.com, PIB India, Press Trust of India, TIMES NOW, The Hindu, The Indian Express, The Quint, The Times Of India, The Wire, ThePrintIndia, scroll.in, Swarajya, The Tribune (Chandigarh), The Telegraph (India).
- In the STM framework, “A topic is defined as a mixture over words where each word has a probability of belonging to a topic. And a document is a mixture over topics, meaning that a single document can be composed of multiple topics. As such, the sum of the topic proportions across all topics for a document is one, and the sum word probabilities for a given topic is one.” For a detailed discussion regarding STM, see: Roberts, M. E., Stewart, B. M. & Tingley, D. (2019).
- Blei, D. M., Ng, A. Y. & Jordan, M. I. “Latent dirichlet allocation.” Journal of Machine Learning Research 3, 993–1022 (2003).
- Blei, D. M. & Lafferty, J. D. A correlated topic model of Science. Ann. Appl. Stat. 1, 17–35 (2007).
- Roberts, M. E., Stewart, B. M. & Airoldi, E. M. “A Model of Text for Experimentation in the Social Sciences.” Journal of the American Statistical Association 111, 988–1003 (2016).
- Mimno, D., Wallach, H. M., Talley, E., Leenders, M. & McCallum, A. “Optimizing semantic coherence in topic models.” Proceedings of the Conference on Empirical Methods in Natural Language Processing 262–272 (Association for Computational Linguistics, 2011); Roberts, M. E., Stewart, B. M. & Tingley, D. (2019).
- Election Commission of India. Election Commission of India. https://eci.gov.in.
- Ibid.
- The Lancet (2021).
- Ministry of Health and Family Welfare (MoHFW), Government of India. https://www.mohfw.gov.in/.
- European Centre for Disease Prevention and Control (2020).
- Wall, E. C. et al. Neutralising antibody activity against SARS-CoV-2 VOCs B.1.617.2 and B.1.351 by BNT162b2 vaccination. The Lancet 0, (2021).
- Bo, Y. et al. “Effectiveness of non-pharmaceutical interventions on COVID-19 transmission in 190 countries from 23 January to 13 April 2020.” International Journal of Infectious Diseases. 102, 247–253 (2021); Brauner, J. M. et al. Inferring the effectiveness of government interventions against COVID-19. Science 371, (2021).
- Geoffard, P.-Y. & Philipson, T. (1996); Philipson, T. (1996); Kremer, M. (1996).
- Mimno, D., Wallach, H. M., Talley, E., Leenders, M. & McCallum, A. (2011); Roberts, M. E., Stewart, B. M. & Tingley, D. (2019).
The Brookings Institution is committed to quality, independence, and impact.
We are supported by a diverse array of funders. In line with our values and policies, each Brookings publication represents the sole views of its author(s).