

Introduction
In recent months, the country’s water infrastructure challenges have gained greater national visibility thanks to a number of high-profile speeches along the campaign trail, legislative efforts in Washington, and calls for increased investment from the incoming Trump administration. However, much of the hard work continues to rest on the shoulders of individual cities and states, where more than 95 percent of public spending on operations and capital improvements takes place annually.
Water utilities are under enormous pressure to balance a host of physical and financial responsibilities, especially when it comes to providing affordable, clean, and reliable service. From drinking water to wastewater to stormwater, utilities are trying to better quantify their infrastructure needs, develop more targeted plans, and explore a broad set of financing tools to pay for it all. Increasingly, utilities are also learning more from each other and collaborating with a variety of public and private partners to adopt a more flexible, forward-looking approach in future projects.
Flint, Mich. has attracted the most attention given the gravity of its challenges—environmental and otherwise—but the tremendous regional variety and scale of needed investments signal a range of water infrastructure concerns that utilities face nationally. What concerns Flint, after all, may be different from what concerns other cities. Utilities can struggle to locate infrastructure pinch points, create customized strategies, or even identify their relevant peers. Understanding how water needs compare across multiple cities is particularly difficult given the number of information gaps, including inconsistent data, different regulatory needs, and varying operational climates.
This brief provides an overview of the current context for water infrastructure investment in the United States—across larger drinking water utilities in particular—with an eye toward better understanding the financial standing of specific cities and how new solutions may take shape in years to come. By classifying cities according to six major categories of water finance and broad economic trends that affect performance, this brief finds that many large drinking water utilities are facing high levels of long-term debt and other operational and economic pressures that are spurring action in innovative planning approaches.
Understanding water investment challenges at the city level
Across the country, there is a significant mismatch between investment demand and institutional capacity. While more than 88 percent of Americans believe some type of action is needed to solve the country’s water infrastructure challenges, and many analysts agree that the time is ripe for increased infrastructure investment, only about 17 percent of utilities are confident that they can just cover the cost of existing service through rates and fees—let alone pursue needed upgrades. Publicly owned and operated utilities are increasingly running up against tight budgets, debt obligations, and other barriers to investment as user charges, municipal bonds, and traditional financing tools fail to keep up with the level of need.
Utilities of all sizes and geographies are confronting an immense array of investment shortfalls, with some estimates as high as $655 billion over the next two decades. Distribution and transmission infrastructure—including aging pipes and water mains—continue to rank among the most serious drinking water needs, according to the U.S. Environmental Protection Agency (EPA), while wastewater treatment and conveyance concerns are commonly cited in clean water assessments. Although the precise level of investment in these and other project categories can vary markedly from city to city, public utilities pour about $109 billion into water and wastewater spending each year, an amount that has declined in the past decade and often lags behind estimated operation, maintenance, and capital needs.
Financially, utilities have to overcome several hurdles to address these glaring needs, including rising operating costs and unpredictable revenues that can make it difficult to maintain self-sufficiency and make long-term capital plans. When adjusting volumetric rates and other charges, for instance, it can be tough to strike an equitable and efficient balance in generating enough revenue, particularly to cover the maintenance or outright replacement of deteriorating, depreciating assets. Meanwhile, many utilities are dealing with a crushing debt burden. Local governments now hold more than $1.7 trillion in long-term debt, so even though the cost of borrowing to pay for infrastructure upgrades has hovered near record lows, many cities simply do not have the capacity to take on additional debt.
Although the federal government , primarily through EPA, the Department of Agriculture, and the Department of Housing and Urban Development, provides some financial support for water infrastructure, the onus still falls squarely on states and localities. Following the passage of the Clean Water Act and the Safe Drinking Water Act in the early 1970s, EPA initiated a construction grants program to help drive water investment locally; in the 1980s and 1990s, however, EPA began helping to capitalize state-led water loan programs, or state revolving funds (SRFs), for clean water and drinking water projects. Federal funding for these SRFs now amounts to about $2.5 billion each year, or less than 4 percent of the nation’s total water spending, and questions have been raised about potential inefficient allocations.
Since most water investment is locally driven, cities must prioritize their improvements based on a specific set of economic, political, and environmental factors, a task often easier said than done. From complying with new regulatory requirements to preparing for the next major storm, utilities must carefully weigh local needs when launching new investments. At the same time, the fragmented nature of these improvements can be a challenge to manage, given that there are nearly 52,000 community water systems, and these frequently traverse political boundaries, touch multiple watersheds, and serve a range of different users. Whether installing new pipes or incorporating new treatment technologies, dozens of utilities can be housed in a given city, and the multiplicity of providers can make it hard to access capital and leads to numerous operational inefficiencies.
As a result, utilities are often limited in their capacity and resources to drive sorely needed water investments. Through better asset management, improved accounting practices, and more strategic financial planning, among several other efforts, utilities are striving to provide more sustainable, cost-effective service, but the scale of the nation’s water challenges is raising interest in new innovations and collaborations. Public-private partnerships, utility consolidations, green bonds, and new federal financing options, including EPA’s Water Infrastructure Finance and Innovation Act (WIFIA) program, have garnered considerable attention in this way, but many cities do not always have a clear sense of where they stand economically or otherwise when defining their water infrastructure needs.
Comparing water investment across different cities
The lack of a consistent and comprehensive source of information—from detailed metrics to best practices—makes it challenging for cities to benchmark their financial and economic standing against other markets. Utilities not only vary in their size and coverage, but they can also classify their budgets differently and face an ever-changing mix of regulatory, environmental, and demand considerations. The fact that dozens of separate utilities appear within individual cities can make it even more difficult to conduct reliable and timely analysis. Meanwhile, some factors that are hard to quantify can greatly influence the trajectory of local water investment, including a governing board’s culture and asset management strategies pursued in previous years. This lack of detailed information leads to a highly uncertain and uneven picture for water infrastructure investment when looking across different cities.
Yet there are certain financial and economic factors that help shed light on water infrastructure investment at a local level. As Moody’s and Fitch Ratings assessments indicate, for instance, municipal water and wastewater utilities are often rated based on their financial performance and various operational characteristics, including their balance sheets, capital demands, and debt burdens. While notoriously difficult to collect and compare across different cities, water rates and other miscellaneous fees (i.e., connection charges) represent another useful factor to analyze, and this examination can point to broader cost recovery and affordability concerns. Of course, a multitude of other factors, such as changes in incomes and population, can reveal potential revenue vulnerabilities for utilities in a given city as well.
With this context in mind, this brief uses a combination of Census data and 2015 survey data from the American Water Works Association (AWWA) and Raftelis Financial Consultants to investigate city-level water finances in greater depth. The AWWA survey data represent perhaps the most extensive and consistent source for comparing water utility finances nationally—classified by the primary city served— but the survey’s coverage has its limits, since it focuses on only a few hundred utilities across the country in only a handful of markets. The analysis here concentrates on the largest drinking water utilities, defined as those selling or treating at least 20 million gallons of water per day, that have complete reporting information; the sample covers 97 cities. Many of these large utilities typically have service populations of at least 100,000, including retail and wholesale customers.
- Only a handful of drinking water utilities in the largest cities nationally rank highly across six major categories of water finance and related economic indicators.
By examining how cities vary across six major gauges of water investment performance, this brief attempts to paint a more complete picture of utility financial health and other relevant economic conditions affecting the utility and its customer base. In particular, it considers three different measures of utility finances—operating ratios, debt-to-asset ratios, and rates—and three broad economic variables—changes in population, changes in median household income, and the share of lower-income households in the primary city served—to create a new barometer for city-level water infrastructure investment. Each of these indicators is outlined in Table 1 and described in greater depth in the following sections.
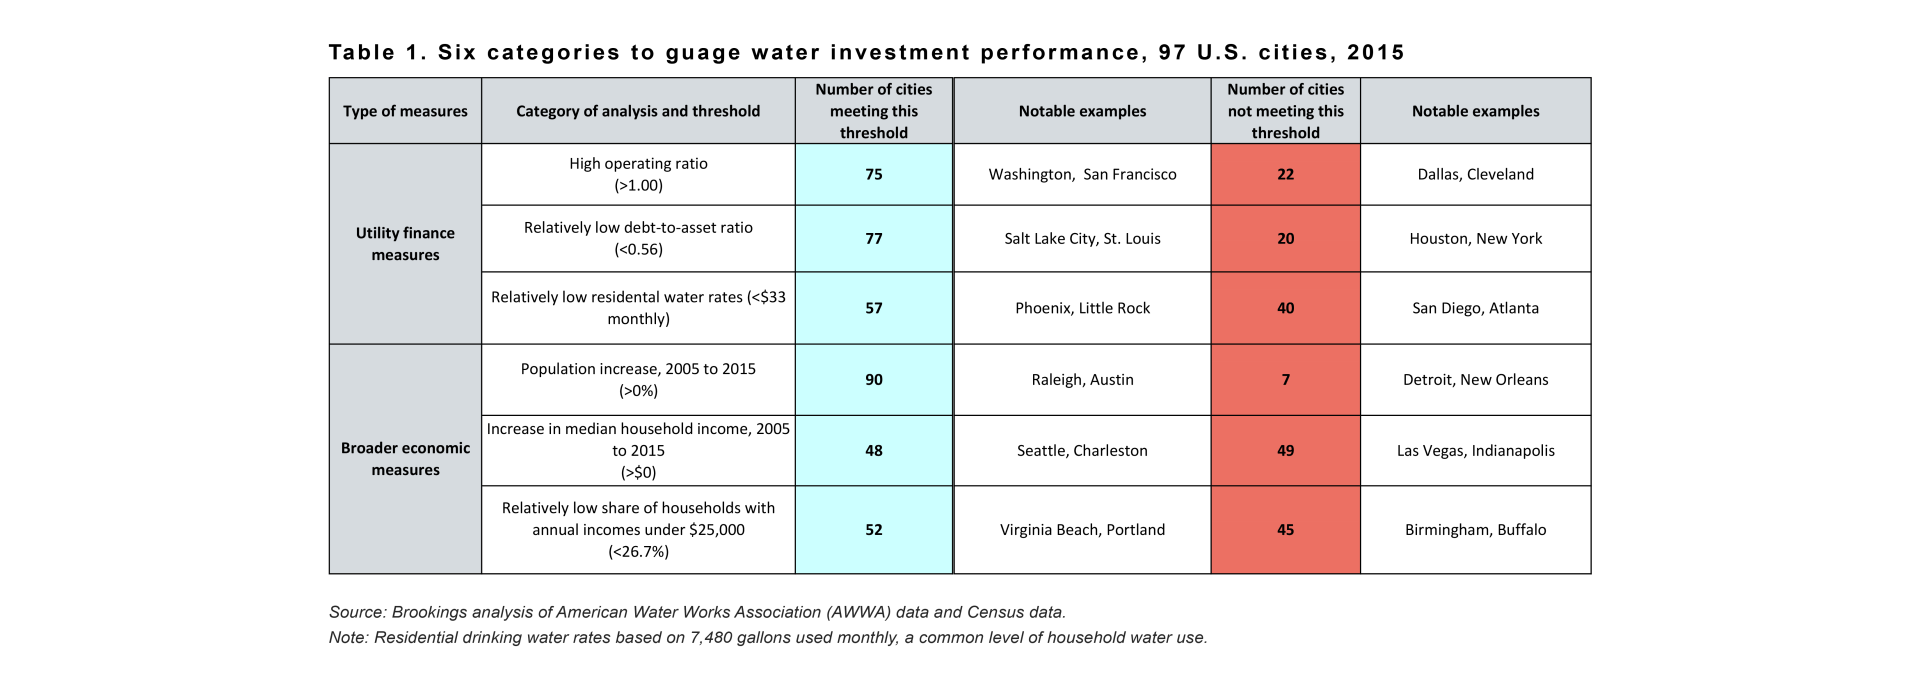
Figure 1 illustrates how large drinking water utilities fared across these six categories in 2015. Utilities in only 11 of the 97 cities analyzed tended to rank highly across all six categories, including places like Denver and San Antonio that had strong operations, shouldered low levels of debt, charged low residential drinking water rates, and within their customer base saw population growth, healthy gains in median household incomes, and a small share of lower-income households. In contrast, large drinking water utilities in cities like Detroit and Cleveland tended to struggle in many of these same categories. However, most drinking water utilities—in 55 of the 97 cities analyzed here—faced a mixed picture, scoring well in three or four of these six categories.

Examining the relative performance of these utilities in individual markets allows the creation of a cumulative “water investment score” (or ranking) for the 97 cities analyzed, ranging from a low of -6.20 in Detroit to a high of 9.61 in Washington (see Appendix A). These values are based on an aggregation of scores across all categories of financial and economic health; if a city meets a given threshold in a category, it earns a positive score, which is then added to its scores across all other categories. If a city fails to meet the given threshold, however, it earns a negative score, detracting from its cumulative total. A downloadable methodological appendix (Appendix B) describes the process used to calculate these scores.
As Table 2 illustrates, cities such as Washington; Charleston, S.C.; and North Las Vegas, Nev. lead the way in their water investment measures, boasting particularly strong operations and low levels of debt. Since their performance in these two categories is so outstanding relative to most other cities, they have high cumulative scores overall, despite lagging behind in other areas, such as residential drinking water rates.

By comparison, cities struggling to invest in their water infrastructure tend to measure more poorly across the six categories. Table 3 shows how cities from Detroit to New Orleans to Richmond face difficult operating conditions, bear sizable debt loads, and have high shares of lower-income households in their customer base. Interestingly, some cities in close geographic proximity are dealing with radically different circumstances for drinking water investment; utilities in Las Vegas and North Las Vegas, for instance, are only a few miles apart, yet they rank quite differently in the metrics presented here.

- More than three-quarters of large drinking water utilities are able to cover their operating expenses each year.
The operating ratio—revenues over operating expenses—is a useful indicator to gauge operating performance, and most of the drinking water utilities analyzed here tend to generate enough revenue to cover their expenses (i.e., they have a ratio of 1.0 or more).
As Figure 2 shows, large drinking water utilities in cities such as Washington (2.39), San Francisco (1.69), and Kansas City (1.61) have high operating ratios and sizable positive net incomes. In total, 75 of the 97 drinking water utilities have operating ratios of at least 1.0, although the scale of total revenues and operating expenses can vary considerably from utility to utility (and city to city) depending on the service population, number of accounts, and other factors. Nevertheless, some utilities are finding it harder to balance their operational expenses. Dallas (0.60), Cleveland (0.84), and Detroit (0.87) stand out among water utilities where expenses outweigh revenues.

- Many large drinking water utilities carry high levels of long-term debt—up to 96 percent of the value of their current assets—making it difficult to accelerate new capital investments.
In isolation, operating revenues and expenditures tell only part of the story in many cities, especially if these metrics do not account for depreciation costs. Cities and their respective utilities must carefully consider current asset conditions and long-term debt given the capital-intensive nature of their improvements. Over time, cities are assuming more debt to pay for infrastructure improvements and may become overleveraged relative to their assets. This burden can be reflected in a utility’s debt-to-asset ratio.
As Figure 3 shows, drinking water utilities in many cities are facing sizable debt loads. Houston (0.96) and New York City (0.94) have almost as much long-term debt (more than $32 billion combined) as the value of their current assets ($34 billion). The same proves true in relatively smaller markets like Birmingham, Ala. (0.90) and Augusta, Ga. (0.69). On average, the 97 large drinking water utilities analyzed here have debt-to-asset ratios of 56 percent (0.56); 20 of these 97 utilities are confronting even higher debt-to-asset ratios.

Cities with lower levels of long-term debt relative to their assets are able to pursue infrastructure improvements from a position of greater financial strength. For example, the drinking water utility in Salt Lake City has more than $363 million in assets but only a little over $14 million in long-term debt, leading to a debt-to-asset ratio of 4 percent (0.04). Despite seemingly stable debt pictures like this, though, it is still important for utilities to monitor a broad set of factors to determine long-term financial risk.
- On average, large drinking water utilities are charging higher rates to cover needed costs, although the specific rates can vary widely from city to city.
To cover their operating and capital expenses, utilities may increase their rates, adopt new rate structures, or implement a variety of fixed fees, and these can have profound implications for water conservation, revenue stability, affordability, and other economic or behavioral objectives. According to the AWWA data, nearly half of the drinking water utilities surveyed rely on increasing-block rates for residential customers (i.e., the price goes up as water use goes up). Regardless of structure, rates have risen more than 10 percent each year since 2008.

However, rates can still fluctuate widely across different utilities and cities, illustrated in Figure 4. For example, among the large drinking water utilities analyzed here, the average rate for residential customers using 7,480 gallons monthly—a common benchmark level for households—stands at about $33. Many of the highest residential water rates appear in California cities such as San Diego and Oakland due to a host of reasons, including the need to make up revenue for less water use from ongoing conservation measures and the need to pay for various infrastructure upgrades. High water bills also appear in Atlanta and Seattle, which have pursued several infrastructure projects and have had to meet new federal mandates in recent years.
Cities with lower rates could likely experience increases in years to come as infrastructure needs continue to escalate. Water utilities in Milwaukee and Phoenix, for instance, charge among the lowest rates nationally. It is important to note, however, that some of these monthly bills may mask or even fail to capture the full range of costs utilities face to provide service, depending on the existence of other fees and charges not included in this analysis.
- Many cities with large drinking water utilities are experiencing gains in income and population, but they are still struggling to balance affordability concerns, particularly for lower-income households.
A variety of factors besides the balance sheet can weigh heavily on a city’s water finances, including changes in the size and ability of a utility’s customer base to support infrastructure upgrades.
Income levels are especially relevant in this respect, given affordability concerns for lower-income households in many cities that are also raising water rates. Although water affordability is typically defined as a share of median household income, the limits of this approach are becoming increasingly apparent and demand a closer look at broader segments of the population. From 2005 to 2015, median household incomes increased in only about half of the cities (48 of 97) analyzed here, and even in cities where median incomes rose the share of lower-income households remains high. In Syracuse, N.Y., for instance, median household incomes have risen by nearly $5,000 over the past decade, but the share of households earning under $25,000 annually stands at 36 percent. The situation, not surprisingly, is even worse in places like Detroit, where median incomes declined by $8,000 and the share of households earning under $25,000 increased to 48.5 percent.

Population changes can also influence utility finances to a great degree, with more predictable customer demand making it easier to plan for future infrastructure needs. In 90 of the 97 cities analyzed here populations grew from 2005 to 2015, which can increase demand for services and lead to the potential for additional revenue, but also press utilities in Sacramento, San Jose, and elsewhere to meet this new demand and adopt stricter conservation measures. Conversely, declining populations in Detroit; New Orleans; Cleveland; and Akron, Ohio make it difficult to cover the costs of an extensive, underutilized system of infrastructure assets. Still, it is important to note that even while many utilities have seen their service populations grow, they continue to experience declines in water use. As more households cut their consumption and implement efficient technologies, utilities must closely monitor and adapt to changing market conditions in future plans and investments.
Exploring potential strategies and innovations
The highly fragmented, localized nature of the country’s water infrastructure makes it impossible to develop a one-size-fits-all approach to tackling investment needs. Drinking water utilities vary widely in their infrastructure challenges, both within and across different cities, and often lack timely, granular information to create targeted strategies. Pressed by a variety of budget constraints, economic shortfalls, and environmental considerations, many utilities are struggling to maintain their aging assets, adapt to climate pressures, and even fill their workforce gap, in addition to addressing other competing needs.
Related Content

However, as this brief has explored, there are several common factors that can better gauge the financial health of utilities and the viability of future improvements. Operationally, most utilities in the country’s largest cities are finding ways to cover their expenses. Yet, when considering capital needs now and into the future, long-term debt limits their capabilities to pay for large-scale maintenance or replacement projects. Simply increasing rates and fees to generate additional revenue for these upgrades may not always be feasible or sustainable either, especially for utilities already charging relatively high prices. Income and population swings can add even more economic complexity to this already difficult situation.
As such, the need for regional action and innovation has never been clearer. Ultimately, each utility must create a customized strategy that is responsive to its own unique management challenges—to meet user demands, address regulatory concerns, and strive for more efficient infrastructure performance, among other objectives—but some nascent efforts are underway nationally that could help build additional momentum behind future water investment.
For example, cities need to view their water needs comprehensively through a “One Water” approach rather than continuing to view drinking water, wastewater, and stormwater needs in isolation. This brief has viewed only one segment of the water infrastructure investment issue, but it has teed up several fundamental factors to consider across other types of water facilities beyond drinking water. Through integrated water resource management (IWRM) in particular, cities can address their water infrastructure challenges more systematically in light of larger economic factors and built environment considerations. Although IWRM is not a new concept and has a fairly broad definition, its emphasis on collaboration and information sharing holds promise in bridging the gap between different public and private stakeholders while improving financial and environmental outcomes. As part of its One Water LA 2040 Plan, for instance, Los Angeles has shifted toward such an approach, which will coordinate water management across all city departments, accelerate environmental upgrades, and advance more than $10 billion in capital improvements.
Beyond increased coordination, utilities should also look to adopt a more resilient business model that seeks to identify new sources of revenue and establishes new performance targets to improve their long-term financial health. As currently pioneered by the University of North Carolina’s Environmental Finance Center, this model emphasizes new ways to account for revenue risks through improved communication and data tools, including better measuring changes in residential demand and better assessing the costs and benefits associated with customer assistance programs at a local level. Calls for more comprehensive asset management and full cost accounting, likewise, are further pushing utilities to track investments in a clearer fashion. These efforts, underway in New Jersey, Ohio, and other states, can help complement steps toward adopting efficient technologies and modernizing physical operations.
Utilities should keep experimenting with new financial and technical tools as well. While municipal bonds, potential Build America bonds, private activity bonds, and other tax-exempt debt remain attractive, flexible options to pay for improvements, utilities need to consider the full range of tools and approaches available to them. EPA’s Water Infrastructure and Resiliency Finance Center has helped provide technical support through which utilities can more easily investigate and collaborate on leading edge financing options, including new pricing mechanisms and WIFIA support. Instituting new fees, such as stormwater fees, has also continued to attract attention among many utilities that have traditionally relied on more unpredictable volumetric changes. Finally, several new types of bonds have been explored in different markets, from green century bonds in Washington to resilience bonds in flood-prone areas.
Depending on their particular situation, utilities might also benefit from exploring new partnerships, including public-public and public-private partnerships. While still quite rare for water infrastructure in the United States, these collaborations aim to bring together different public and private entities—around project design, construction, and operation—to spread financial risk, gain technical expertise, generate cost savings, and jumpstart infrastructure investment. For example, public-public partnerships have emerged in some markets, including Allentown’s water system and the Lehigh County Authority, to improve operational performance and relieve the city’s debt burden. A similar appetite for public-private partnerships has gained traction in recent years. For example, in Rialto, Calif., a 30-year, $300 million agreement between the city and a consortium of private partners has helped improve maintenance and address other capital backlogs. Some analysts predict public-private partnerships in water will continue to expand in years to come, although many factors will determine their ultimate reach, including the need for public transparency, durable revenue streams, and clear regulatory frameworks, as well as their effect on equity.
Conclusion
In all likelihood, utilities and their regional partners will need to consider a wide menu of options to drive future water investment. The scale and nuances of the challenge at hand demand more extensive analysis, and the concerns of individual cities and the capacity to drive innovative solutions will need to be fleshed out more fully. This brief scratches the surface of the types of metrics and tools that cities need to uncover in greater depth as they explore new approaches to address their long-term water infrastructure needs. However, more work needs be done to cover all types of utilities (drinking water, wastewater, and stormwater) and geographies (urban, suburban, and rural) to get a clear sense of the water investment challenge and opportunity.
Author
The Brookings Institution is committed to quality, independence, and impact.
We are supported by a diverse array of funders. In line with our values and policies, each Brookings publication represents the sole views of its author(s).