As Congress debates the fate of the “DREAMers”—those undocumented immigrants who arrived in the United States as children—the one-year anniversary of the start of the Deferred Action for Childhood Arrivals (DACA) program occurs on August 15. The DACA program—an initiative of the Obama administration—does not provide permanent lawful status to applicants. However, it confers two important advantages to approved applicants: a temporary suspension of deportation and the authorization to work in the United States.1 The program also provides researchers and policymakers a glimpse into the “DREAMer” cohort.
Some 900,000 individuals were estimated to be immediately eligible for deferred action at the date of the announcement.2
This analysis of DACA applications, obtained through a Freedom of Information Act (FOIA) request to the Department of Homeland Security (DHS), offers insights into the size, demographics, geographic distribution, age, and year of arrival of applicants. The Brookings FOIA data include information on the first 465,509 applications, corresponding to the period August 15, 2012 to March 22, 2013, and accounting for 87 percent of all accepted applications through June 30, 2013. DACA applications are accepted on a rolling basis and there is no deadline. The statistics presented here, therefore, represent a snapshot, and are not final. The first finding below uses statistics directly from United States Citizenship and Immigration Services (USCIS) on applications filed between August 15, 2012 and June 30, 2013, and the remainder of the findings are derived from the Brookings FOIA data.
To qualify for the DACA program, applicants must meet the following criteria:
- Have arrived in the United States prior to age 16
- Have continuously resided in the United States without legal status since June 15, 2007
- Be less than age 31 as of June 15, 2012 and at least age 15 at application (unauthorized immigrants under 15 but in removal proceedings are also eligible to apply)
- Be currently enrolled in school, have graduated high school or obtained a general development certificate (GED), or be an honorably discharged veteran
- Have not been convicted of a felony or multiple or serious misdemeanors and not pose a threat to national security or public safety
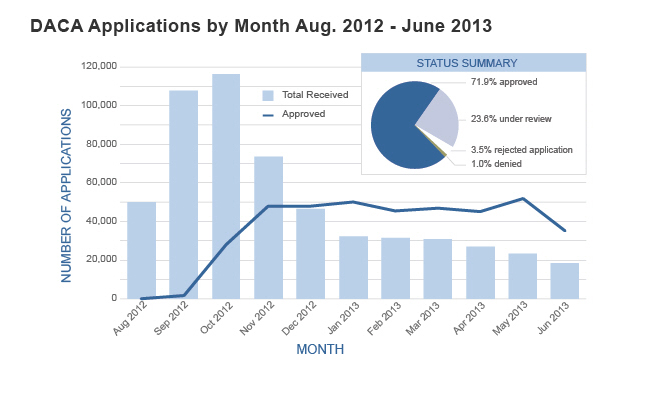
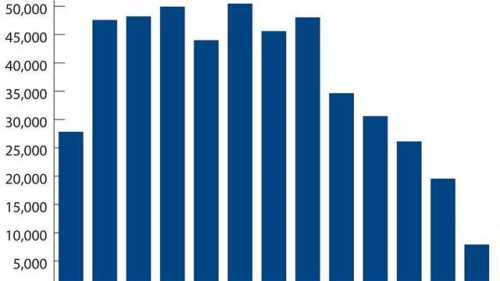
1. More than half a million people have applied for DACA through June 2013; 72 percent have been approved, while just 1 percent have been denied. The majority of the remaining applications are still under review.
USCIS publishes monthly statistics on DACA applications. Between August 15, 2012 and June 30, 2013, the agency received 557,412 applications. Of these, 537,662 were accepted for review (3.5 percent of those submitted were rejected because they were incomplete). Among those accepted as of June 30, 74.5 percent were approved, 24.5 percent are still under review, and only 1.0 percent (5,383 applications) were denied deferred action.
Estimates of the potentially eligible population calculated by the Immigration Policy Center (IPC) using age, country of birth, educational attainment and enrollment, and year of entry to the United States show approximately 936,000 immigrants were immediately eligible at the time of the announcement of the program. Eligibility criteria such as continuous residence and criminal history are much harder to approximate. Nonetheless, taken at face value, an estimated 59 percent of eligible individuals have applied.3
In the months after the DACA program began accepting applications in August 2012, application numbers were high, peaking in October (116,223 applications received), declining to 46,386 in December 2012, hovering around 30,000 through March 2013, and reaching a low of 18,279 in June 2013. Three months into the program, approvals began picking up at a fast rate, with an average of 46,000 from November 2012 and June 2013.
There are several likely reasons that applications have tapered. Potential DACA applicants with the most straightforward cases—younger people, especially those currently enrolled in school and living with their families, for example—have an easier time proving their continuous residence in the United States and may therefore have applied earlier. Approaching the end of high school and making decisions about post-graduation life may motivate young people to apply for DACA. They have more support than their older counterparts through nonprofit organizations th at are supporting the DACA-eligible population, especially those coordinating with schools. Older applicants, especially those living independently from parents, and those not enrolled in school, may have a harder time documenting that they have been living in the United States continuously since 2007. In addition, the more time that has elapsed since their entry, the longer time period they must document residence in the United States.
Numerous factors come into play for individuals considering applying for deferred action. Many applicants are motivated by opportunities to come out of the shadows and apply for a work authorization card, to gain eligibility for in-state tuition at public colleges and universities (for residents of 19 states), and to apply for a driver’s license (45 states). Other potential applicants are discouraged by issues such as whether they qualify given the criteria, lack of funds for the $465 application fee, ability to document continuous presence in the United States, or lack of educational enrollment. Some potentially eligible individuals may not be aware of their undocumented status, especially younger people. Still others lack correct information about the program. Despite outreach by nonprofits, many lack access to support in filing applications.
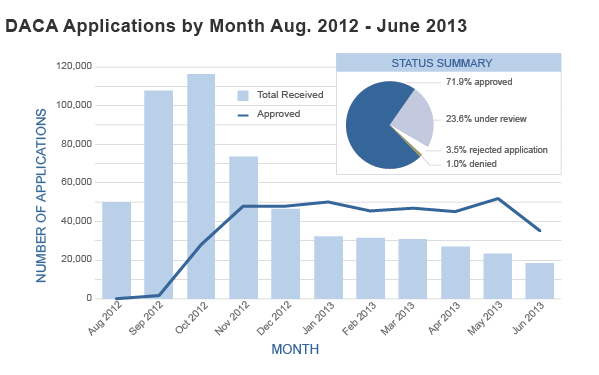 Note: Larger number of approvals than applications since December 2012 reflect the time lag between DHS receiving a DACA application and adjudication.
Source: USCIS Office of Performance and Quality (OPQ)
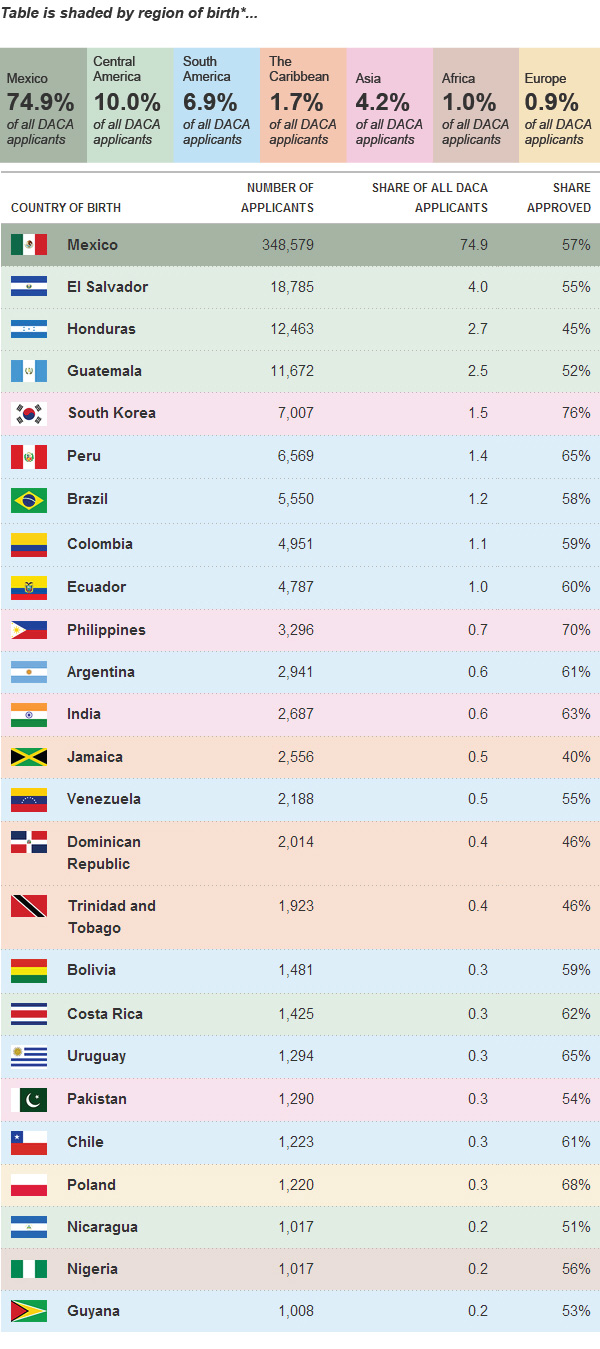
2. The vast majority of applicants were born in Mexico, and 25 other countries of birth have over 1,000 applications.
The Brookings FOIA data show that DACA applicants were born in 192 countries, and that there are 25 countries with at least 1,000 applicants who together accounted for over 96 percent of all applicants. In total, 74.9 percent of applicants were born in Mexico, followed by El Salvador (4.0 percent), Honduras (2.7 percent), Guatemala (2.5 percent), South Korea (1.5 percent), Peru (1.4 percent), Brazil (1.2 percent), Colombia (1.1 percent), Ecuador (1.0) and Philippines (0.7).
Regionally, Central Americans comprised 10 percent of the total, South Americans were 7 percent, Asians made up 4 percent, Caribbeans were 2 percent of the total, and those from all other countries made up the remaining 2 percent.
While 57 percent of applications had been approved through March 22, 2013, approvals vary widely by country of birth.4 Among countries with large numbers of applications and higher-than-average approvals are South Korea, Philippines, Peru, India, Argentina, Ecuador, Colombia and Brazil. Fifty-seven (57) percent of applicants born in Mexico have been approved. Applicants from Jamaica, Honduras, Guatemala, El Salvador, and Venezuela have been approved at lower-than-average rates.
Countries with low approval rates had median dates of approval in early 2013, indicating that many applications are likely still pending while still more are being submitted. The Brookings FOIA data conclude in March 2013; analysis of the applications at a later date may point to a higher approval rate.
Of particular note is the lack of Asian applicants, relative to expectations. Estimates from IPC show approximately 6 percent of potentially eligible applicants are from Asian countries, while the Brookings FOIA data show that they make up only 4 percent of applicants. Comparing other regions, Mexican applicants are somewhat overrepresented, Caribbean and other North American applicants are slightly underrepresented, and applicants from the rest of the world are on par with IPC estimates.
 Note: An additional 0.4% of applicants come from other regions.
Source: Brookings FOIA data
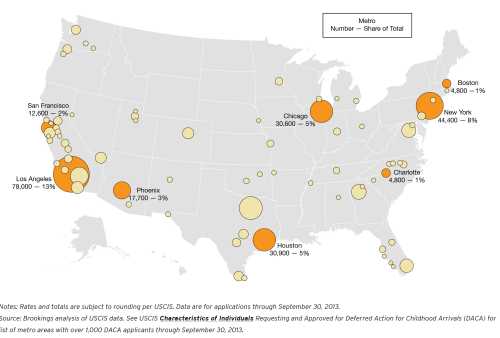
3. The distribution of DACA applicants by state mirrors settlement patterns of all immigrants; applicants from East Coast states come from a more diverse set of origin countries.
California, Texas, New York, Illinois, and Florida have the most DACA applicants through March 22, 2013. These states are also among those with the largest foreign-born populations overall. While New Jersey has the fifth highest number of immigrants among all states, it ranks in ninth place behind North Carolina, Arizona, and Georgia for DACA applications. Those three states, with between 15,000 and 17,000 DACA applications each, were among the states with the fastest growing immigrant populations in the past decade or so, and they also are estimated by the Pew Hispanic Center to rank among the top ten states in the number of unauthorized immigrants.
States vary in the source regions of DACA applicants. Among all applicants, 75 percent were born in Mexico. While the majority of applicants residing in Western, Midwestern, and most Southern states were also born in Mexico, East Coast states have a more diverse composition. For instance, only 6 percent of Massachusetts applicants hailed from Mexico, and no more than 25 percent of Virginia, Maryland and New York applicants were from Mexico. New York has one of the most diverse compositions, with Asian, Caribbean, and Central American applicants each making up 16 percent, South Americans comprising 22 percent, and Europeans and Africans with 4 and 3 percent, respectively. Both Maryland and Virginia have large shares of Central Americans (49 and 43 percent respectively) and Asians (7 and 8 percent respectively). Nine (9) percent of Maryland’s applicants were born in Africa, by far the largest of any state. By contrast, the vast majority of applicants in many Western states were born in Mexico, including Arizona (97 percent), Colorado (92 percent), and California (86 percent). In Illinois, North Carolina, Tennessee, and Georgia as well, at least 75 percent of applicants were from Mexico.
Source: Brookings FOIA data
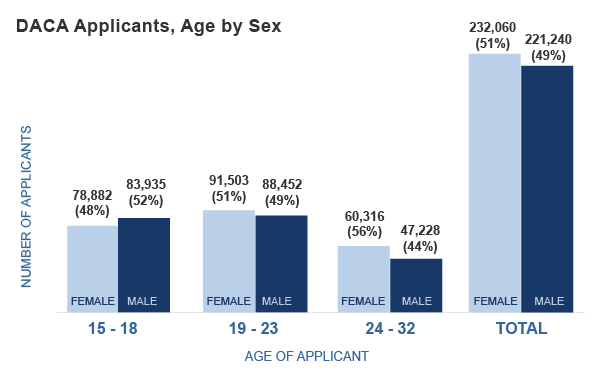
4. More than one-third of DACA applicants were between 15 and 18. There are fairly even numbers of women and men, but female applicants are slightly older than males. Applicants tend to be younger in newer destination states.
Overall, DACA applicants were fairly evenly split between males and females. Fifty-one (51) percent of DACA applicants were female; 49 percent were male. The most common year of birth for applicants was 1994. Using age approximations based on year of birth, those applicants were 18 years old when the DACA program began. Those aged 15 to 18 made up 36 percent of applicants, those 19 to 23 were 40 percent of applicants, and those 24 and over comprised 24 percent of total applicants.
Female applicants tended to be slightly older than male applicants, with a mean age of 20.8 for females compared to 20.3 for males. Fifty-six (56) percent of older applicants (age 24 to 32) were female, while 52 percent of younger applicants (age 15 to 18) were male. The middle age category—which is the largest—is the same as the total: 51 percent were women, and 49 percent were men.
More than half (54 percent) of all DACA applicants were under age 21. However, across states the average age at application varies. Some states with long-established immigrant populations like California, Illinois, New York, and New Jersey, had the largest share of DACA applicants who were 21 and older. In newer destination states such as Alabama, Arkansas, Indiana, and Georgia, applicants were more likely to be 20 or younger.
 Source: Brookings FOIA data
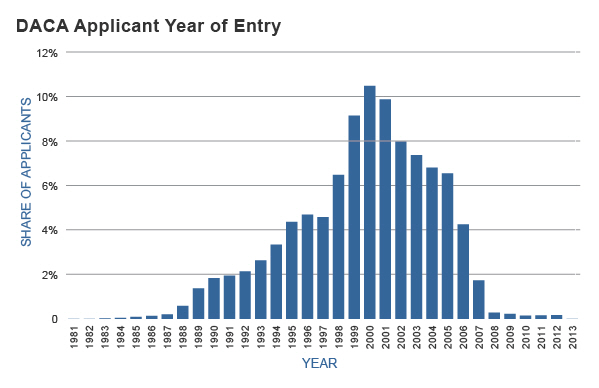
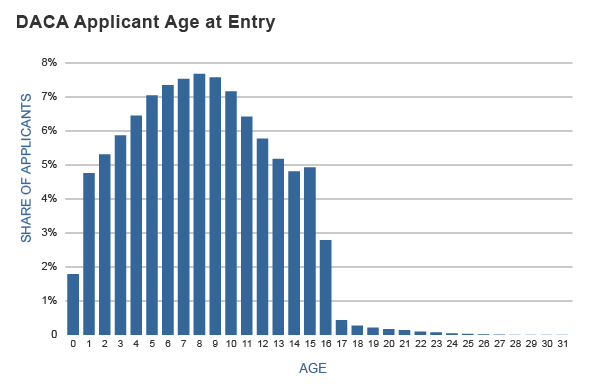
5. Nearly three-quarters of DACA applicants have lived in the United States for at least ten years and nearly one-third were age five or younger at arrival.
The vast majority of DACA applicants arrived in the 1990s and 2000s (97 percent). Fully 30 percent of all applicants (134,000) reported arriving between 1999 and 2001, which corresponds to a period of overall high immigration. As of 2012, 72 percent of all DACA applicants had been in the United States for at least 10 years. Arrivals grew steadily through 1994, to slightly more than 15,000, plateauing between 1995 and 1997 around 20,000 entries each year. By 1997, 28 percent of DACA applicants were already living in the United States. 1998 saw significantly more applicants arrive than any prior year (almost 30,000), but entries skyrocketed in 1999. Entries remained highest through 2001, with almost 45,000 applicants arriving on average each year. Arrivals declined by almost 8,500 in 2002 and continued to gradually decline through 2005, before dropping off toward the 2007 arrival cutoff for DACA applicants.
 Source: Brookings FOIA data
DACA applicants were young when then they were brought to the United States. The most common age at arrival was eight, however almost one-third (31 percent) were five or younger and more than two-thirds (69 percent) were 10 or younger when they arrived. DACA application forms require applicants to report their legal status upon arrival to the United States. Nationally, 61 percent of DACA applicants reported they entered without inspection (EWI), while 11 percent entered with a valid visa. Because a large share (28 percent) reported their status as unknown however, these data should be interpreted with caution.
 Source: Brookings FOIA data
Footnotes
1. The two-year reprieve is renewable, provided the program is maintained in future years.2. That number climbs to 1.3 million if those who meet the age criteria but have not met the educational criteria enroll in a GED program. An additional group of beneficiaries who are currently between the age of 5 and 14 may meet the requirements in the future, which ultimately brings the estimate to 1.76 million.3. Note that this estimate of 59 percent is based on USCIS data, based on applications through June 30, 2013.4. Note that this estimate of 57 percent is based on Brookings FOIA data, based on applications through March 22, 2013.
Graphics by Christopher Ingraham and Marcia Underwood
Related Content

Related Books


The Brookings Institution is committed to quality, independence, and impact.
We are supported by a diverse array of funders. In line with our values and policies, each Brookings publication represents the sole views of its author(s).