Executive Summary
There is a strong and politically bipartisan push to increase access to government-funded pre-K. This is based on a premise that free and available pre-K is the surest way to provide the opportunity for all children to succeed in school and life, and that it has predictable and cost-effective positive impacts on children’s academic success.
The evidence to support this predicate is weak. There is only one randomized trial of a scaled-up state pre-K program with follow-up into elementary school. Rather than providing an academic boost to its participants as expected by pre-K advocates, achievement favored the control group by 2nd and 3rd grade. It is, however, only one study of one state program at one point in time. Do the findings generalize? The present study provides new correlational analyses that are relevant to the possible impact of state pre-K on later academic achievement. Findings include:
- no association between states’ federally reported scores on the fourth grade National Assessment of Educational Progress (NAEP) in various years and differences among states in levels of enrollment in their state’s pre-K program five years earlier than each of those years (when the fourth-graders taking NAEP would have been preschoolers);
- positive associations (small and typically not statistically significant) between NAEP scores and earlier pre-K enrollment, when the previous analysis is conducted using NAEP scores that are statistically adjusted to account for differences between the states in the demographic characteristics of students taking NAEP; and
- no association between differences among states in their gains in state pre-K enrollment and their gains in adjusted NAEP scores.
Under the most favorable scenario for state pre-K that can be constructed from these data, increasing pre-K enrollment by 10 percent would raise a state’s adjusted NAEP scores by a little less than one point five years later and have no influence on the unadjusted NAEP scores.
Unabashed enthusiasts for increased investments in state pre-K need to confront the evidence that it does not enhance student achievement meaningfully, if at all. It may, of course, have positive impacts on other outcomes, although these have not yet been demonstrated. It is time for policymakers and advocates to consider and test potentially more powerful forms of investment in better futures for children.
Background
States vary considerably in the percentage of their four-year-olds that enroll in the state’s pre-K program. In the 2011-2012 school year, for example, there were 10 states without a state pre-K program at all whereas the average enrollment among the 10 states with the largest programs was 52 percent. The state that led the list that year, Florida, enrolled 79 percent of its four-year-olds.
With an occasional stutter, state pre-K enrollments have increased over time. From 2002 to 2017, the percentage of four-year-olds enrolled in state pre-K rose from 14 percent to 33 percent.1 A few states expanded dramatically during this time frame. Florida, the leader in enrollment by 2011-2012, had no state pre-K program in 2003-2004.
Advocates for government-funded pre-K argue that it is the surest way to provide the opportunity for all children to succeed in school and life. The buy-in by politicians is impressive. President Obama articulated this viewpoint in his 2013 state of the union address:
Tonight, I propose working with states to make high-quality preschool available to every child in America. Every dollar we invest in high-quality early education can save more than seven dollars later on – by boosting graduation rates, reducing teen pregnancy, even reducing violent crime. In states that make it a priority to educate our youngest children, like Georgia or Oklahoma, studies show students grow up more likely to read and do math at grade level, graduate high school, hold a job, and form more stable families of their own. So let’s do what works, and make sure none of our children start the race of life already behind. Let’s give our kids that chance.2
The push for expansion of state pre-K is bipartisan. About a third of U.S. governors who delivered state of the state addresses in 2018 highlighted early learning initiatives. More than half were Republicans.3
Leaving aside the positions taken by politicians and pre-K advocates, is there good reason to believe that state pre-K is effective? Or is it another one of the periodic crazes that grip education reform in America, in the absence of or despite available evidence?
Related Content


Does state pre-K raise student achievement?
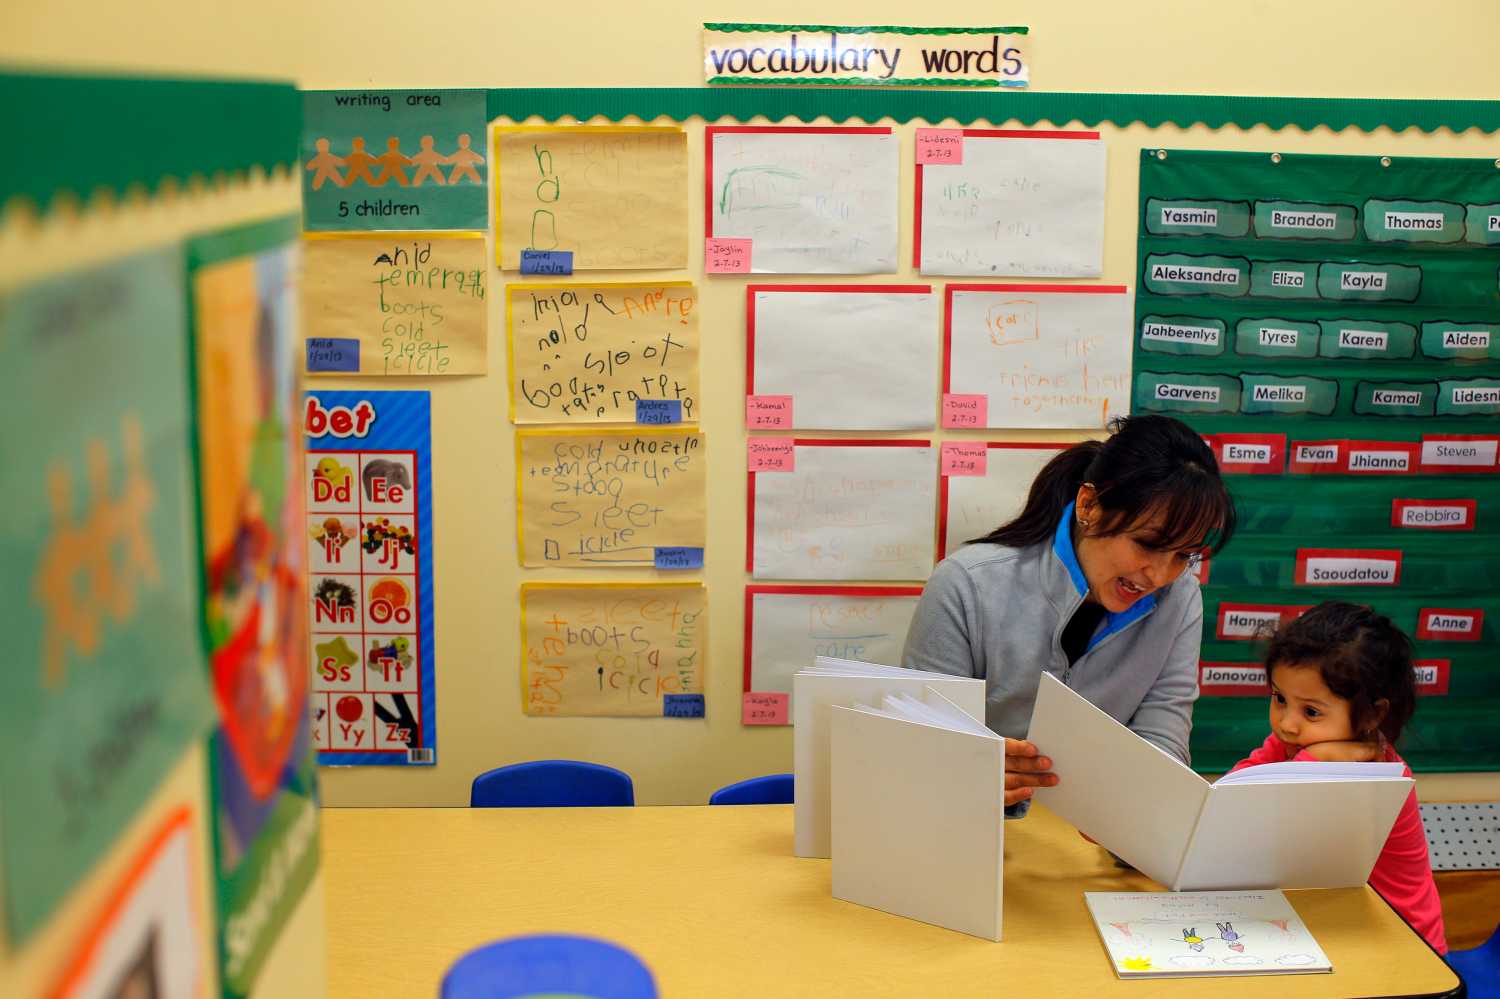
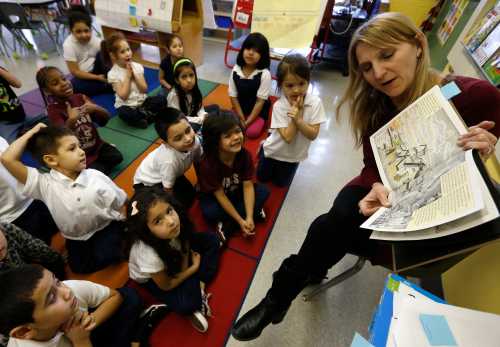
Here I address the question of whether state pre-K improves students’ academic achievement in elementary school. This is surely not the only valuable outcome that is posited by pre-K advocates, e.g., noncognitive effects that play out in later life are increasingly part of the popular model of why preschool is valuable. But the goal of increasing school readiness and thereby later academic success is at the core of the preschool movement. For example, the statutory mission of Head Start, the federal preschool program founded in 1965, is “to promote the school readiness of low-income children”.4
The strongest evidence on elementary school impacts of state pre-K would come in the form of randomized trials of scaled-up state pre-K programs with follow-up of children in the treatment and controls groups as they progress through elementary school. There is only one such study: Children of parents seeking enrollment of their children in the Tennessee Voluntary Pre-K Program (TVPK) were randomly assigned to be admitted to the program or not. Outcomes have been tracked through third grade. The findings as described by the authors in their peer-reviewed report of the study are that:5
- positive achievement effects at the end of pre-K reversed and began favoring the control children by 2nd and 3rd grade;
- TVPK participants had more disciplinary infractions and special education placements by 3rd grade than control children; and
- no effects of VPK were found on attendance or retention in the later grades.
As critics have pointed out, this is only one study of one state pre-K program at one point in time. There may be something anomalous about the TVPK program itself that caused the surprising negative impacts of pre-K participation on academic achievement and socio-emotional outcomes in later grades.
Who knows how long we will have to wait for another randomized trial of a state pre-K program with follow-up of participants through the school years? In the meantime, it may be informative to examine other types of evidence to determine whether there are patterns of data that would strengthen confidence that the TVPK findings are generalizable, or call those findings into question.
I explore the association between different levels among the states of enrollment of four-year-olds in state pre-K and differences in the performance of students in those states on the National Assessment of Educational Progress (NAEP) five years later. Do states that enroll more of their four-year-olds in state pre-K in a given year have higher scores on NAEP when those children reach fourth grade than states with lower levels of pre-K enrollment?
Only a randomized trial or something similar would assure that there are no differences among states being compared that would affect NAEP scores other than their dosage of state pre-K. The opportunity to carry out such a causally rigorous study through planned variation in levels of pre-K provision is long gone.
We can leave it at that and accept the TVPK results as definitive. Or we can carry out epidemiological analyses that fall considerably short of supporting causal certainty but that have the potential of reducing the degree of confusion about whether state pre-K impacts later academic achievement. I follow the latter path. Others have as well, both with studies of individual states that have ramped up their pre-K programs6 and by using, as I do, variation among all states in pre-K access.7
The analyses I carry out are simple, descriptive, and rely entirely on publicly available data. I do not apply the usual array of statistical tools for analyzing panel data because the assumptions those techniques require are not well met with the data at hand, the presentation of their results would interfere with my effort to be transparent to a general audience about the logic of the analysis, and I do not require precise estimates to draw conclusions.8
My approach involves reducing through statistical adjustments the differences among states in the background characteristics of their fourth graders taking NAEP. Family background is the strongest predictor of school achievement, and states vary considerably in the demographics of their school-age populations. If the effects of family background are wrung out of state-level NAEP scores the influence of access to state pre-K is more likely to be visible.
In that context, I carry out an analysis of the association between pre-K enrollment at the state level and state NAEP scores five years later for five separate cohorts of four-year-olds. These are cohorts that participated in NAEP as fourth graders in the spring of 2009, 2011, 2013, 2015, or 2017 (NAEP is administered in the spring of every other school year). These five cohorts were four-year-olds and eligible for whatever pre-K program was offered in their states in the 2003-2004, 2005-2006, 2007-2008, 2009-2010, or 2011-2012 school years. I report the correlation between pre-K enrollment levels in each of five relevant years and NAEP scores five years later.
Data on the percentage of the population of four-year-olds in each state enrolled in state pre-K for each of the five cohorts were transcribed for the present analysis from the relevant annual State of Preschool Yearbook published by the National Institute for Early Education Research.9
The analyses are reported separately for unadjusted NAEP scores as reported in the federal government’s public release of NAEP, as well as for NAEP scores adjusted for five student background variables (age, race/ethnicity, frequency of English spoken at home, special education status, free or reduced-price lunch eligibility, and English language learner status). The adjusted NAEP scores were calculated for America’s Gradebook, produced by the Urban Institute, and are publicly available for download.10
Hawaii is excluded from all analyses reported below because the technical appendix for America’s Gradebook cautions that the adjusted scores for Hawaii may be misleading due to the very high proportion of students in that state who are Native Hawaiian or other Pacific Islander.11 Consistent with that red flag, Hawaii is an extreme outlier if included in the analyses reported below and, thus, is excluded.
The pattern of data that would provide the strongest support for pre-K impact would be: a) positive correlations between levels of state pre-K enrollment and NAEP scores five years later for specific NAEP cohorts; b) larger correlations for adjusted than for unadjusted NAEP scores; c) replications of the pattern of correlations across cohorts; d) increases in pre-K enrollment within states being associated with increases in NAEP scores in those same states; and e) correlations between pre-K enrollment and NAEP scores large enough to suggest that meaningful increases in student achievement could be a consequence of expansion of enrollment in state pre-K.
Correlations between reading and math NAEP scores and state pre-K enrollment five years prior are presented in Figure 1. Reading and math scores are presented separately for each of five years of NAEP testing. Solid bars represent the correlations between pre-K enrollment and adjusted NAEP scores. Patterned bars represent the correlations for unadjusted NAEP scores. Blue bars are for reading whereas orange bars are for math.
 The correlations for unadjusted NAEP scores (patterned bars) are close to zero for reading and slightly negative for math. In other words, for five different years over the most recent 10-year period, the level of enrollment in state pre-K in a given year is not associated with that cohort of students’ unadjusted (raw) NAEP scores as fourth graders. Tell me whether a state has a state pre-K program in a given year and how many children it enrolls, and I can tell you nothing about how that state performs on its federally released NAEP scores in the year that cohort of children reaches fourth grade.
In contrast, the correlations between pre-K enrollment and adjusted NAEP scores are consistently positive for both reading and math, consistently higher for reading than for math, and statistically significant for reading for the 2013 and 2015 testing years. Thus, once we adjust NAEP scores across states so that differences between states in the demographics of their students are neutralized, states with larger state pre-K programs in a given year have fourth graders who do better on NAEP five years later.
Leave aside for the moment the crucial question of whether these positive associations appear to reflect a causal influence of pre-K access on later achievement. Are the correlations large enough, if causal, to suggest that new investments in state pre-K expansion could lead to meaningful improvements in student achievement? The strongest cross-sectional correlation in the data (the r = 0.348 between adjusted NAEP reading scores in 2013 and pre-K enrollment five years prior), if interpreted causally, indicates that a 10 percent increase in state pre-K enrollment would result in less than a one-point increase in a state’s adjusted NAEP reading scores five years later. To put this in context, the standard deviation on NAEP reading at fourth grade for individual students is 38 points and the white-black achievement gap is 26 points.12 A one-point increase on NAEP at the state level would not make a meaningful contribution to the sizable challenge of reducing the large differences in education outcomes for students from different backgrounds.
A causal interpretation of the positive cross-sectional correlations in Figure 1 would be strengthened if the positive association of pre-K enrollment and adjusted NAEP scores held for longitudinal observations within the states. If level of enrollment in state pre-K causes later improvements in school achievement, states that increase their state pre-K enrollment more over time should show larger increases in adjusted NAEP scores than states that increase their pre-K enrollment less (or not at all).
Further, the timing should line up such that a step-up for pre-K enrollment for a state in a given year should be followed in five years by a step-up in adjusted NAEP scores.
Figure 2 addresses the first of these issues, whether states that increase their state pre-K enrollment more over time show larger increases in adjusted NAEP scores. It is a scatterplot of change scores for each state on adjusted NAEP reading between 2009 and 2015 against the change scores for state pre-K enrollment between 2004 and 2010.
 A trend line between these points in close to flat, reflecting the small and statistically insignificant correlation between the two variables of r = 0.078. As expected with essentially a zero correlation, states are equally represented in all four quadrants of pre-K expansion and growth on adjusted NAEP. Lots of states experienced substantial changes in their adjusted NAEP scores with very small to nonexistent changes in their state pre-K enrollment, e.g., Utah, Nevada, Indiana. Others had large increases in pre-K enrollment while being unexceptional in improvements in adjusted NAEP, e.g., Vermont, Iowa.
What about a longitudinal pattern within states in which increases in enrollment in state pre-K are followed in exactly five years by increases in adjusted NAEP scores? The lack of a correlation between growth in enrollment and increases in NAEP disregarding the timing of either, per Figure 2, suggests the futility of looking for a positive correlation that imposes additional temporal requirements. A detailed examination of exactly that relationship by Bartik and Hershbein using a longer series of data and the application of a formal econometric model finds no relationship: “We find no evidence that the average state program affects the average student’s test scores.”13
Florida is an example of a state having a strong cross-sectional association between state pre-K enrollment and later NAEP scores but not showing the temporal sequence between rising pre-K enrollment and rising NAEP scores that would be expected if pre-K were having a causal effect on later reading achievement. Figure 3 displays the trend line for adjusted NAEP reading scores for Florida, including every testing year for which test scores are available, along with the trend line for the state’s pre-K enrollment as measured five years prior to each NAEP testing.
There is no upward movement in the trend line for NAEP that corresponds with increases in state pre-K enrollment five years prior. If anything, progress in adjusted NAEP reading scores, which had been large in the years before Florida instituted a voluntary state pre-K program, tapered off five years after state pre-K enrollment began to increase dramatically. Florida is not simply an example. Rather it plays an outsized influence in the correlations between pre-K enrollment and lagged NAEP reading scores shown in Figure 1: On average across the testing years, each of the positive correlations in Figure 1 would drop by .07 and the two statistically significant correlations would disappear if Florida were excluded from the data.

What does it mean?
The correlational evidence depicted in Figure 1 is consistent with state pre-K enrollment having a small influence on later reading achievement. However, the evidence presented in Figures 2 and 3 is inconsistent with a direct causal impact of state pre-K enrollment on later reading achievement: Where a causal relationship would lead to the expectation that states that are increasing pre-K access show increasing academic achievement, there is no consistent relationship between increases over time in enrollment and increases over time in adjusted NAEP scores.
The most parsimonious explanation of the disharmony between the cross-sectional data (Figures 1) and the longitudinal data (Figures 2 & 3) is that states that have invested in larger state pre-K programs are also engaged in other education reforms that affect NAEP scores independent of pre-K.
Again, Florida can serve as an example. It has the largest state pre-K program and excellent adjusted NAEP scores, but it has also invested heavily in other state education reforms, including a reading initiative that could have affected NAEP scores during the testing periods covered in the present analysis.14 The longitudinal relationship shown in Figure 3 between rising pre-K enrollment and rising adjusted NAEP reading scores is more consistent with a causative influence of other reforms such as the reading initiative than it is with the influence of pre-K.
What do the present results imply with respect to the generalizability the findings from the only existing large-scale randomized trial of a state pre-K program? There is nothing here that calls the findings from the TVPK into serious question. Specifically, there are no findings in the present data of substantive positive changes in student achievement that can be reasonably attributed to increases in access to state pre-K programs. Such relationships as are found between pre-K enrollment and NAEP achievement are small and not causally persuasive.
How about the consistency or lack there of between the present results, the TVPK findings, and the much larger literature on the effects of preschool on later achievement? I have written extensively about that broader literature and its limitations. I do not have the space here to do much more than point to some of those papers.15 Suffice it to say that the presence of “fadeout” during the school years of the academic effects of pre-K programs is well-documented, pervasive across dozens and dozens of studies, and not in dispute among scholars in the field.16 The results of the present study add information specific to state pre-K programs but should be unsurprising with regard to the general finding of little to no measurable influence of pre-K on fourth grade achievement.
It is important to stress that neither the broader literature nor the present data foreclose the possibility that some state pre-K programs have positive long-term impacts on the achievement of some children; that the positive effects of state pre-K programs “sleep” during the school years but emerge in later life; that differently designed and delivered state pre-K programs or better alignment between state pre-K programs and the public schools could lead to substantive impacts; or that positive effects of state pre-K play out primarily through pathways of family financial support rather than children’s early learning in center-based care.17 These are all hypotheses that can be pursued.
I have argued elsewhere that the policy path forward for the center-based care and education of young children is muddled.18 The present analysis reinforces that judgment. Putting nearly all our eggs in the same basket — enhancing access to state pre-K for four-year-olds – shows little evidence to date of having a substantive payoff in later school achievement. It is time for enthusiasts for increased investments in state pre-K to confront the evidence that it does not enhance student achievement meaningfully. They need to temper their enthusiasm for more of the same and, instead, support testing of other approaches that appear promising.19
Author

-
Footnotes
- http://nieer.org/wp-content/uploads/2018/04/YB2017_Executive-Summary.pdf
- https://obamawhitehouse.archives.gov/the-press-office/2014/01/28/president-barack-obamas-state-union-address
- https://www.ffyf.org/governors-focus-early-childhood-education-state-state-addresses/
- https://eclkc.ohs.acf.hhs.gov/policy/head-start-act/sec-636-statement-purpose
- Lipsey, M.W., Farran, D.C., & Durkin, K. (2018, in press) Effects of the Tennessee Prekindergarten Program on children’s achievement and behavior through third grade. Early Childhood Research Quarterly, available online 21 April 2018.
- https://www.brookings.edu/wp-content/uploads/2016/07/2013b_cascio_preschool_education.pdf
- https://www.irp.wisc.edu/newsevents/workshops/2017/participants/papers/9-Bartik-Hershbein-03012017-SRW-2017.pdf
- Several years ago I reported findings from a related but very preliminary effort to address the same questions. At that point there were insufficient data to examine multiple years of NAEP testing and to use lagged correlations. Nevertheless, the findings were similar.
- The pre-K enrollment numbers for the 2003-2004 year appear in the appendix of the 2005 yearbook rather than in the 2004 yearbook. Also, the 2003-2004 numbers are presented in a different form (disaggregated by type of state provider) than in subsequent yearbooks (which provide a summary number for all state pre-K enrollment).
- https://github.com/UrbanInstitute/naep
- http://apps.urban.org/features/naep/naep-technical-appendix.pdf
- https://nces.ed.gov/programs/coe/pdf/coe_cnb.pdf
- https://www.irp.wisc.edu/newsevents/workshops/2017/participants/papers/9-Bartik-Hershbein-03012017-SRW-2017.pdf
- https://psy.fsu.edu/php/about/history/fcrr.html
- https://www.brookings.edu/research/does-pre-k-work-it-depends-how-picky-you-are/; https://www.brookings.edu/research/can-we-be-hard-headed-about-preschool-a-look-at-universal-and-targeted-pre-k/; https://www.brookings.edu/research/new-evidence-raises-doubts-on-obamas-preschool-forall/; https://www.brookings.edu/research/rigorous-preschool-research-illuminates-policy-and-why-the-heckman-equation-may-not-compute/
- https://www.ncbi.nlm.nih.gov/pmc/articles/PMC5779101/
- https://www.brookings.edu/wp-content/uploads/2018/04/report.pdf
- Whitehurst, G.J. (2018, in press). The positive impacts of public pre-K fade quickly, and sometimes reverse: What does this portend for future research and policy? Early Childhood Research Quarterly.
- https://www.brookings.edu/wp-content/uploads/2016/07/Family-support3.pdf
The Brookings Institution is committed to quality, independence, and impact.
We are supported by a diverse array of funders. In line with our values and policies, each Brookings publication represents the sole views of its author(s).