
Since the COVID-19 pandemic began in early 2020, Americans’ migration patterns to other parts of the country have changed in substantial ways. Great attention has been given to migration away from large coastal cities and metro areas, movement to the Sun Belt, and what hybrid work might mean future population shifts.
Census Bureau data released last fall suggests that at least through March 2022 (covering the first two years of the pandemic), the share of the U.S. population that has moved within the country still lies at a historically low level. But there is a new twist: While residential movement—a change of address within the same county—has continued to plummet to its lowest rate since 1947, longer-distance movement across counties and states has picked up.1
In examining data for March 2020 through March 2021 and March 2021 through March 2022, it is important to recognize the reasons for such changes in migration dynamics. The 2020-21 period marked the first year of the pandemic, during which COVID-19 vaccines were not yet widely available and restrictive public health measures were in effect across much of the country. By 2021-22, most restrictions had been lifted, even as new COVID-19 variants continued to infect large swaths of the population.
There is no question that overall movement within the U.S. is still historically low. Yet some aspects of local migration patterns suggest a transformation could be in the offing, and the small rise in longer-distance movement might signal greater population shifts as more COVID-19 restrictions are lifted. And should overall migration rise substantially, it could pump even more flows of people into the places that have been gaining the largest population numbers.
The long-term fall in domestic migration
To put the recent migration trends in perspective, it is important to note that movement within the U.S. has slowed dramatically since its highs during the post-World War II decades. This is evident from the Census Bureau’s Current Population Survey, which has tracked domestic movement over one-year periods from 1947-48 to 2021-22 (see Figure 1). These moves reflect all distances, from local to across states, and do not include temporary moves.2
In 2021-22, the overall migration rate stood at 8.7%—just modestly higher than the 2020-21 rate of 8.4%, which was the lowest domestic migration rate in three-quarters of a century.
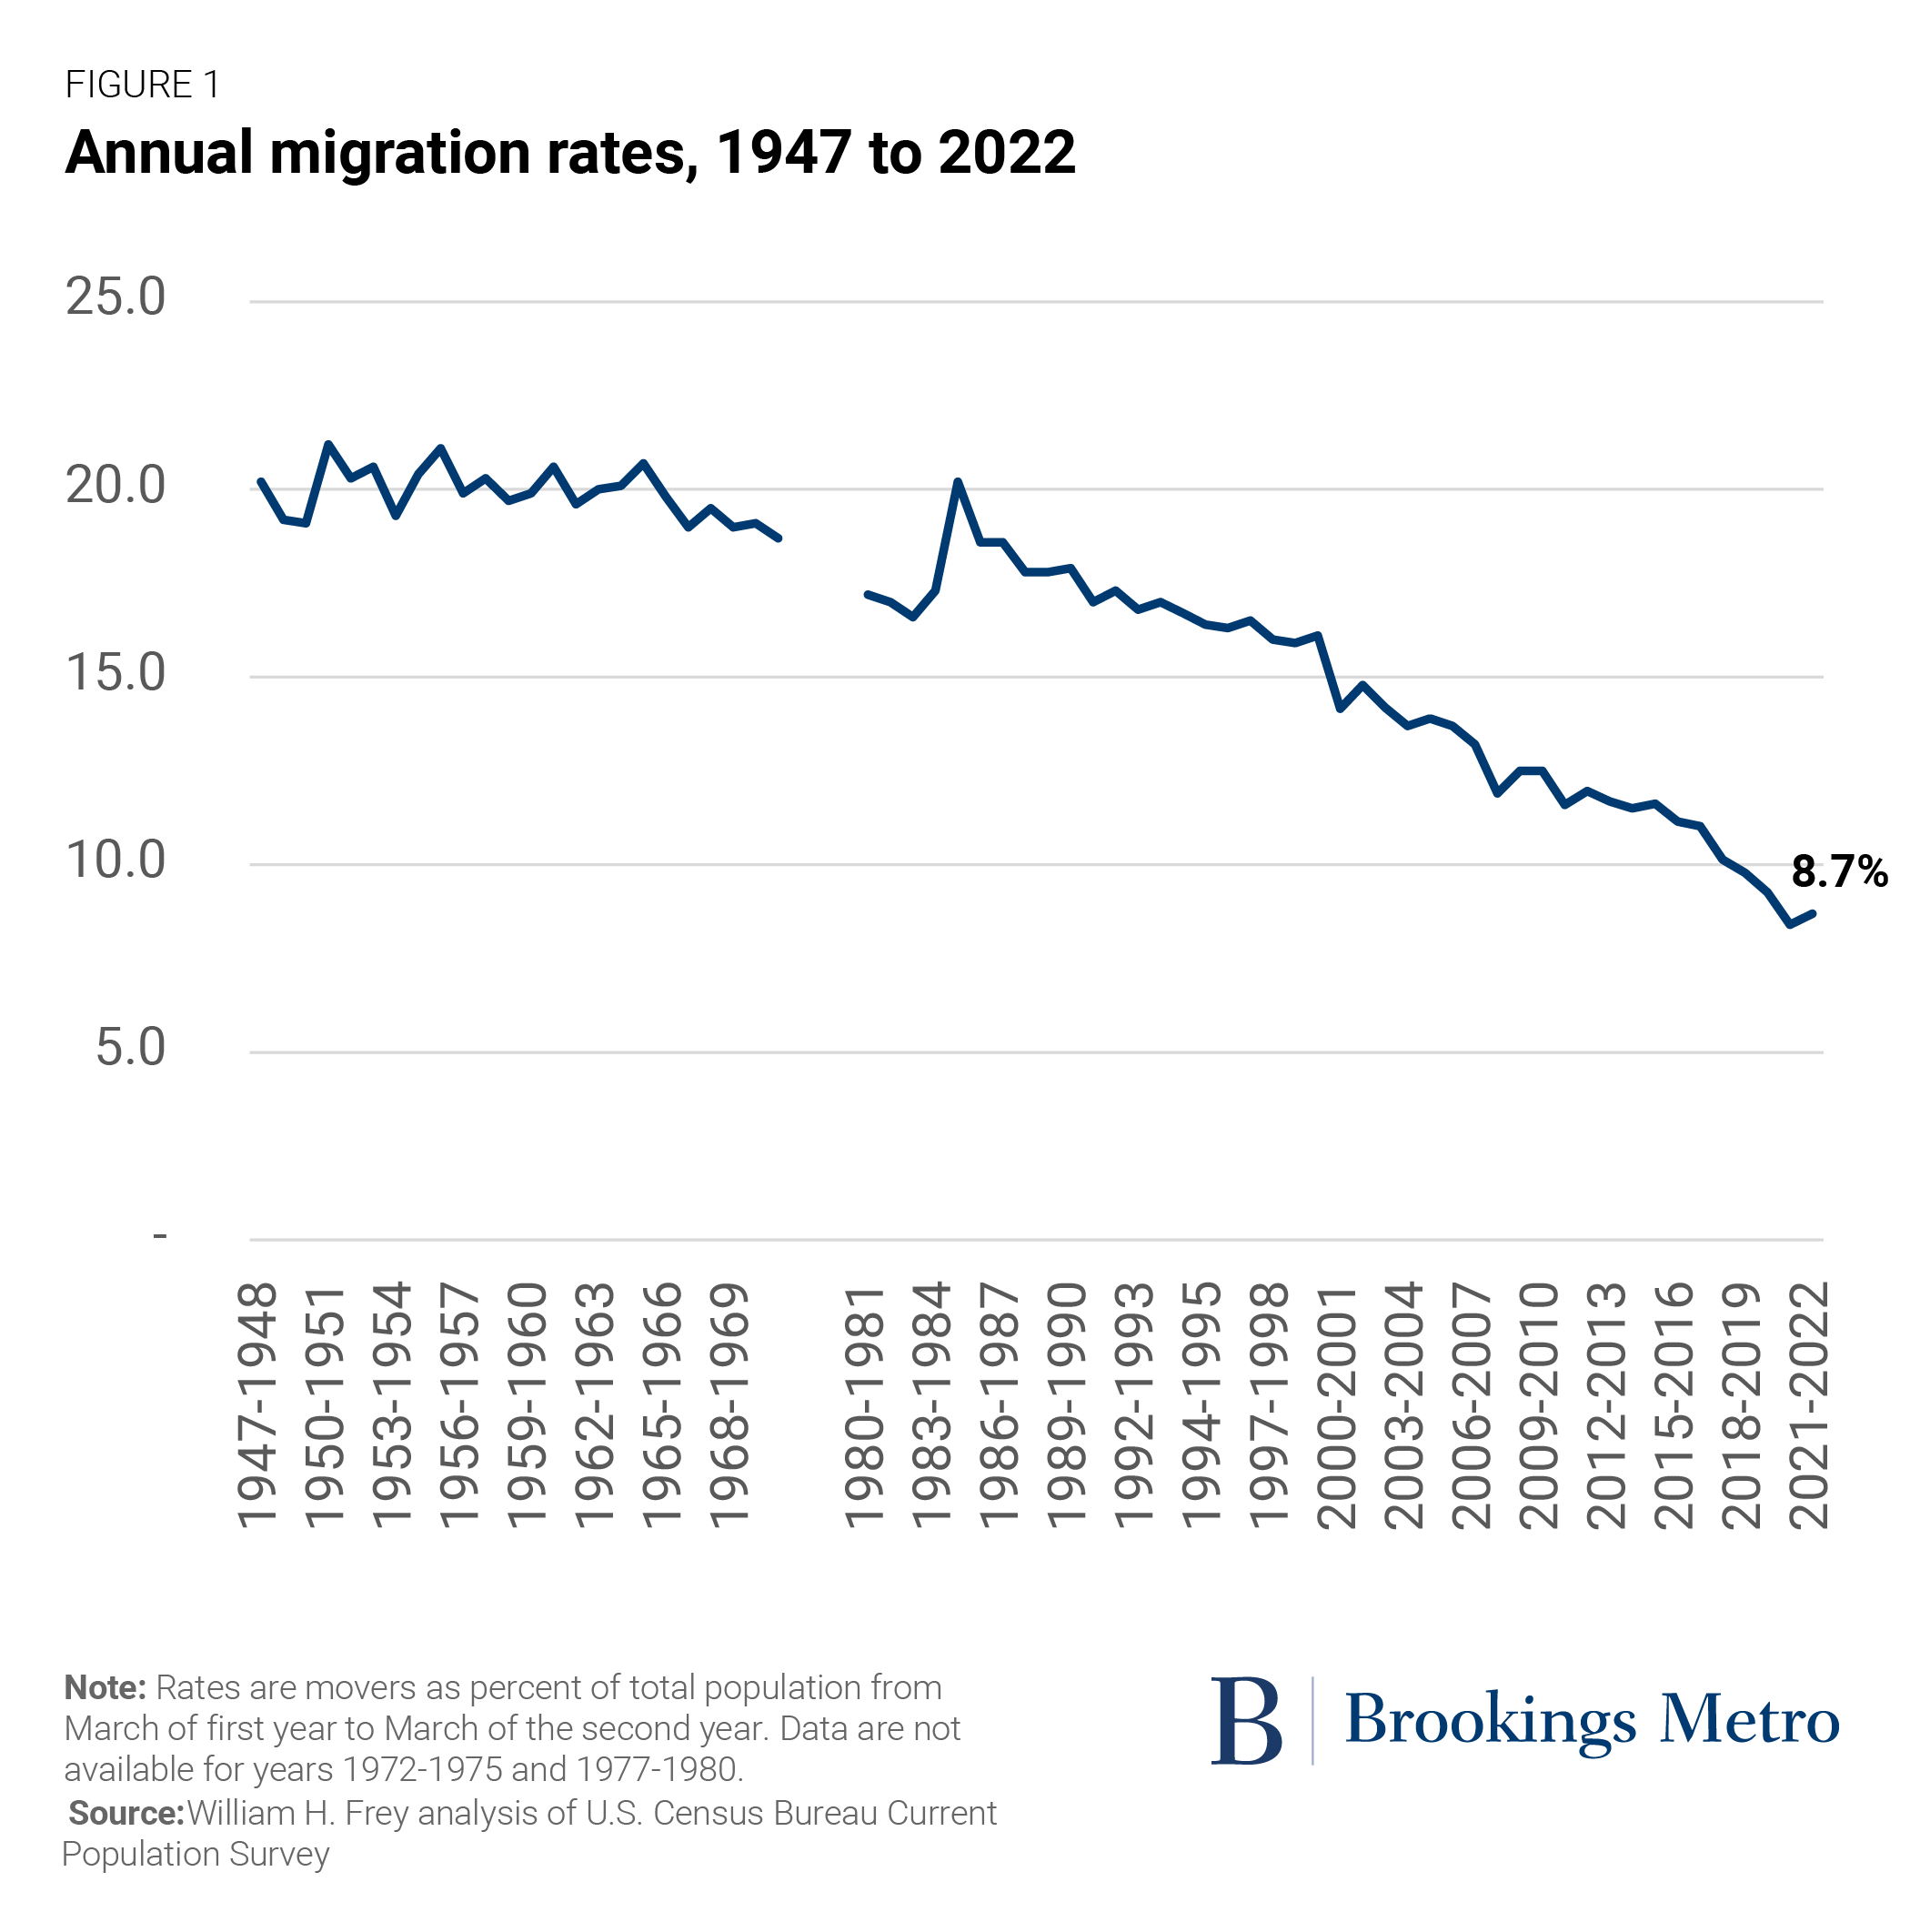
The recent rates are a far cry from the late 1940s through 1960s, when roughly 20% of Americans moved annually. Back then, the U.S. population was younger and more likely to rent homes (young people and renters have higher migration rates than older age groups and homeowners). There were also more single-earner households, making it less difficult to move the entire household when that earner found a job elsewhere.
But in subsequent decades, the population and housing profiles of Americans changed. The population became older, with fewer renters and more dual-earner households, and labor markets become less distinct in the kinds of jobs they offered. Thus, migration rates gradually shrunk—to roughly 17% in the 1980s, 16% in the 1990s, and 13% to 14% in the early 2000s. The 2007-09 Great Recession and housing crash pushed migration down even further, into the 11% to 12% range. Migration rates continued to fall in the 2010s before hitting an all-time low of 8.4% during the first pandemic year of 2020-21.
Clearly, the Great Recession and stagnant real estate market early in the 2010s had already affected migration levels before the pandemic. And at least through March 2022, there was not a substantial uptick in domestic migration among most Americans.
Local movement declined, but longer-distance migration ticked up
A key distinction in domestic migration is between short-distance residential movement and longer-distance movement. The former is largely motivated by changes in family living arrangements or housing needs that can be met by moving locally. For longer-distance movement, employment opportunities in different parts of the country play a bigger role.
Census Bureau statistics have typically shown that shorter-distance moves—defined as those within the same county of residence—account for the bulk (at least 60%) of all domestic moves, and thus contribute heavily to overall migration patterns.
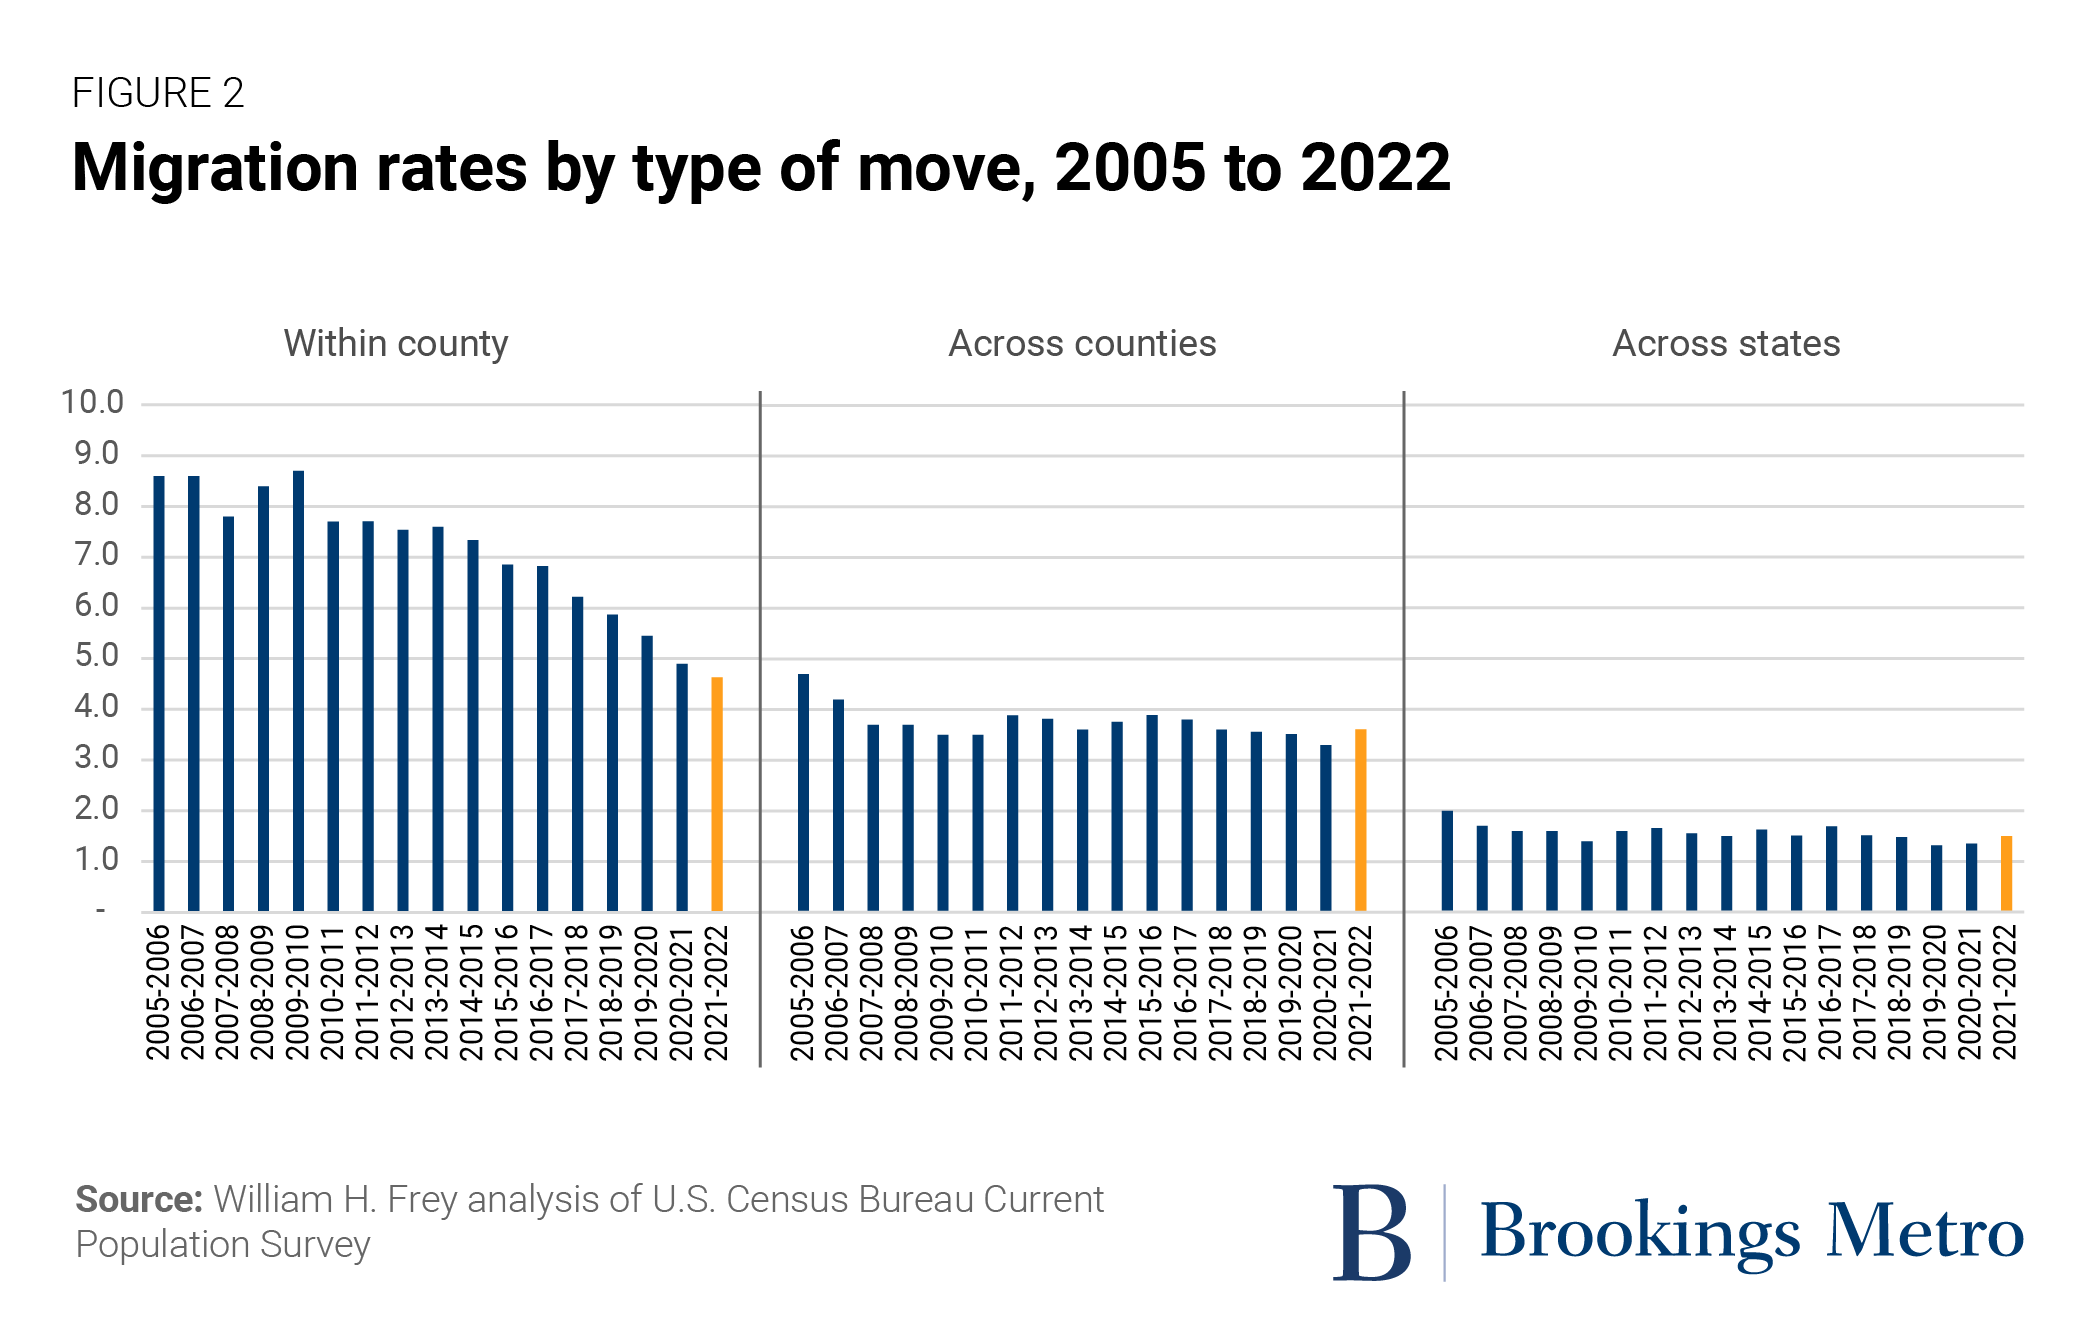
In recent years, it was the downward trend in shorter-distance moves that drove the overall decline in domestic migration. This has been the case since 2009 (on the heels of the Great Recession and housing bust), but especially since 2016-17. The annual rate of within-county movement declined from 8.7% in 2009-10 to 4.6% in 2021-22—the latter being lower than in the first pandemic year and lower than any year since the Census Bureau first began reporting these rates.
This contrasts with trends in longer-distance moves across counties or states. These rates are generally lower than within-county rates, and the most recent rates are lower than during most previous years. Still, as Figure 2 shows, movement across both counties and states rose slightly in 2021-22. These rises are responsible for the small recent gain in overall domestic migration, suggesting that longer-distance moves contributed to noticeable population shifts over the course of the pandemic.
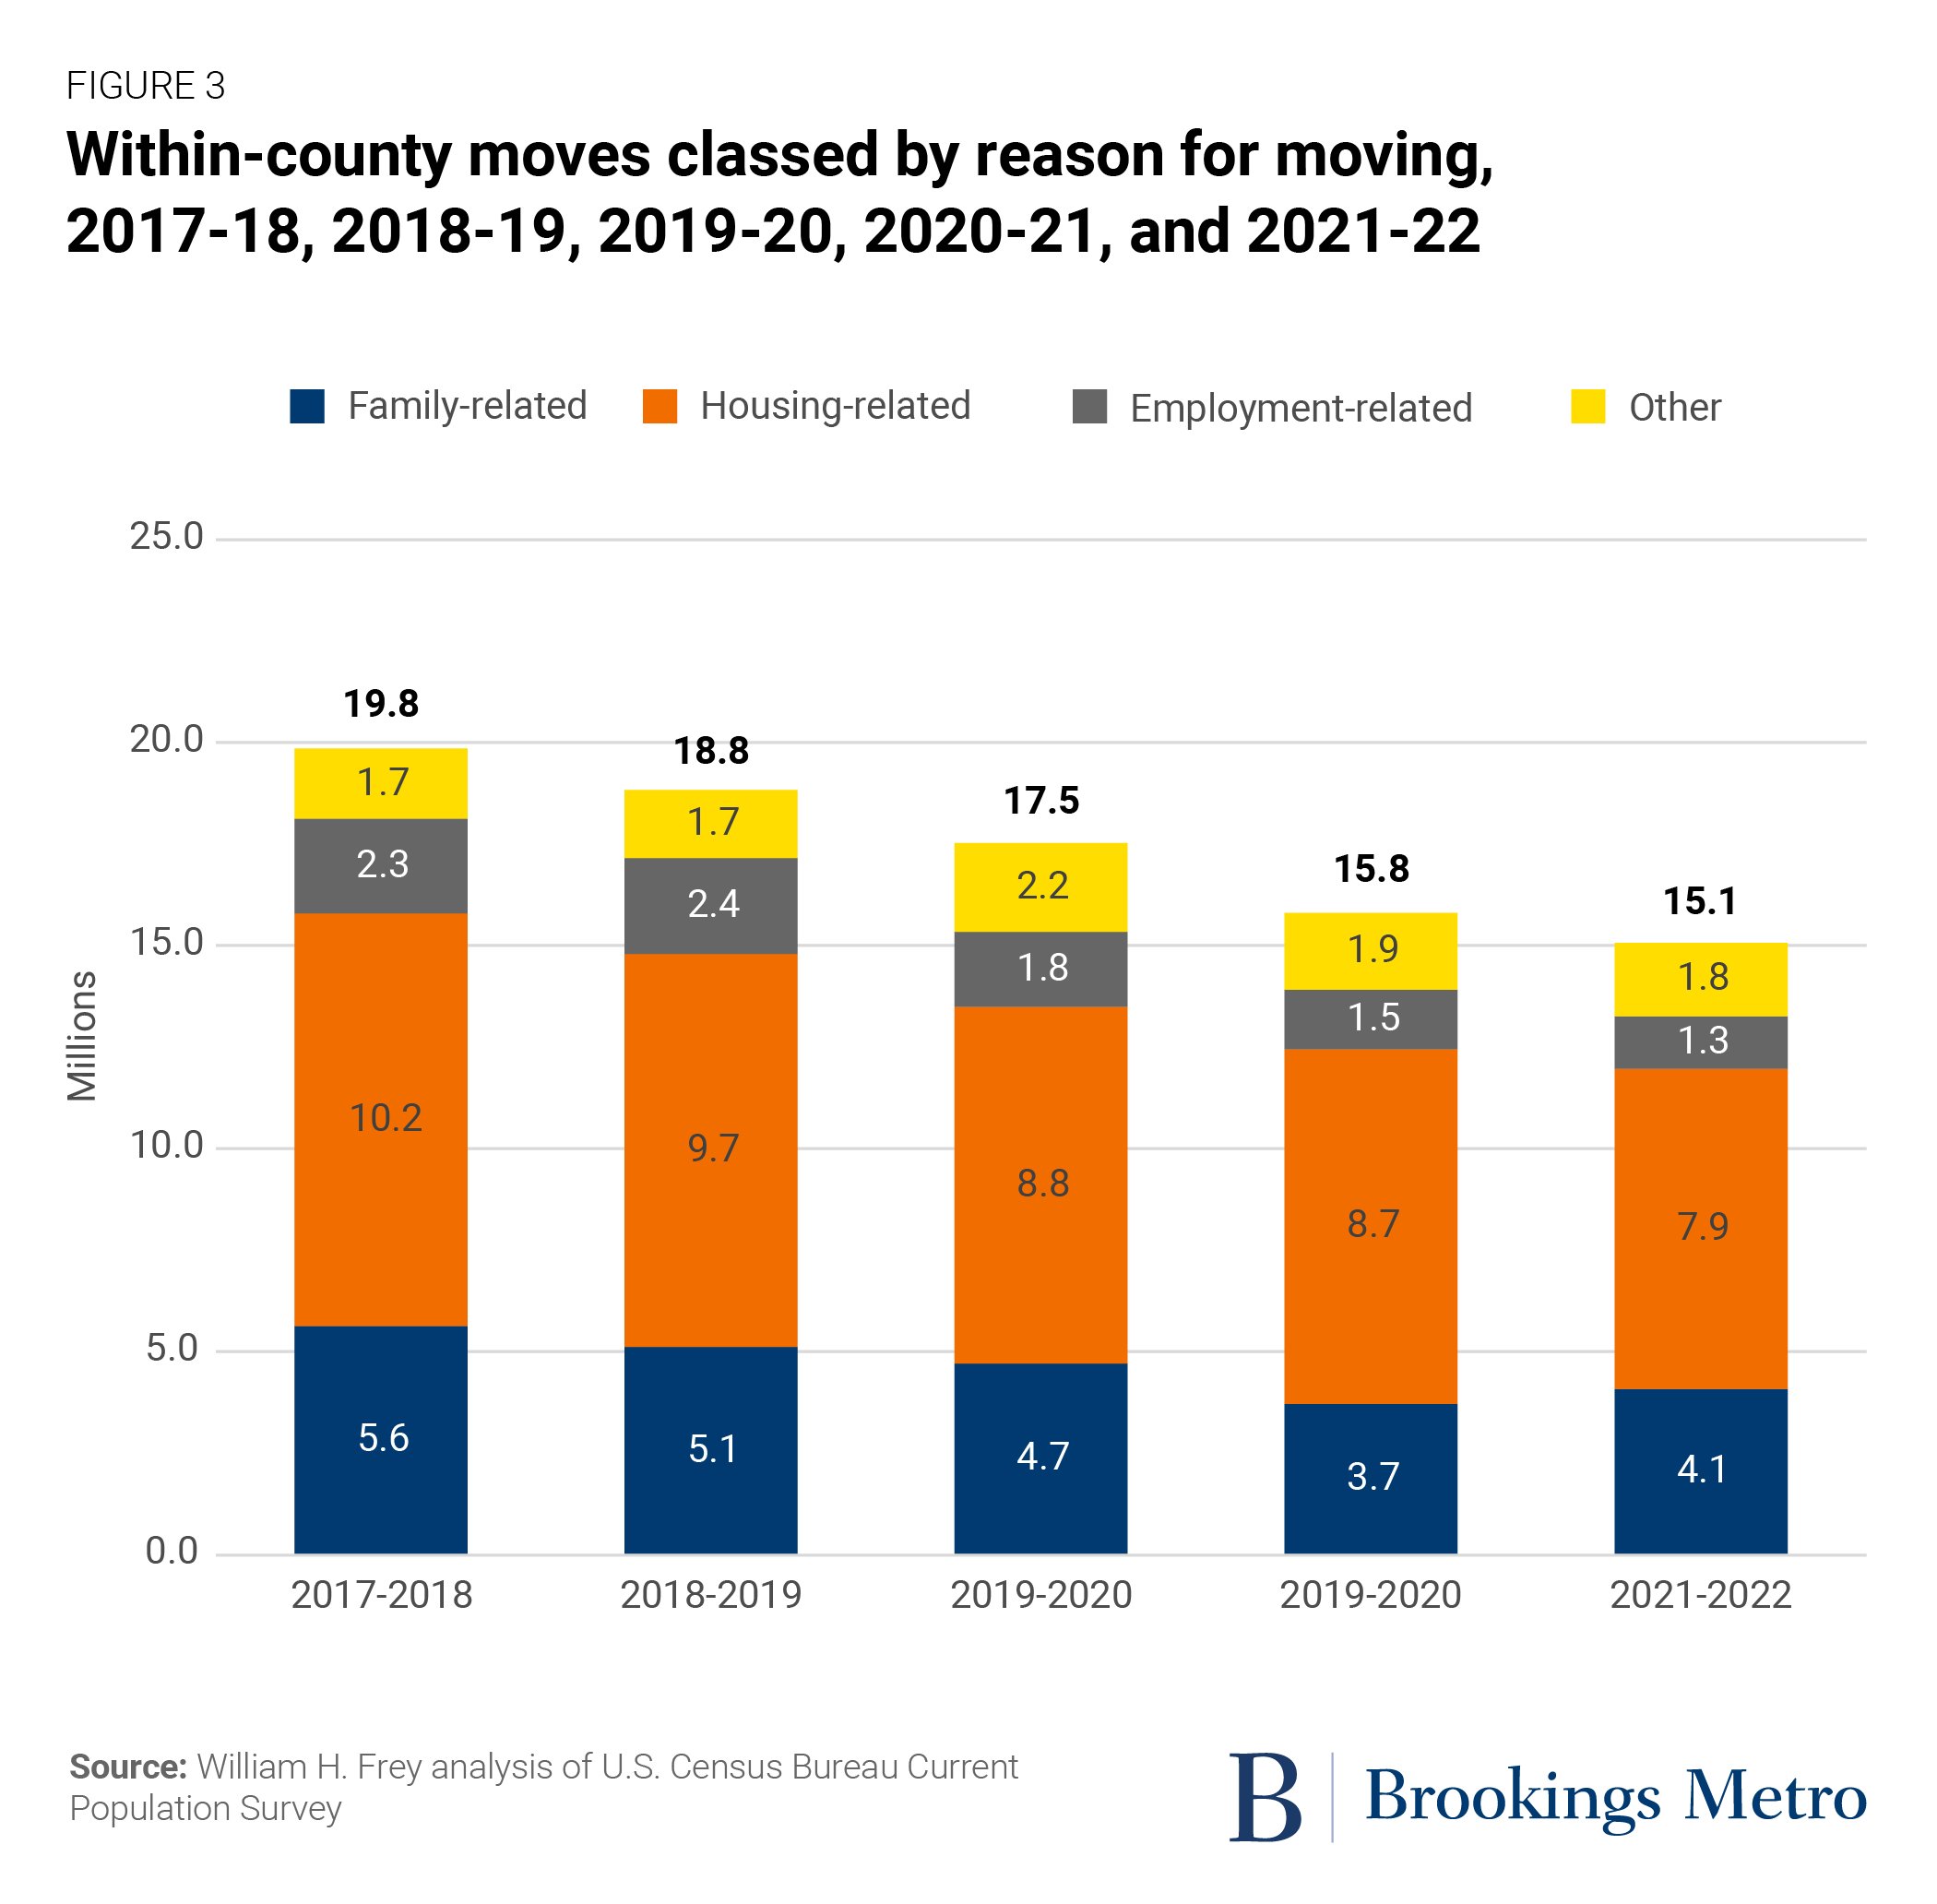
Census Bureau survey data also permits analysis of respondents’ reasons for short-distance moves (see Figure 3). The reasons are classed according to broad categories: family-related, housing-related, employment-related, or other.3In each year from 2017-18 to 2021-22, the number of within-county moves for housing-related reasons was larger than that for family-related reasons, and far larger than employment-related reasons. Still, over that five-year period, housing-related moves saw the biggest declines; between 2020-21 and 2021-22, this decline was especially pronounced among respondents who said they were looking for cheaper housing or a newer, better, or larger house or apartment. The greatest decline in employment-related moves were for those who wanted to live closer to work or have an easier commute.
In contrast, there were more family-related moves in 2021-22 than in the first pandemic year, especially among respondents who said they wanted to establish a new household or reported a change in marital status. This suggests that the existing households drove the overall decline in within-county moves in 2021-2022, rather than it resulting from a decline in the establishment of new households.
Young adult movers are driving recent trends
As mentioned earlier, younger people show higher mobility rates than those in older age groups. Younger adults and families are more prone to move to establish households, buy new homes, and start careers. However, the recent decline in overall migration is accentuated among young adults and their children.
Figure 4 depicts overall migration rates by age for the years 1990-91, 2005-06 (the year before the Great Recession), and 2021-2022.
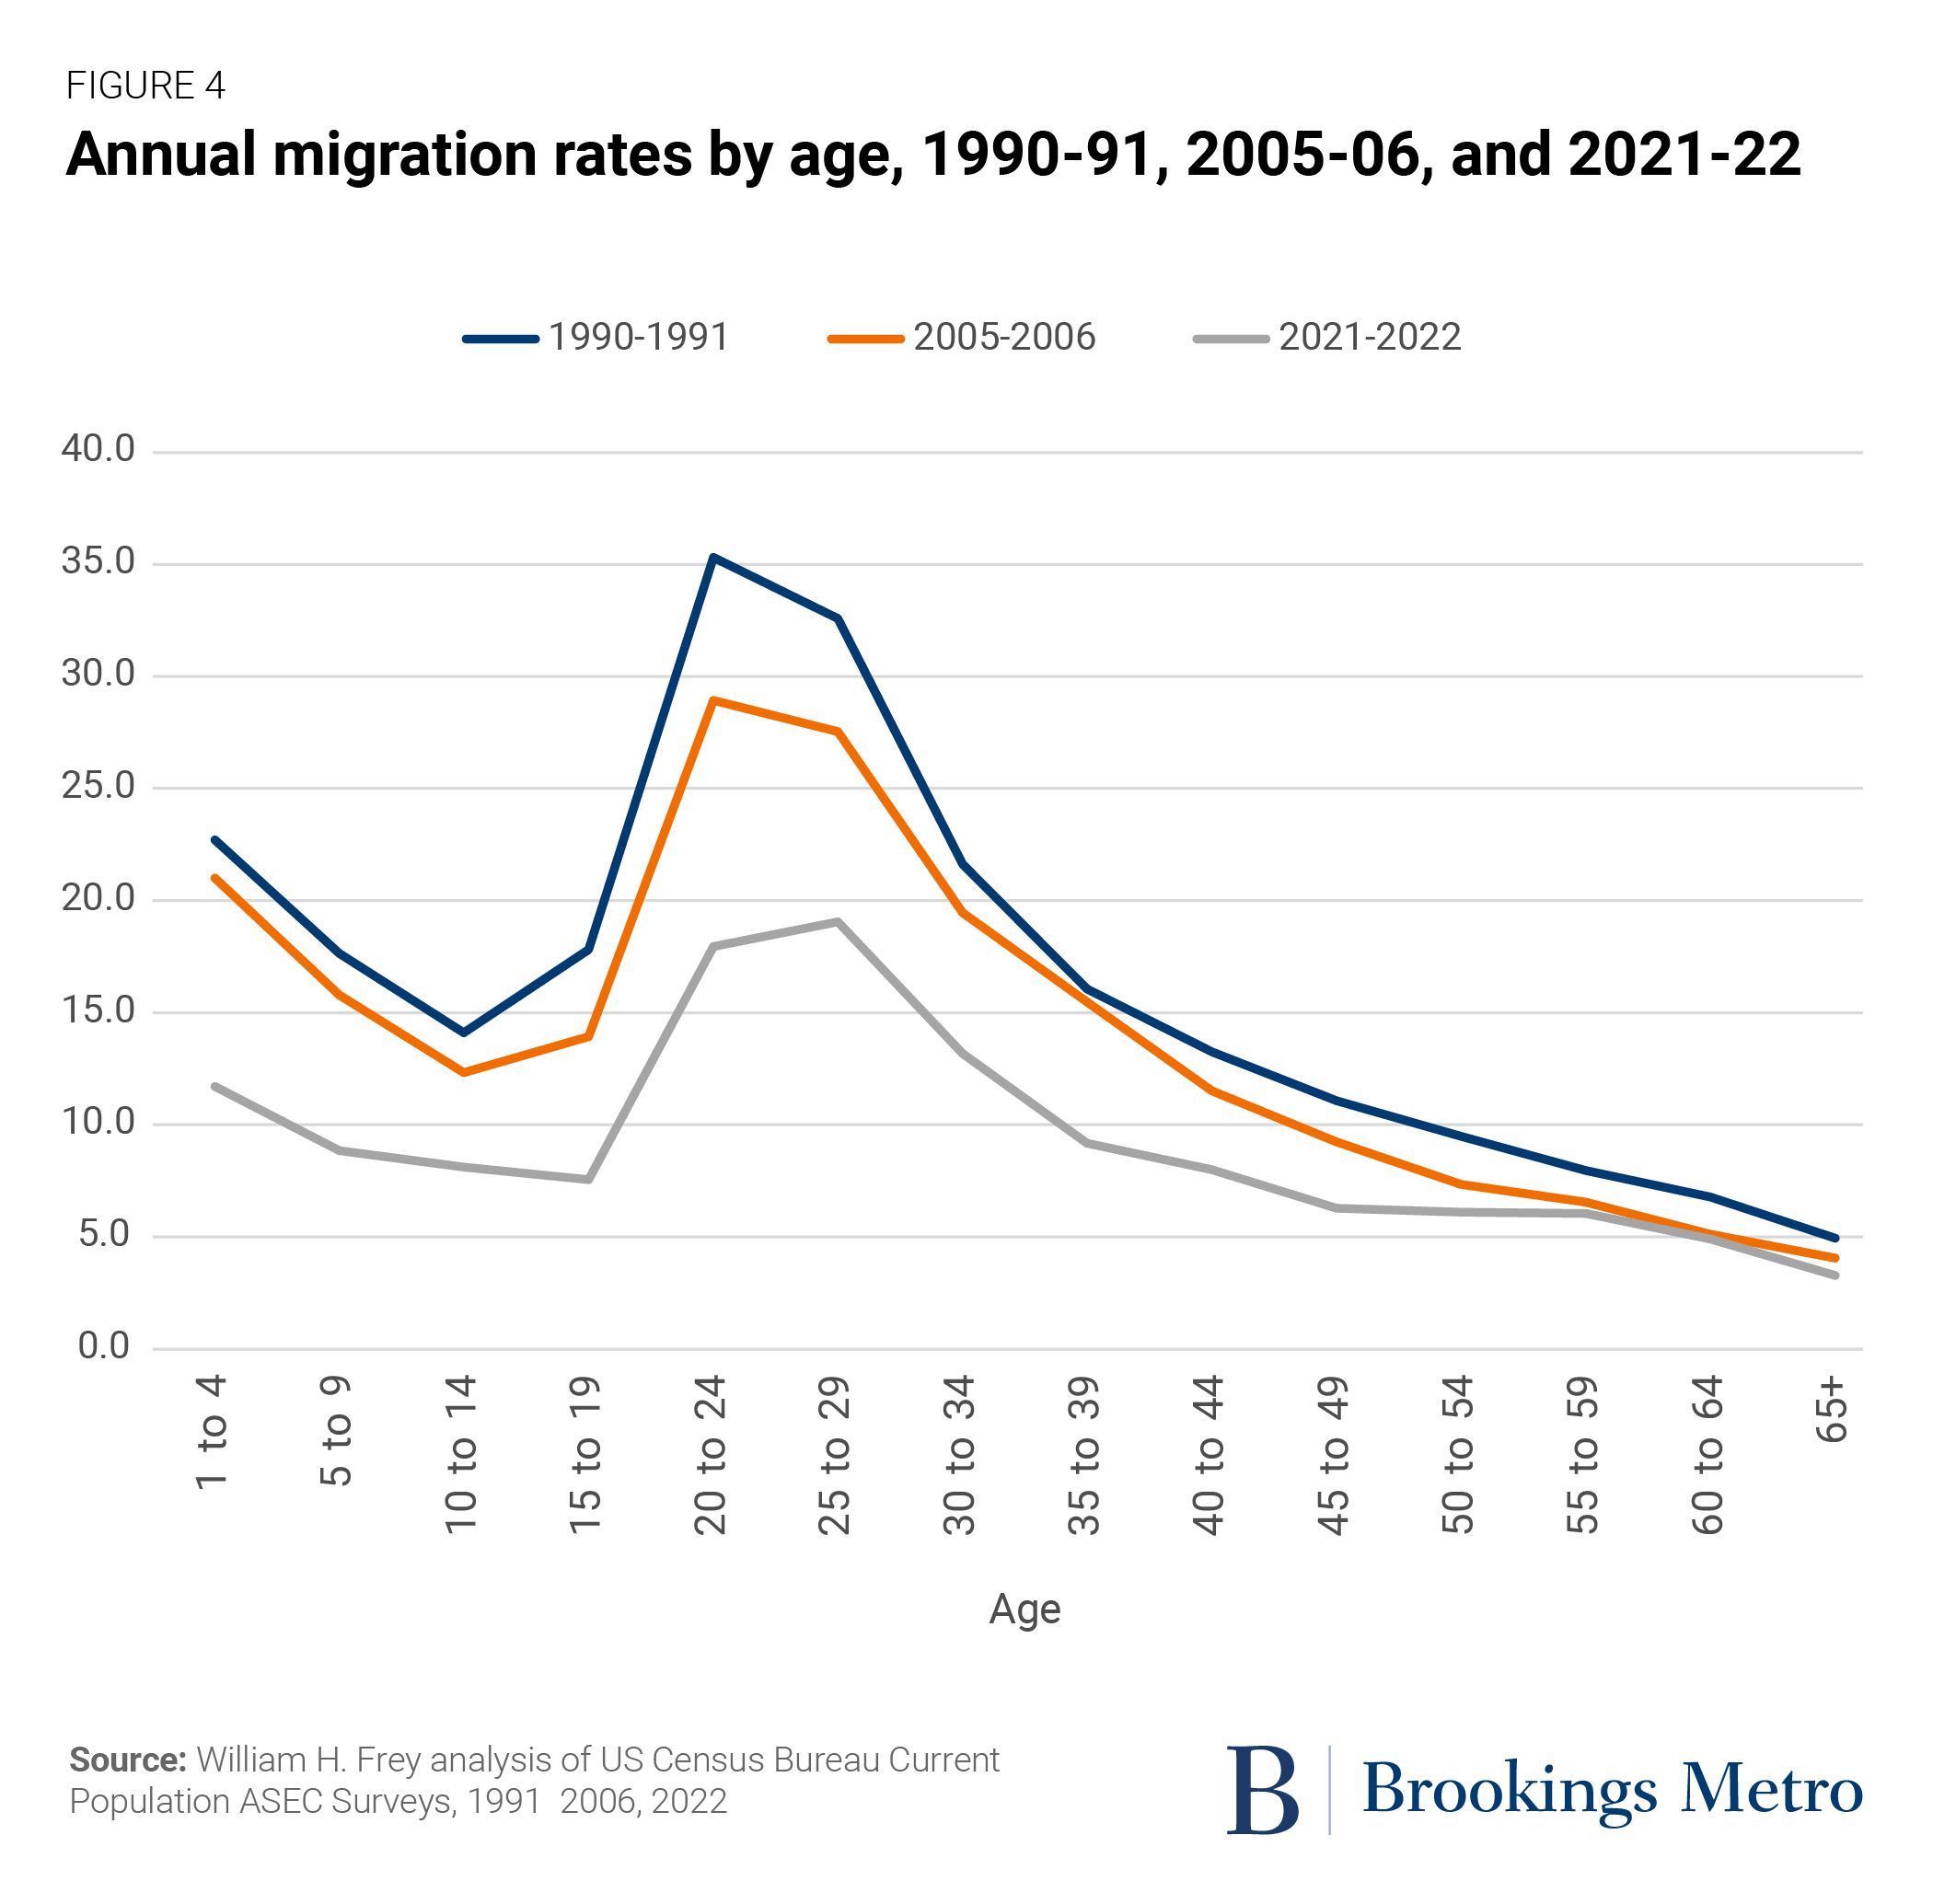
The highest migration rates in all three years occur among young adults ages 20 to 34 and children under age 10 (the latter group largely reflecting children of the former). Yet the greatest reduction in migration over these years occurred for these same age groups, especially between the Great Recession and the pandemic.
An important reason for this decline had to do with young adult millennials who bore much of the brunt of the Great Recession, which delayed their ability to start families, buy homes, and move to jobs in new destinations. This led to a sharp decline in migration among the age groups they inhabited.
For this reason, it is useful to see how young adult migration has changed for persons ages 25 to 34 since the Great Recession years and both prior to and during the pandemic. (Moves for persons ages 25 to 34 are more likely to be permanent than those among other young adult groups). Figure 5 shows migration rates separately for within-county, across-county, and across-state moves.
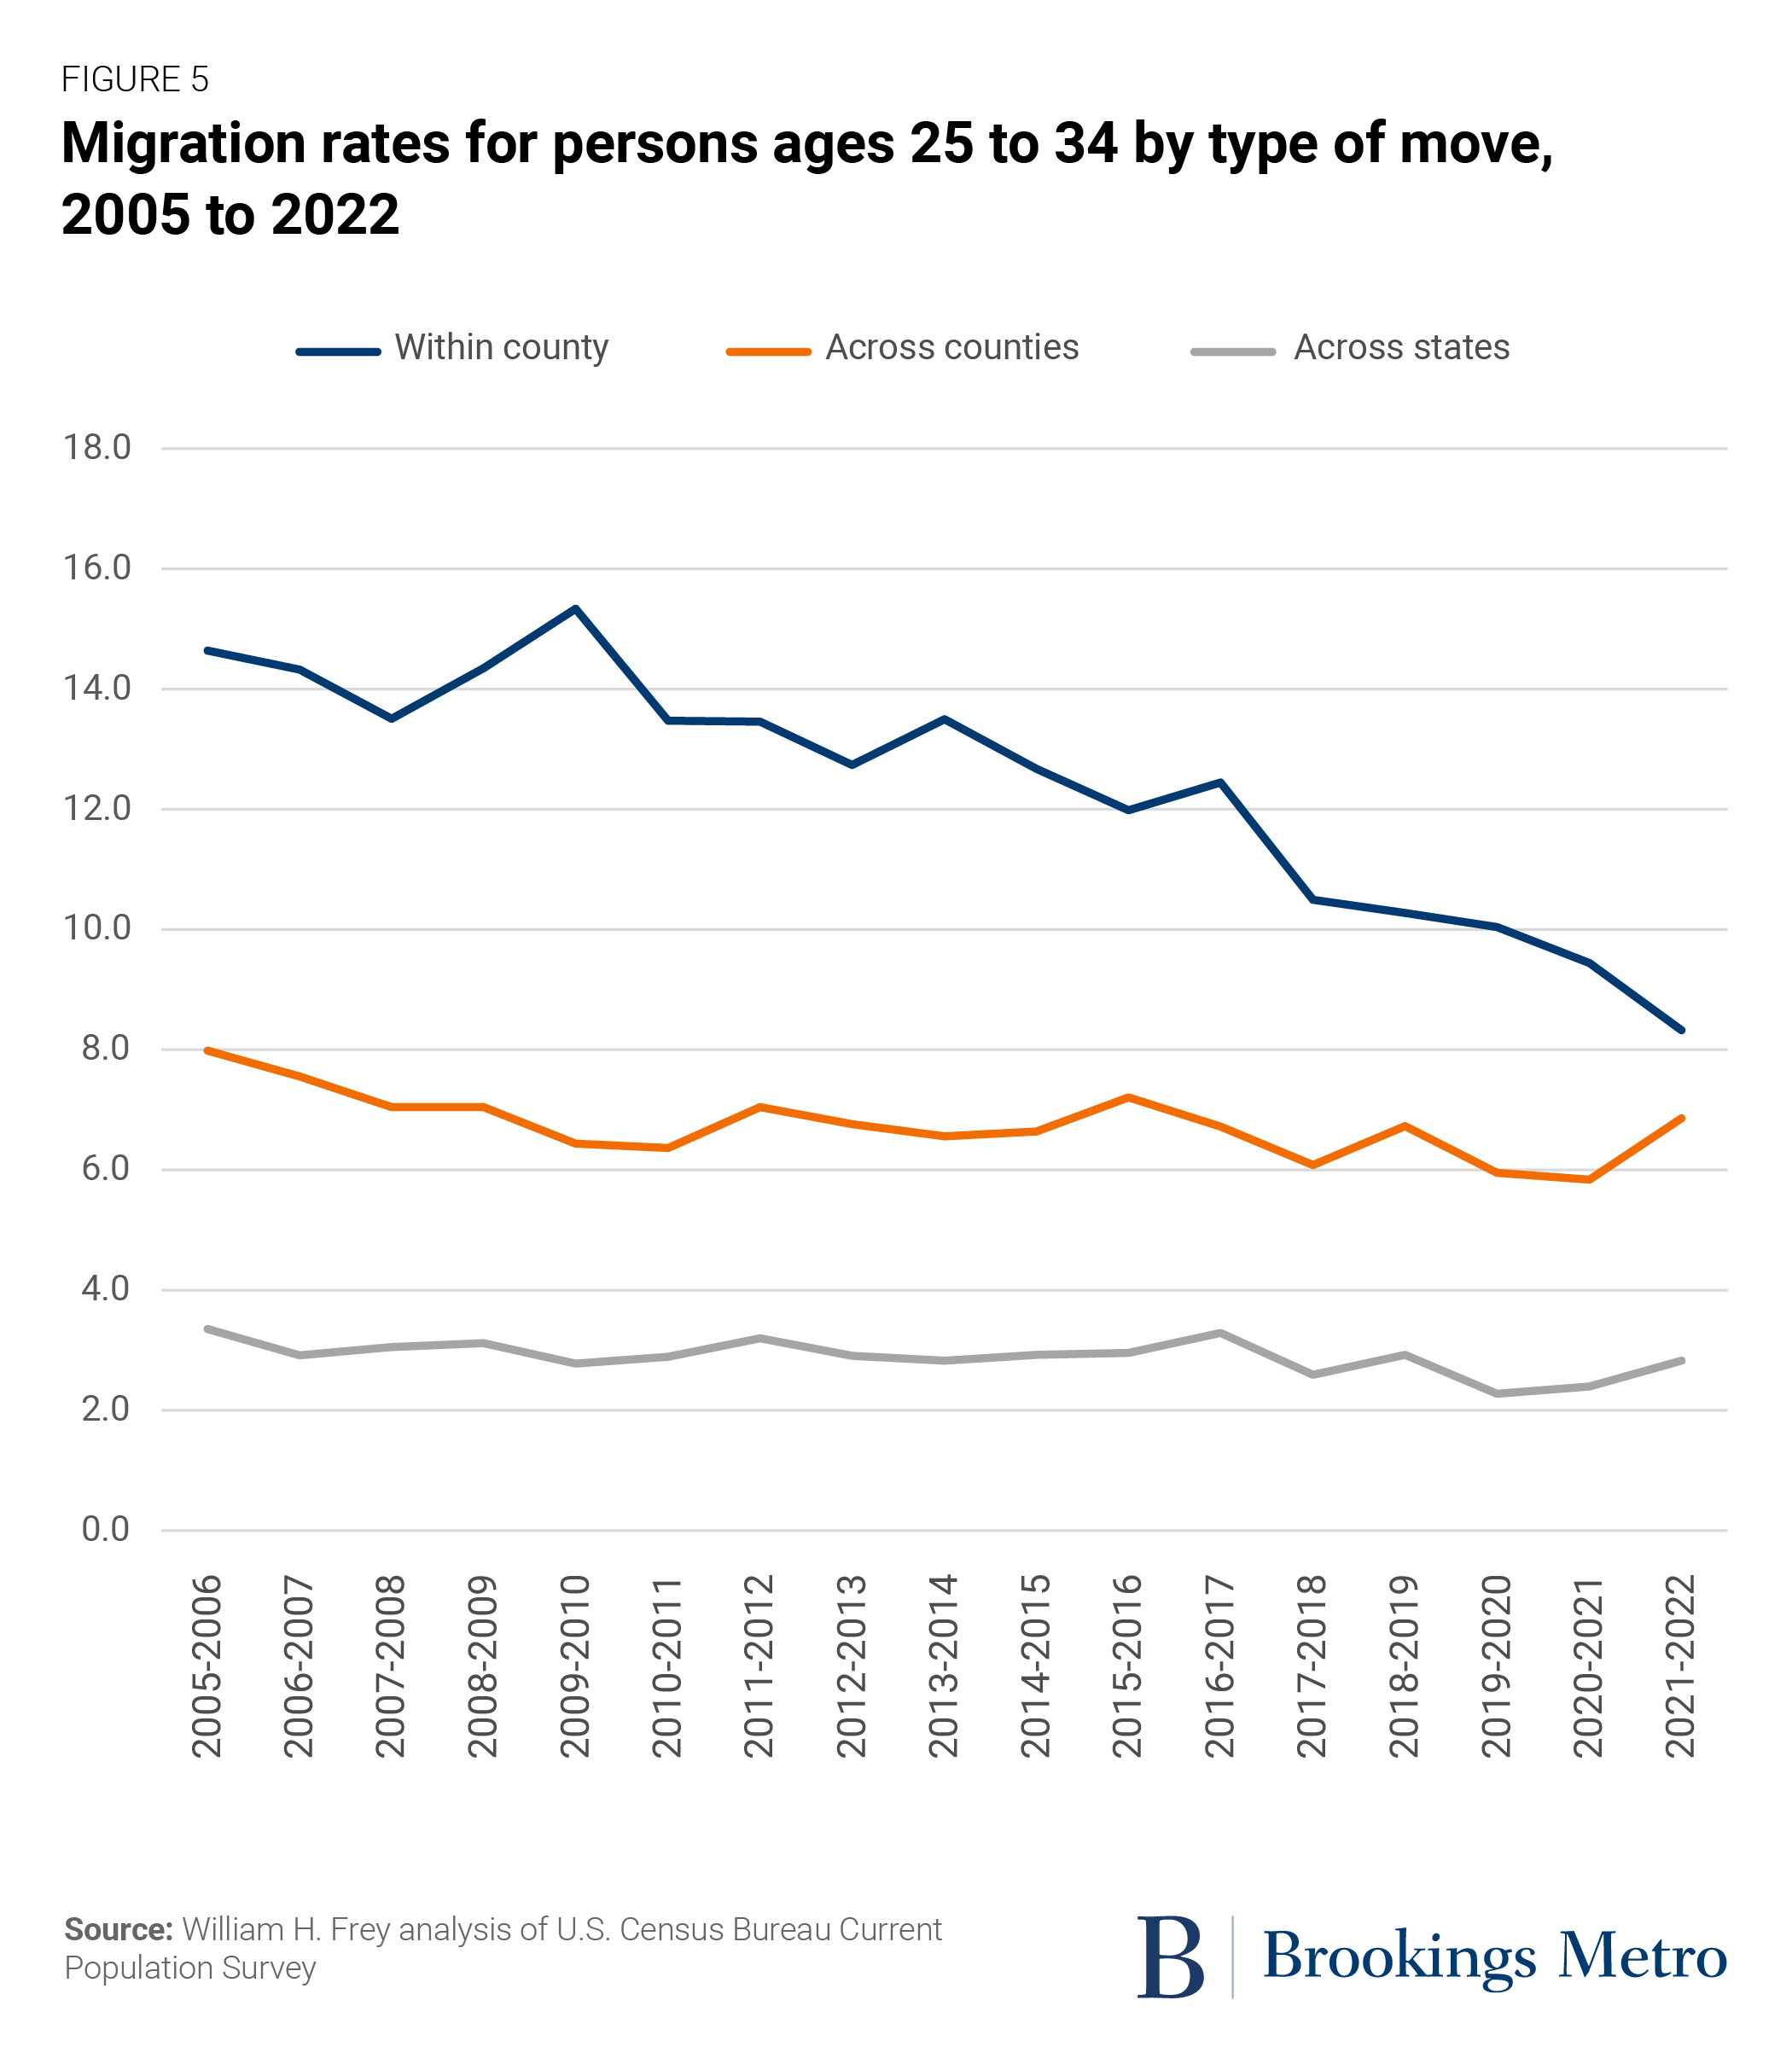
This age group’s within-county migration trends mimic those of the overall population for the years prior to and during the pandemic, with rates moving downward since their high of 15.3% in 2009-10. There was an especially sharp decline from 12.4% in 2016-17 to 9.4% in 2020-21, and then to 8.3% in 2021-22. Because these movers represent one-third of all adult within-county moves, it is clear that the downturn of young adult migration powered the overall trends discussed earlier.
In contrast, both across-county and across-state young adult migration showed rises in 2021-22 compared to the first pandemic year. Thus, they helped to bolster the small overall increase in the nation’s longer-distance moves.
A transition year for migration?
These new migration statistics suggest that 2023 could be a year of transition for movement within the United States. As in recent years, short-distance permanent moves continued to dip downward, as fewer existing households moved locally to improve their housing situation or to be closer to work. On the other hand, there was a slight uptick in local moves to establish new households or because of a change in marital status—suggesting that as the pandemic moved into its second year and household formation and childbearing rose, a greater tendency to make a local move rose as well.
Related Books
Also during this second pandemic year, longer-distance moves across counties or states began to pick up, albeit tepidly. These trends may have led to recent aggregate migration shifts to Sun Belt states.
As the pandemic subsides and legal, normative, and informal barriers to in-person interaction continue to be lifted, not only will newly formed households begin to add to national migration rates, but established households may also be more inclined to move. Additionally, longer-distance migration may continue to rise as younger workers become more willing to seek jobs across the country and as employment opportunities respond to the changing nature of work-residence patterns that began during the pandemic.
Although it is too soon to be certain, the new data suggests there is reason to believe that both shorter- and longer-distance movement could pick up from the historic low points registered during the prime pandemic years.
Related Content


Author

-
Footnotes
- The migration data examined here is drawn from the time series of annual migration tables based on the “residence one year ago” question on the Annual Social and Economic Supplement (previously called the March supplement) of the Census Bureau Current Population Survey from 1948 through 2021, and tabulations from the 2022 public use microdata file of that survey, which was released in September 2022. These permit migration calculations over one-year intervals from March 1947 to March 1948 through March 2021 to March 2022.
- Respondents were asked whether or not they resided in the same residence as one year ago. These reflect permanent moves wherein persons report different addresses from the year before, thus discounting temporary moves which may have occurred over the course of the year.
- Within these broad categories, more detailed subcategories were also recorded. For example, among family-related moves, subcategories include a change in marital status, establishing one’s own household, or other. Among housing-related moves, subcategories include wanting to own a home rather than rent, wanting newer/better/larger housing, wanting cheaper housing, foreclosure/eviction, and more. Among employment-related moves, subcategories include a new job or job transfer, looking for work, a lost job, moving closer to work/easier commute, retirement, and more.
The Brookings Institution is committed to quality, independence, and impact.
We are supported by a diverse array of funders. In line with our values and policies, each Brookings publication represents the sole views of its author(s).