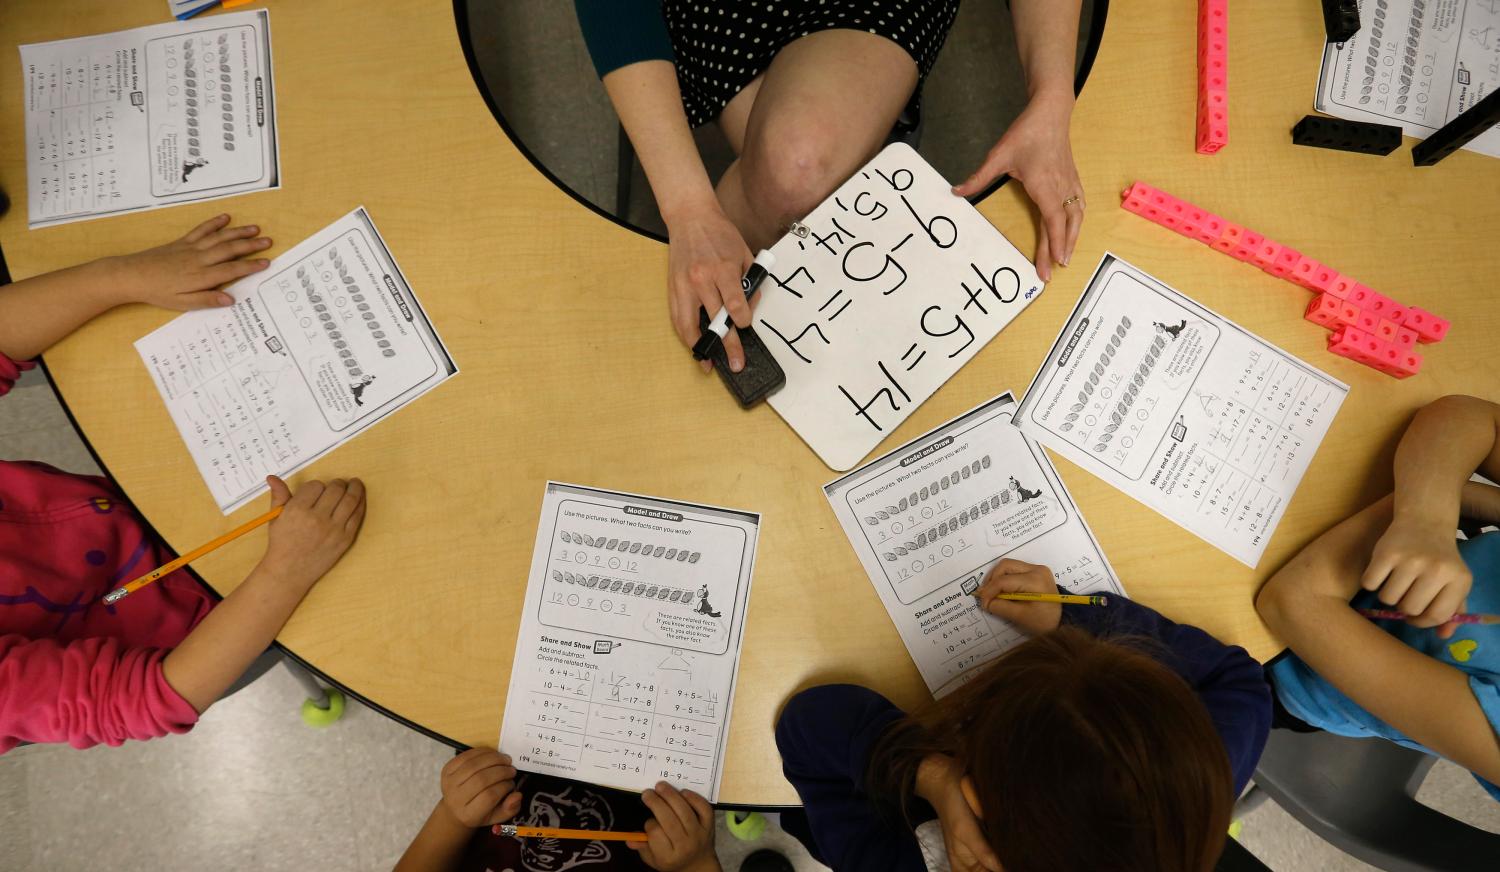
Early childhood education in the United States is tangle of options—varying in quality, price, structure, and a range of other dimensions. In part as a result, children start kindergarten having had very different experiences in care and very different opportunities to develop the skills and dispositions that will serve them well during school. Systematic differences across groups by income, race, ethnicity, home language, and geographic location are particularly troubling because inequalities that appear early are often sustained through school and affect prospects throughout life.
Convincing research has demonstrated that high-quality early childhood programs can reduce these differences across groups.1 A few small programs have demonstrated strong positive effects throughout the life cycle, but even some large-scale programs, such as those in Boston and Tulsa have shown effects on math and reading learning.2 These positive results combined with evident need have led to substantial public investment in early childhood education. State spending on preschool more than doubled between 2002 and 2016, from $3.3 to $7.4 billion (constant 2017 dollars).3
However, a range of research also shows that many early childhood programs do not have positive long-term effects. For example, as discussed in an early Evidence Speaks brief, the Tennessee Voluntary Prekindergarten Program showed some positive effects for children as they finished their pre‐k school year; but, these positive were largely gone by the end of kindergarten.4 Program quality likely affects whether programs benefit children and recent investments have focused heavily on quality improvement. The Federal government, for example, invested $1.75 billion between 2011 and 2016 in Race to the Top—Early Learning Challenge and Preschool Development Grants requiring quality-improvement infrastructures and the reauthorization of the Child Care and Development Fund included provisions aimed at increasing quality in the child care sector.5
Governments have several options in trying to improve quality. Regulations—a form of direct control—are one option that have been used widely in both early childhood and K-12 education. With regulations, governments set minimum class sizes, establish education requirements for teachers and safety requirements for classrooms. Regulations, because they are by nature rigid, tend to set floors on quality instead of pushing towards improvement and making use of opportunities. Other approaches to quality improvement are less consistent but more flexible. For example, local government structures such as school boards are set up to oversee schools with voter accountability, though there is little evidence on how effective they are. School choice is another mechanism aimed to give families some influence over the quality of their schools.
Starting in the early 1980s, states and the Federal government have used outcomes-based accountability with the aim of quality improvement for primary and secondary education. While the K-12 sector in the US is far more centralized than early childhood, it is still one of the more decentralized elementary and secondary education systems globally. Instead of schooling decisions—such as curriculum, instructional approaches, revenues, salaries—being the purview of the national government, each state retains the legal right to most education decisions and, even then, turns many of schooling decisions to local authorities at the district level, many of whom run only one school or a small group of schools. Such decentralization leads to substantial differences in spending, both between and within states, as well as substantial differences in educational offerings. Outcomes-based accountability approaches to improve educational opportunities while retaining some of the advantages of decentralization, particularly incorporating local knowledge, preferences and opportunities into decision making. The results of accountability in K-12 education have been mixed, with some evidence of improvement, especially for programs aimed at accountability at the school level, but also substantial pushback, particularly for narrowing the scope of educational goals.6 Because outcomes-based accountability in the US has used test scores in math and English language arts as primary measures, for example, schools may focus on these outcomes at the expense of other valued goals.
More recently, outcomes-based accountability has come to preschools in the form of Quality Rating and Improvement Systems (QRIS). QRIS give ratings to early childhood education and care settings based on a variety of measures. Unlike accountability in K-12, these systems tend not to use measures of student test performance since these are far more costly to collect reliably for young children. They include basic measures of resources such as class size and teachers’ educational attainment, but also often include more nuanced observational measures of classroom quality than are common in K-12. The Environment Rating Scale (ERS), for example, is an observation tool used in 30 QRIS states that includes a variety of elements ranging from space and layout to classroom activities and student-teacher interactions. Unlike accountability in K-12, participation in most QRIS systems is voluntary.
QRIS systems assign rating to program that provide information to program staff about their organizations’ own quality and to parents who are choosing programs for their children. Many systems include differential funding reimbursement for programs with higher quality ratings. The first statewide QRIS was implemented by Oklahoma in 1998. By February 2017, 38 states had statewide systems with nearly all others planning or piloting systems.7
While Quality Rating and Improvement Systems are the common approach to quality improvement for preschools, we have had very little evidence on their effectiveness. A new study by Daphna Bassok, Thomas Dee and Scott Latham, “The Effects of Accountability Incentives in Early Childhood Education,” provides some of the first—not focusing on the long run effects on children, which ultimately we would like to know—but instead, demonstrating that the systems can produce some of the mechanisms needed for quality improvement.8
In particular, the new study shows first that programs that get lower scores initially respond to these scores by improving in the area that lead to their lower score and, second, that parents respond to program scores in their choice of care for their children. The study compares programs that received scores just over a threshold needed to get a higher rating to very similar programs who scored just under the threshold needed to receive the rating. This approach—what is known as a fuzzy regression discontinuity approach—provides convincing causal effects of the program, much like a randomized control trial would.
The Bassok et. al. study assesses the QRIS program in North Carolina, one of the oldest programs in the country, which begun in 1999 and has been operating in its current form since 2005. North Carolina spends more than any other state on its QRIS, more than $13 million yearly. The system includes well-defined quality standards linked to financial incentives; support for program improvement through technical assistance and local partnerships; regular quality monitoring and accountability and; easily accessible quality information provided to parents.9 While in most state participation in QRIS is voluntary, but in North Carolina, all non-religious programs are automatically enrolled at the lowest ranking when they become licensed. Programs then can volunteer to be assessed for higher rankings.
North Carolina’s Division of Child Development and Early Education rates programs on a scale of one to five stars. This rating comes from subscales for “education standards” which include the education and experience of administrators, lead teachers, and the overall teaching staff; for “program standards” which includes a variety of structural measures such as staff-child ratios and square footage requirements as well as scores on the observational tool, ERS; and for meeting at least one of a variety of other education or programmatic criteria such as using a developmentally appropriate curriculum. A program’s scores on each of these measures combine to determine their overall rating—one to five stars.
One mechanism through which QRIS could drive quality is that programs seeing that they got lower ratings work on improving their scores. In North Carolina, ECE programs receive higher per-student reimbursements for subsidy-eligible children for every additional star they earn, in theory creating some incentive for program improvement. These increases vary by county and by the age of children served but, in most cases, they are substantial. The researchers, comparing similar programs that received a full point lower ranking due to a just slightly lower ERS rating, find that these slightly-lower scoring programs later earn ERS quality scores that are even higher than programs that received a higher star ranking due to a slightly higher ERS score initially. This result provides evidence that programs respond to the accountability system by improving their practice as measured by the ERS. Such improvement was quite concentrated. That is, the researchers did not find improvements on other measures such as the education and experience of workers.
A second mechanism through which QRIS could improve the quality of care that young children receive is through parents’ care choices. If parents, when given the opportunity, choose higher rated programs then more children will attend higher quality programs, even if the programs themselves do not improve. Using the same approach, the researchers find that in North Carolina parents do respond to the ratings. Programs that got a lower rating for just marginally lower performance on the ERS saw their enrollments drop relative to similar programs. In some areas parents have few choices for programs and in those places, the researchers did not find these enrollment effects. Instead, they were concentrated in areas with where parents had choice of care. As such, this mechanism is unlikely to work in all areas, but the results show that it can work in some, more densely populated areas, and can be driving force for improvement.
Overall, we still do not know the effects of QRIS on children’s long-run trajectories and on the substantial differences in early childhood learning opportunities across groups. Nonetheless this new research demonstrates that a well-designed QRIS system can both encourage programs to improve and provide parents with information that they value in making choices for their children’s care. Combined with regulations that set an acceptable floor for quality, these programs can help to create a higher quality early education system that allows for some diversity of offerings as well as the local control and parental choice, that have been hallmarks—whether for better or for worse—of the US education system and, particularly, the US early education system.
The author did not receive any financial support from any firm or person for this article or from any firm or person with a financial or political interest in this article. She is currently not an officer, director, or board member of any organization with an interest in this article.
Related Content


Author

-
Footnotes
- Yoshikawa, H., Weiland, C., Brooks-Gunn, J., Burchinal, M. R., Espinoza, L. M., Gormley, W. T., Ludwig, J., Magnuson, K. A., Phillips, D., & Zaslow, M. J. (2013). Investing in our future: The evidence base on preschool education. New York, NY: Foundation for Child Development.
- Schweinhart, L. J., Montie, J., Xiang, Z., Barnett, W. S., Belfield, C. R., & Nores, M. (2005). Lifetime effects: The HighScope Perry Preschool study through age 40. Ypsilanti, MI: HighScope Press; Gormley, W., Gayer, T., Phillips, D.A., & Dawson, B. (2005). The effects of universal Pre-K on cognitive development. Developmental Psychology, 41, 872-884; Weiland, C., & Yoshikawa, H. (2013). Impacts of a prekindergarten program on children’s mathematics, language, literacy, executive function, and emotional skills. Child Development.
- Barnett, W. S., Friedman-Krauss, A., Gomez, R., Horowitz, M., Weisenfeld, G. G., & Squires, J. (2017). The state of preschool 2016: State preschool yearbook. National Institute for Early Education Research. Retrieved from Click to access 2015%20Yearbook.pdf
- Lipsey, Mark W., Kerry G. Hofer, Nianbo Dong, Dale C. Farran, & Carol Bilbrey (2013). Evaluation of the Tennessee Voluntary Prekindergarten Program: Kindergarten and First Grade Follow‐Up Results from the Randomized Control Design. Retrieved: https://my.vanderbilt.edu/tnprekevaluation/files/2013/10/August2013_PRI_Kand1stFollowup_TN-VPK_RCT_ProjectResults_FullReport1.pdf
- Congressional Research Service (2016). Preschool Development Grants (FY2014-FY2016) and Race to the Top – Early Learning Challenge Grants (FY2011-FY2013). Retrieved July 22, 2017 from https://www.everycrsreport.com/reports/R44008.html; U.S. Department of Health and Human Services (2014). Child Care and Development Block Grant Act of 2014: Plain language summary of statutory changes. Retrieved July 1, 2017 from https://www.acf.hhs.gov/occ/resource/ccdbg-of-2014-plain-language-summary-ofstatutory-changes
- Figlio, D. & Loeb, S. (2011). School accountability. In E. A. Hanushek, S. Machin, & L. Woessmann (Eds.), Handbook of the Economics of Education, Vol. 3 (383-423). San Diego, CA: North Holland.
- QRIS National Learning Network. (2017). QRIS state contacts & map. Retrieved May 20, 2017, from http://qrisnetwork.org/sites/all/files/maps/QRISMap_0.pdf
- Bassok, Daphna Thomas Dee, & Scott Latham (2017). The Effects of Accountability Incentives in Early Childhood Education. NBER Working Paper 23859. Retrieved: http://www.nber.org/papers/w23859
- Ibid
The Brookings Institution is committed to quality, independence, and impact.
We are supported by a diverse array of funders. In line with our values and policies, each Brookings publication represents the sole views of its author(s).