This report is part of a series by the author on the results of the 2020 census.
While there is much discussion about the future of big city populations, the 2020 Census shows that, when looking at the 2010-2020 decade, many major cities grew faster than the previous decade and most registered increased racial diversity. And as is the case for the nation as a whole, their youth population becomes far more racially diverse.
This analysis of America’s 50 largest cities, home to more than 50 million residents, demonstrates that for most, racial and ethnic diversity will be their signature demographic trait, with persons identifying as Latino or Hispanic, Asian American, or two or more races accounting for most of their growth as “white flight” and “Black flight” have occurred more modestly than in recent decades.
A decade-wide uptick in big city growth
Big city growth over the past several decades has been shaped by economic booms and busts. The 1990s saw high growth in many large cities bolstered by strong immigration and economic forces, only to decline in the 2000-2010 decade as their populations dispersed to the suburbs and smaller-sized places due to heated housing and job markets elsewhere. Of the nation’s 50 largest cities, 37 grew more slowly in the early 2000s than in the 1990s, including nine of the 10 with populations exceeding 1 million. As a group, these 50 cities grew about half much in the 2000-2010 decade (5.6%) than they did in the 1990s (10.9%).

The new 2020 census numbers reveal a return to large city growth in the 2010s decade. Eight of the 10 million-plus cities bested their early 2000s growth, including New York, which registered a 7.7% gain, and led by Phoenix and Houston, at rates of 11.2% and 9.8% respectively.
Among all 50 big cities, 32 grew more rapidly than in the 2000-2010 decade (download Table A).1 The highest growth rates were among cities in the South and West, led by Texas cities, Fort Worth and Austin, at 24% and 22%, followed by Seattle, Charlotte, and Denver. Atlanta showed the largest cross-decade growth gain—from 0.8% in 2000-2010 to 18.7% in 2010-2020. Only four of these big cities—Detroit, Baltimore, Milwaukee, and Memphis—registered losses for the decade.
…
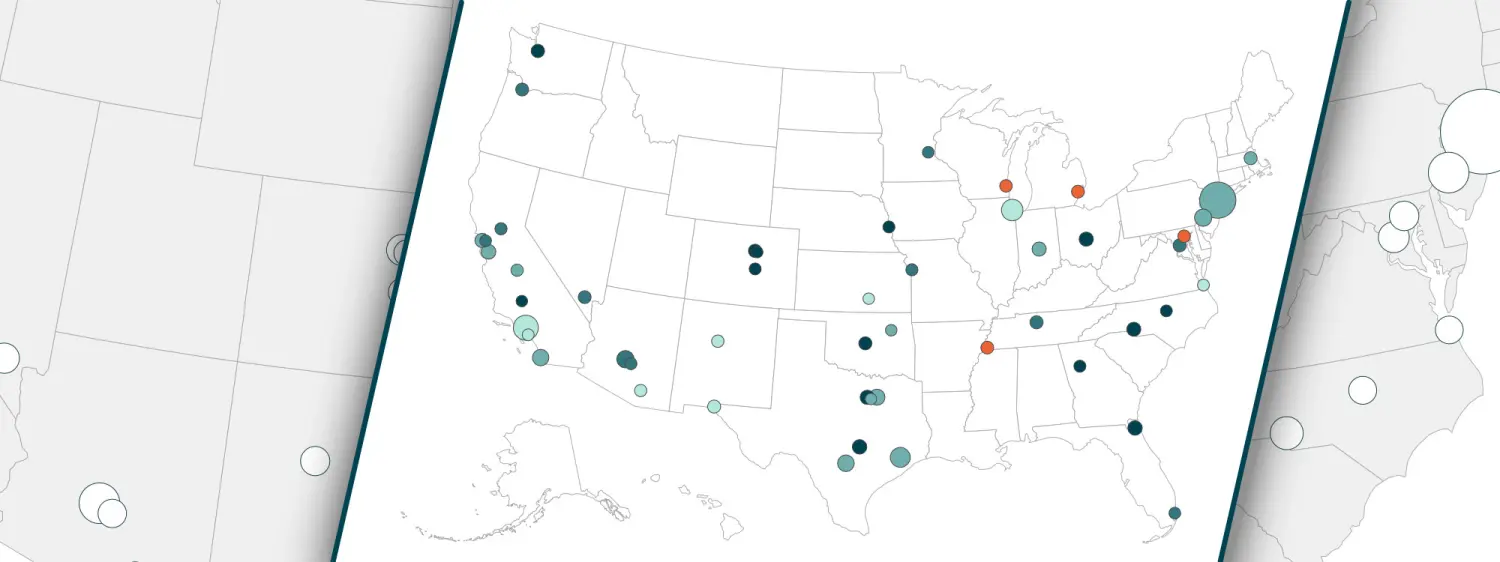
Map 1
Population size and 2010-2020 growth rates
50 largest citiesHover over cities to view statistics
…
Source: William H. Frey analysis of 2010 and 2020 US decennial censuses
It is important to remember that some of these big city gains were front-loaded in the early 2010s due to the arrival of young movers, especially millennials, in the aftermath of the 2007-2009 Great Recession; a period when suburban and small city housing and employment opportunities were less available. As the decade wore on, big city growth faded in many areas as the economy revived elsewhere, even before the start of the 2020 COVID pandemic.
But over the decade, the 2010s were good for big cities, increasing the sizes of almost all of them. A major reason why this occurred is due to the contributions of nonwhite racial and ethnic groups who continue to find cities attractive destinations.
Big cities became even more diverse
The results of the 2020 census made plain that nonwhite racial and ethnic groups—especially people identifying as Latino or Hispanic, Asian American, or with two or more races—accounted for most of the national growth in the past decade. This was also case for a majority of big cities which, as a group, became even more racially diverse over the 2010-2020 decade.

This can be seen by comparing the national race-ethnic profile with that of the aggregated 50 city population over the past three censuses. Much more than the U.S. population, the nation’s big city population included a higher representation of nonwhite racial groups already in 2000. For a good part of the 20th century, white and Black residents constituted the largest populations of U.S. cities; yet this changed as Latino or Hispanic populations became much more prominent. This is increasingly the case with the Asian American population as well.
In 2000, the white population represented over half of residents in 25 of these 50 cities; this fell to 17 cities in 2010 and 14 cities in 2020. Newly designated minority-white cities since 2010 are Jacksonville, Fla., Tulsa, Okla., and Oklahoma City. Yet even the “whitest” big cities in 2020, Portland, Ore., Colorado Springs, Colo., and Omaha, Neb. were less than 70% white (download Table B).
…
Map 2
Total population classed by 2020 race-ethnic make up
50 largest citiesHover over cities to view statistics
…
Source: William H. Frey analysis of 2010 and 2020 US decennial censuses
*Non-Latino or Hispanic members of group; Asian American includes Native Hawaiians and other Pacific Islanders
Among the 36 big cities where the white population is less than half of the population, Latinos or Hispanics constitute the largest race-ethnic population in 12, with greatest shares in El Paso, Texas Miami, and San Antonio, where more than six in 10 residents identify as Latino or Hispanic. Los Angeles, Houston, and Dallas, each with large Latino or Hispanic populations, are included among these 12.
Black residents outnumber any other race or ethnic group in seven cities, led by Detroit where more than three quarters of all residents identify as Black. Other cities where Black residents comprise the largest share of the population include Memphis, Tenn. Baltimore, Atlanta, Washington D.C. and Philadelphia.
Related Books
In the remaining 17 of these 36 “minority white” cities, white residents represented the biggest racial group though still comprising less than half of the population. For example, in Chicago white residents comprise 31.4% of the population, higher than any other race or ethnic group, but only slightly higher than residents identifying as Latino or Hispanic (29.8%) or Black (28.7%) Likewise in other cities, including New York, Phoenix, San Francisco, and Boston, white residents comprise less than half of the population but a greater share than any other racial or ethnic group.
In most of these cities, the white share of the population has continued to decline—among 45 of the 50 cities between 2000 and 2010, and among 44 between 2010 and 2020 (download table B). For example, in the city of Las Vegas white residents comprised 58% of city residents in 2000. This fell to 48% in 2010 and to 40% in 2020. Other cities which showed similarly large declines in white population shares are Tulsa, Okla., Indianapolis, Columbus, Ohio, and Jacksonville, Fla. However, over this same period, a few big cities showed small increases in the white population shares, including Washington D.C., Atlanta, Oakland, Calif., and Denver.
’New minority’ gains vs. white and Black flight
The increased diversity shown for most big cities is the consequence of race-ethnic shifts heavily impacted by movement into and out of these cities of different groups as well as natural demographic growth (the increase of births over deaths).2Some of this involves the growth of what I have termed “new minorities”—Latinos or Hispanics, Asian Americans, and persons identifying with two or more racial groups”—whose growth rates nationally have dwarfed those of other groups in recent decades, due in part to the rise of immigration from Latin America and Asia.
Yet big city populations have also been affected by changes in other racial and ethnic groups, especially white and Black. There has been a longstanding “white flight” to suburbs since at least the 1950s in many American cities and more recently a “Black flight” trend that became most prominent in the 2010-2020 decade.

Recent changes in the race-ethnic makeup of America’s big cities have been impacted by each of these components but especially “new minorities.” Over the 2010-2020 decade, the aggregated 50 city populations gained 1.5 million from persons identifying as Latino or Hispanic, 1.1 million from Asian Americans, and nearly 1 million from those identifying as two or more races. This stands in contrast with a small overall gain in the aggregated white population and modest decline for Black residents.
These aggregate patterns reflect different gains for individual cities (download Table C). The biggest contribution to 2010-2020 gains in the vast majority of cities (29) came from the Latino or Hispanic population. This includes cities with long-standing Latino or Hispanic populations such as Houston, San Antonio, and Phoenix, as well as cities where the Latino or Hispanic population is not dominant (e.g. Philadelphia, Memphis, Tenn., Baltimore, Milwaukee) but increasingly dependent on Latino or Hispanic populations for growth or stasis.
In seven cities, New York, Chicago, San Jose, Seattle, San Francisco, San Diego, and Boston, Asian American residents contributed the most of all race-ethnic groups to 2010-2020 gains. And in four, most notably Los Angeles, the two-or-more-race population was the biggest contributor.
Unlike the above-mentioned groups, which contributed to at least some growth in most big cities, contributions of white and Black residents were more uneven. White populations gained in only 28 of the 50 cities and contributed more than any other group in just eight: Denver, Washington, D.C., Austin, Texas, Atlanta, Raleigh, N.C., Omaha, Neb., and Minneapolis. And while the Black population grew in 27 cities, it was the biggest contributor in just two, Columbus, Ohio an Arlington, Texas. In the rest, including those with substantial Black populations, other racial and ethnic groups made bigger contributions.

The new census numbers reveal modest changes in the long-standing “white flight” and more recent “Black flight” phenomena. While 22 cities showed white population losses in 2010-2020, this is fewer than those in the previous two decades (34 cities in 2000-2010 and 30 in 1990-2000). And overall, fewer cities showed large white losses than in earlier decades (download Table D). For example, in the 1990s, six cities lost more than 100,000 white residents, led by New York (-361,000) and Los Angeles (-200,000). In contrast, the cities that lost the most whites in 2010-2020 were Indianapolis (-36,000) and San Jose (-35,000).
As discussed earlier, Black city population losses were more widespread in the 2000-2010 decade than in the 1990s—as the number of Black-loss cities rose from 13 to 20 and added up to an overall 50-city Black population loss. While 23 cities lost Black populations in the most recent decade, the magnitude of this loss declined for the 50 cities as well as several individual cities (download Table D). For example, in the cities with the largest Black losses in 2010-2020, Detroit, Chicago, New York, Los Angeles, Washington, D.C., and Oakland, Calif. lost considerably fewer Black residents in 2010-2020. Still a few more cities have joined the “Black flight” list.
Child populations are the most diverse
The 2020 census results made clear that racial and ethnic diversity is more pronounced for the nation’s youth than the adult population. For the first time, more than half of the child (under age 18) population identifies with a nonwhite group.
Most big cities have already achieved youthful diversity, but this has become more pronounced with the new census numbers. As a group, the youth population of the aggregated 50 cities were already decidedly “minority white” in 2000 with just 29% identifying as white alone. This became reduced to 25% in 2020 such that the combined Latino or Hispanic, Asian American and two or more race population rose to more than half of the youth population. Although the adult population of these cities also became diverse it is important to understand the sharp diversity differences between adults and children, as observed in selected large cities shown in Figure 3.


When looking at the individual cities, only two of the 50, Colorado Springs, Colo. and Portland, Ore., had white majority youth populations in 2020, down from 7 in 2010 and 13 in 2000 (download Table E). Cities with white shares of their youth population below 15% were Detroit, El Paso, Texas, Memphis, Tenn., Milwaukee, Long Beach, Calif., Fresno, Calif., Miami, San Antonio, and Houston. Latinos or Hispanics represented the largest youth race or ethnic group in 25 cities, including Los Angeles, Chicago, New York, and Boston. Black youth were the most populous youth race or ethnic group in 10 cities, including Atlanta, Baltimore, and Philadelphia; and in one city, San Francisco, Asian Americans are the largest of all racial and ethnic groups among youth.
…
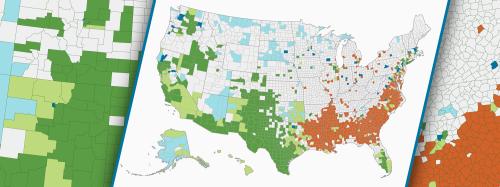
Map 3
Under age 18 population classed by 2020 race-ethnic make up
50 largest citiesHover over cities to view statistics
…
Source: William H. Frey analysis of 2010 and 2020 US decennial censuses
*Non-Latino or Hispanic members of group; Asian American includes Native Hawaiians and other Pacific Islanders
Not all city youth population became “less white” over the course of the 2010-2020 decade. Small increases among white child shares were observed in 16 cities led by Washington D.C., Denver, Atlanta, Chicago, and Oakland. White child shares in these cities continue to remain small and the modest changes are due either to notable white population gains over the 2010-2020 decade or a decline in other racial groups.
Big cities as a model of the nation’s future demography
For much of recent history, big cities have led the nation in reflecting increased racial and ethnic diversity. For many decades, a large number of cities had primarily white and Black populations—a phenomenon accentuated by racial housing discrimination which has historically prevented city Black residents from moving to the suburbs. Now, the impact of white and Black city flight is being eclipsed by the growth of Latino or Hispanic and Asian American populations as well as those identifying with two more races. These groups have helped contribute to city gains in the last decade and could provide a roadmap to the ways the nation’s population will change in the years ahead. One aspect of these shifts that is especially noteworthy is the pronounced racial diversity of these cities’ youth populations. It means that urban schools and other institutions that serve families with children will be on the forefront of understanding the needs of the next generation of multicultural Americans.
Related Content


Author

-
Footnotes
- Population growth for cities includes the components of in and out migration as well as births and deaths. Also, several cities increased their land areas. Between 2010 and 2020, Omaha increased its land areas by 11% and San Antonio, Austin, Houston, Tucson, and Bakersfield increased their land areas between 5% and 10%.
- Census numbers do not allow decomposition of migration, birth, and death components of this change. Also, the 2020 census showed a notable increase in the population that identified with two or more races. Some of this could reflect changes in the ways people identified themselves.
The Brookings Institution is committed to quality, independence, and impact.
We are supported by a diverse array of funders. In line with our values and policies, each Brookings publication represents the sole views of its author(s).