In Iran, the economy dominates political debate, and poverty rates (defined as the percentage of population below a given poverty line) have come to be viewed as the barometer of economic performance. Concerns about Iran’s poor are very timely now that the poor, like everyone else, are struggling with high inflation. But with the next presidential election less than a year away, there is also concern about the quality of the information available about the state of the poor. Unfortunately, poverty rates in Iran are highly politicized and economic scholarship is not advanced enough to monitor and sort various claims. There were inaccurate claims of rising poverty under Khatami, and now there are similar claims under Ahmadinejad.
A short study of urban poverty that appeared last week in a research journal of the Central Bank of Iran (CBI) showed that poverty was high and on the rise. The report has been widely disseminated inside and outside Iran. According to news reports, the study claims that 14 million Iranians are living below the poverty line, which is hardly news to ordinary Iranians who are feeling the pinch of inflation reaching 30%, one of the highest in the world.
But, upon closer examination, the finding of the CBI study turns out to be purely the consequence of assuming a high poverty line, which is hardly a sign of change in poverty in Iran. In one variant the author considers everyone with per capita expenditures less than 50% of the national mean as poor. This is a relative poverty line, which (in Purchasing Power Parity dollars) amounts to about $11 per day, or 3.7 times the so called “$2 per person day” international norm for absolute poverty (which in 2006 amounts to $3). Another variant of the poverty line used in the study is the more familiar 50% of the median, which still yields a high poverty line. Applying this criterion to the national data from the Expenditure and Income Survey (HEIS) collected by the Statistical Center of Iran (SCI), the national poverty rate is estimated at 18.7%, which places nearly 14 million individuals in poverty.[1]
But, even this lower poverty line is 2.5 times the so-called $2 per day rate ($3 in 2006 dollars) which is the international standards of poverty analysis for developing countries. There is no harm in setting lofty goals for poverty reduction for any country as long as people know that the poverty line is set much higher than the international norm. The $2 per day line results in poverty rates of 5.6% in 2006, which is lower than the 6.1% we find using the same method for 2005.[2]
This brings us to the finding of the CBI study that captures the political imagination, namely that poverty had increased, from 18 to 19 percent, between the first and second year of President Ahmadinejad’s administration. To show that poverty actually rose during Ahmadinejad’s first two years would be quite a damning statement for a president who promised to be more pro-poor than his predecessor, Mr. Khatami.[3] Unlucky for Mr. Ahmadinejad, the Khatami years set the bar for poverty reduction quite high: according to the $2 per day standard, nationally the poverty rate declined under his watch from 19.5% in 1997 to 6.4% in 2004.[4] Nor is the poverty outlook for the remainder of Mr. Ahmadinejad’s term likely to be any more favorable. Most people believe that rising inflation in 2007-08 has worsened the position of the poor. We will know that for sure only when new data become available.
Lucky for Mr. Ahmadinejad, there are good reasons to doubt that poverty has been on the rise. The calorie method employed in the CBI study is highly unreliable for comparison over time because of the rough way in which the basket of goods that fulfills the minimum calorie requirement is calculated each year. Another comparison, based on the absolute poverty lines defined on the basis of the $2 per day standard, shows the opposite: that poverty rates have declined slightly during 2005-06, as was just noted. Furthermore, inflation in 2007-08 may have done more harm to those on fixed incomes (salaried workers and the retired) who generally populate the higher deciles of the distribution. Poverty rates may yet not show the increase in the coming years that Mr. Ahmadinejad’s detractors seem to expect. Many families around the poverty threshold work in markets, such as in construction, where wages are competitively set and therefore more able to keep up with inflation, or they produce the very goods—such as fresh vegetables for the Tehran market—that have risen in price most spectacularly.
Comparing relative poverty rates over time is not very informative because they depend on the distribution of income, but they do point to something else that may have gone wrong with Mr. Ahmadinejad’s promises. My calculations for half-the-mean poverty line show an increase in the proportion of individuals in poverty, from 32.0% in 2005 to 33.9% in 2006, and for half-the-median from 17.4% to 18.7%.[5] These are not signs of increasing poverty but of a deteriorating distribution of income, which is where Mr. Ahmadinejad is most vulnerable, because his slogans have been more about economic justice than poverty reduction. According to the Household Expenditure and Income Survey data for 2005 and 2006, the distribution of income actually worsened in the first two years of his presidency.[6]
Lifting 350,000 Iranians above the $2 per day poverty line as revealed by survey data is not what one would call a policy failure, but it is hardly impressive given the increase in the inflow of oil revenues in 2006 and the resulting expansion of the economy. As Table 1 shows, economic growth during 2005-06 did lift all incomes, even those of the lowest deciles (which is why we see absolute poverty rates fall), but it was four times as lucrative for the rich as it was for the poor. The worsening of the distribution of expenditures in 2006 compared to 2005 is also reflected in the Gini coefficient of inequality, which increased from 43.5 in 2005 to 44.5 in 2006. This is not a surprising finding for anyone who has studied how Iran’s distribution of income changes following the inflow of oil money—most of the time it gets worse. Apparently, Ahmadinejad’s populist policies have so far not affected the iron law of Iran’s trickle-down economics.
Table 1. Average real per capita expenditures, 2006 rials per person per day
|
Deciles |
2005 |
2006 |
Percent increase |
|
1 |
8,039 |
8,262 |
2.77 |
|
2 |
12,963 |
13,096 |
1.03 |
|
3 |
17,002 |
17,257 |
1.49 |
|
4 |
21,074 |
21,667 |
2.82 |
|
5 |
25,520 |
26,479 |
3.76 |
|
6 |
30,714 |
32,270 |
5.06 |
|
7 |
37,396 |
39,840 |
6.54 |
|
8 |
47,237 |
50,792 |
7.53 |
|
9 |
64,783 |
70,057 |
8.14 |
|
10 |
132,222 |
142,663 |
7.90 |
|
Total |
39,693 |
42,229 |
6.39 |
Source: Author’s calculations from data files of Household Expenditure and Income Surveys, 2005 and 2006.
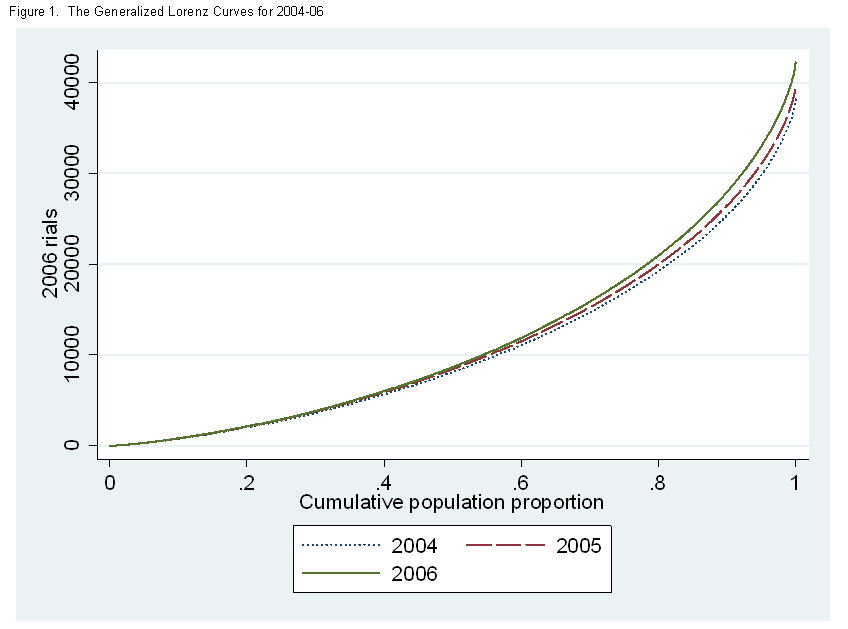
To assess changes in welfare, a good tool is the Generalized Lorenz Curve, which combines the effect of the change in mean incomes and its distribution. These curves (depicted in Figures 1 and 2) show that all income groups have benefitted from economic growth in the last two years,[7] but the rich have benefitted more. The latter is visible in Figure 1 which shows the GL curves for 2004-06, and the former in Figure 2, which magnifies the same graph for the poorest ten percent of the population showing that the poor did not become worse off.
[1] Unlike the SCI data, CBI data are not available to researchers, so I cannot reproduce the results in the CBI study for urban households. However, the surveys from the two sources seem to be quite similar.
[2] This is $3 in 2006 international dollars which, using the latest Purchasing Power Parity (PPP) conversion factors for private consumption published by the World Bank, yields a poverty line of 8,831 rials per person per day in 2006.
[3] The CBI study is for urban households only, but news report largely ignored this fact.
[4] See also my article, “Poverty, Inequality, and Populist Politics in Iran, forthcoming in the Journal of Economic Inequality. http://www.springerlink.com/content/67k71t441vk54ml3/?p=c4884bd839a84cd9b044c06b4cc89f2d&pi=2
[5] For urban areas, the same methodology leads to poverty rates of 16.0% and 17.2% for 2005 and 2006, respectively.
[6] My calculations are based on the raw HEIS data files provided by the Statistical Center of Iran.
[7] We know this because the curves for different years in Figures 1 and 2 do not cross.
The Brookings Institution is committed to quality, independence, and impact.
We are supported by a diverse array of funders. In line with our values and policies, each Brookings publication represents the sole views of its author(s).


Commentary
Op-edHas Poverty Increased in Iran Under Ahmadinejad?
August 5, 2008