The detailed 2010 census results won’t be available for another year. But this week the Census Bureau unveiled its latest population estimates for metropolitan areas and counties for the year ending last July. What they show is a country that is demographically standing still.
The migration slowdown already documented last year has intensified. Then, the bursting housing bubble and mortgage meltdown dramatically lowered migration levels overall and population growth levels in selected Sun Belt hotspots. Since that time, there was the Wall Street crash, a broad expansion of the Great Recession and a continuation of the America’s foreclosure epidemic. Interstate migration remains flat at a post World War II low, about half of its rate in the late 1990s.
The impact of this slowdown is now even more severe for the mid-decade “bubble” regions of the country—areas that many thought had already hit bottom. Between July 2004 and 2005, six metropolitan areas led all others in migration gains. Phoenix gained nearly 100,000 migrants; Riverside, Tampa, Orlando and Atlanta each gained more than 50,000; and Las Vegas took in nearly 40,000. Yet last year only Atlanta of these six was in the top 10 migration gainers, with a net inflow of only 19,000. Las Vegas joined Orlando and Riverside in losing more migrants than they gained. And Phoenix and Tampa gained a mere 12,000 and 4,600, respectively. (Table 1)
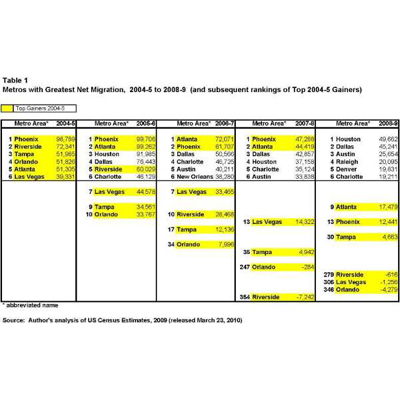
In fact, among the 25 large metro areas that gained the most migrants in 2004–05, seven flipped from net in- to out-migration for 2008–09 and an additional 14 showed reduced in-migration These areas were primarily in Florida, the rest of the Southeast, Mountain West and interior California—mushrooming places during the days of easy credit and wild overbuilding.
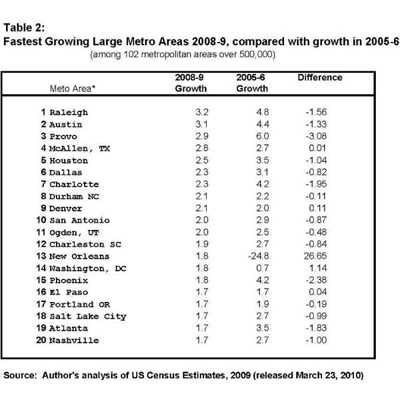
These migration shifts translate into reduced population growth, propped up to some degree by more births than deaths and immigration from abroad. At mid-decade 13 of the nation’s largest 100 metros grew by more than 3 percent a year. Yet each showed lower growth in 2008–09, led by Cape Coral-Fort Myers Florida where 2004–05 growth of 5.7 percent dipped to a negative 0.3 percent in the last year. Only two metro areas, Raleigh and Austin, grew as much 3 percent in 2008–09 and 15 of the top 20 grew slower than in 2005–06, the last year of the bubble. (Table 2)
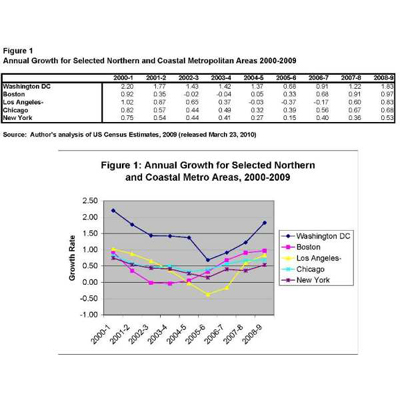
The flip side of this prolonged migration slowdown is the greatly reduced out movement from mid-decade “donor” areas, located primarily on the coasts or in the North. Of the 25 metros with largest 2004–05 out-migration, all but two showed lower out-migration in 2008–09, including three that flipped to in-migration (Boston, Washington DC and San Francisco). Metropolitan New York lost more than 280,000 migrants annually between July 2004 and 2006. But in the past year it registered its lowest net out-migration since 1990 at 110,000. Los Angeles annual migration loss of 243,000 in 2005–06 was reduced to a loss of only 79,000 in 2008–09.
This “windfall” retention of migrants allowed large metros that previously lost residents to hot markets in the South and West show end of decade growth increments. Among these are New York, Los Angeles, Chicago, Boston and Washington D.C. (Figure 1)
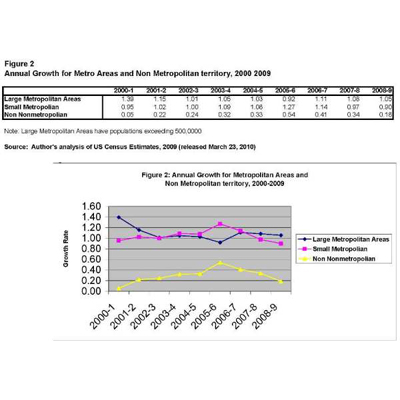
Other “windfall” gainers from the migration slowdown are large metropolitan areas and core urban areas, in contrast to smaller places, suburbs and exurbs. Smaller metropolitan areas and non-metropolitan territory have shown declining growth rates since 2005–06, so that now large metropolitan areas (with over one half million population) are growing fastest. (Figure 2)
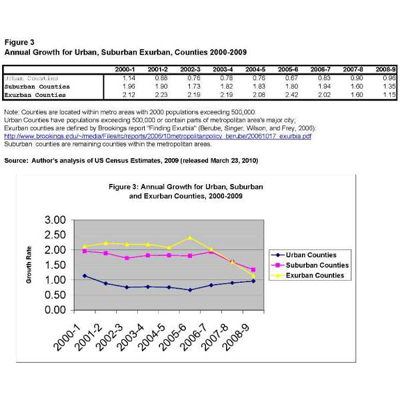
Similarly, the prolonged credit crunch and construction halt brought extended growth declines to the nation’s suburbs and exurbs. In fact, the last year showed a near closing of the gap between exurb and core urban growth. (Figure 3)
The one positive note in all this is the relative growth of Texas metropolitan areas. As other Sun Belt metros have seen flat or diminished growth, Texas metros, less impacted by the housing bust and job losses, are relatively thriving. Houston, Dallas and Austin led the nation in net migration for 2008–09 with the two former areas showing an uptick from the previous year. Likewise, four of the six fastest growing large metros are located in Texas (McAllen-Edinburgh is the other).
Texas’ relative success will appear to be rewarded with the forthcoming census results. As I calculated when the recent state estimates were released, the Lone Star State is slated to gain four new congressional seats—its largest take since 1880. At the same time, Florida, which was poised to gain two or three seats if the foreclosure crisis had not hit, will probably now only gain one. On the other hand, New York is likely to lose only one seat, rather then the projected two if out-migration had not slowed.
So at a time when most Americans are filling out their census forms, they are registering their residences in a country that appears to be stuck in place. Any straight-line analysis of 2000–2010 census trends will miss the crazy quilt of demographic dynamics that occurred in the context of superheated markets deflating, ending in a prolonged migration slowdown. Renewed metropolitan growth is certain to take place as there is surely a pent-up demand to migrate among young professionals, families and retiring baby boomers. The more difficult questions are where and when will this happen?
The Brookings Institution is committed to quality, independence, and impact.
We are supported by a diverse array of funders. In line with our values and policies, each Brookings publication represents the sole views of its author(s).


Commentary
Op-edA Demographic Lull at Census Time
March 26, 2010