This post updates with year-end 2021 data the External Wealth of Nations database [Excel download], which assembles data on external claims and liabilities of economies around the world. The database is described in more detail in a series of papers (Lane and Milesi-Ferretti 2001, 2007, 2018) and in a companion post. The data are annual for 1970-2021 and cover 212 economies, plus the euro area and the Eastern Caribbean Currency Union (ECCU). The update to 2021 is currently available for all economies (plus euro area and ECCU), with the exception of Syria and the now-dissolved Netherlands Antilles. The data will be updated at regular intervals.
The first year of recovery—2021—from the COVID recession was characterized by increasing financial market optimism and strong global capital flows. This post focuses on the size of cross-border claims and liabilities, an important measure of international financial integration. External assets and liabilities can increase because of new international borrowing and lending, captured by cross-border financial flows, or because the value of such claims increases as a result of asset price or exchange rate changes. In 2021, global financial flows were strong and asset prices rose, increasing the value of external assets and liabilities. However, as a ratio to global GDP they declined, because of the sharp increase in nominal GDP, with high real growth and high inflation.
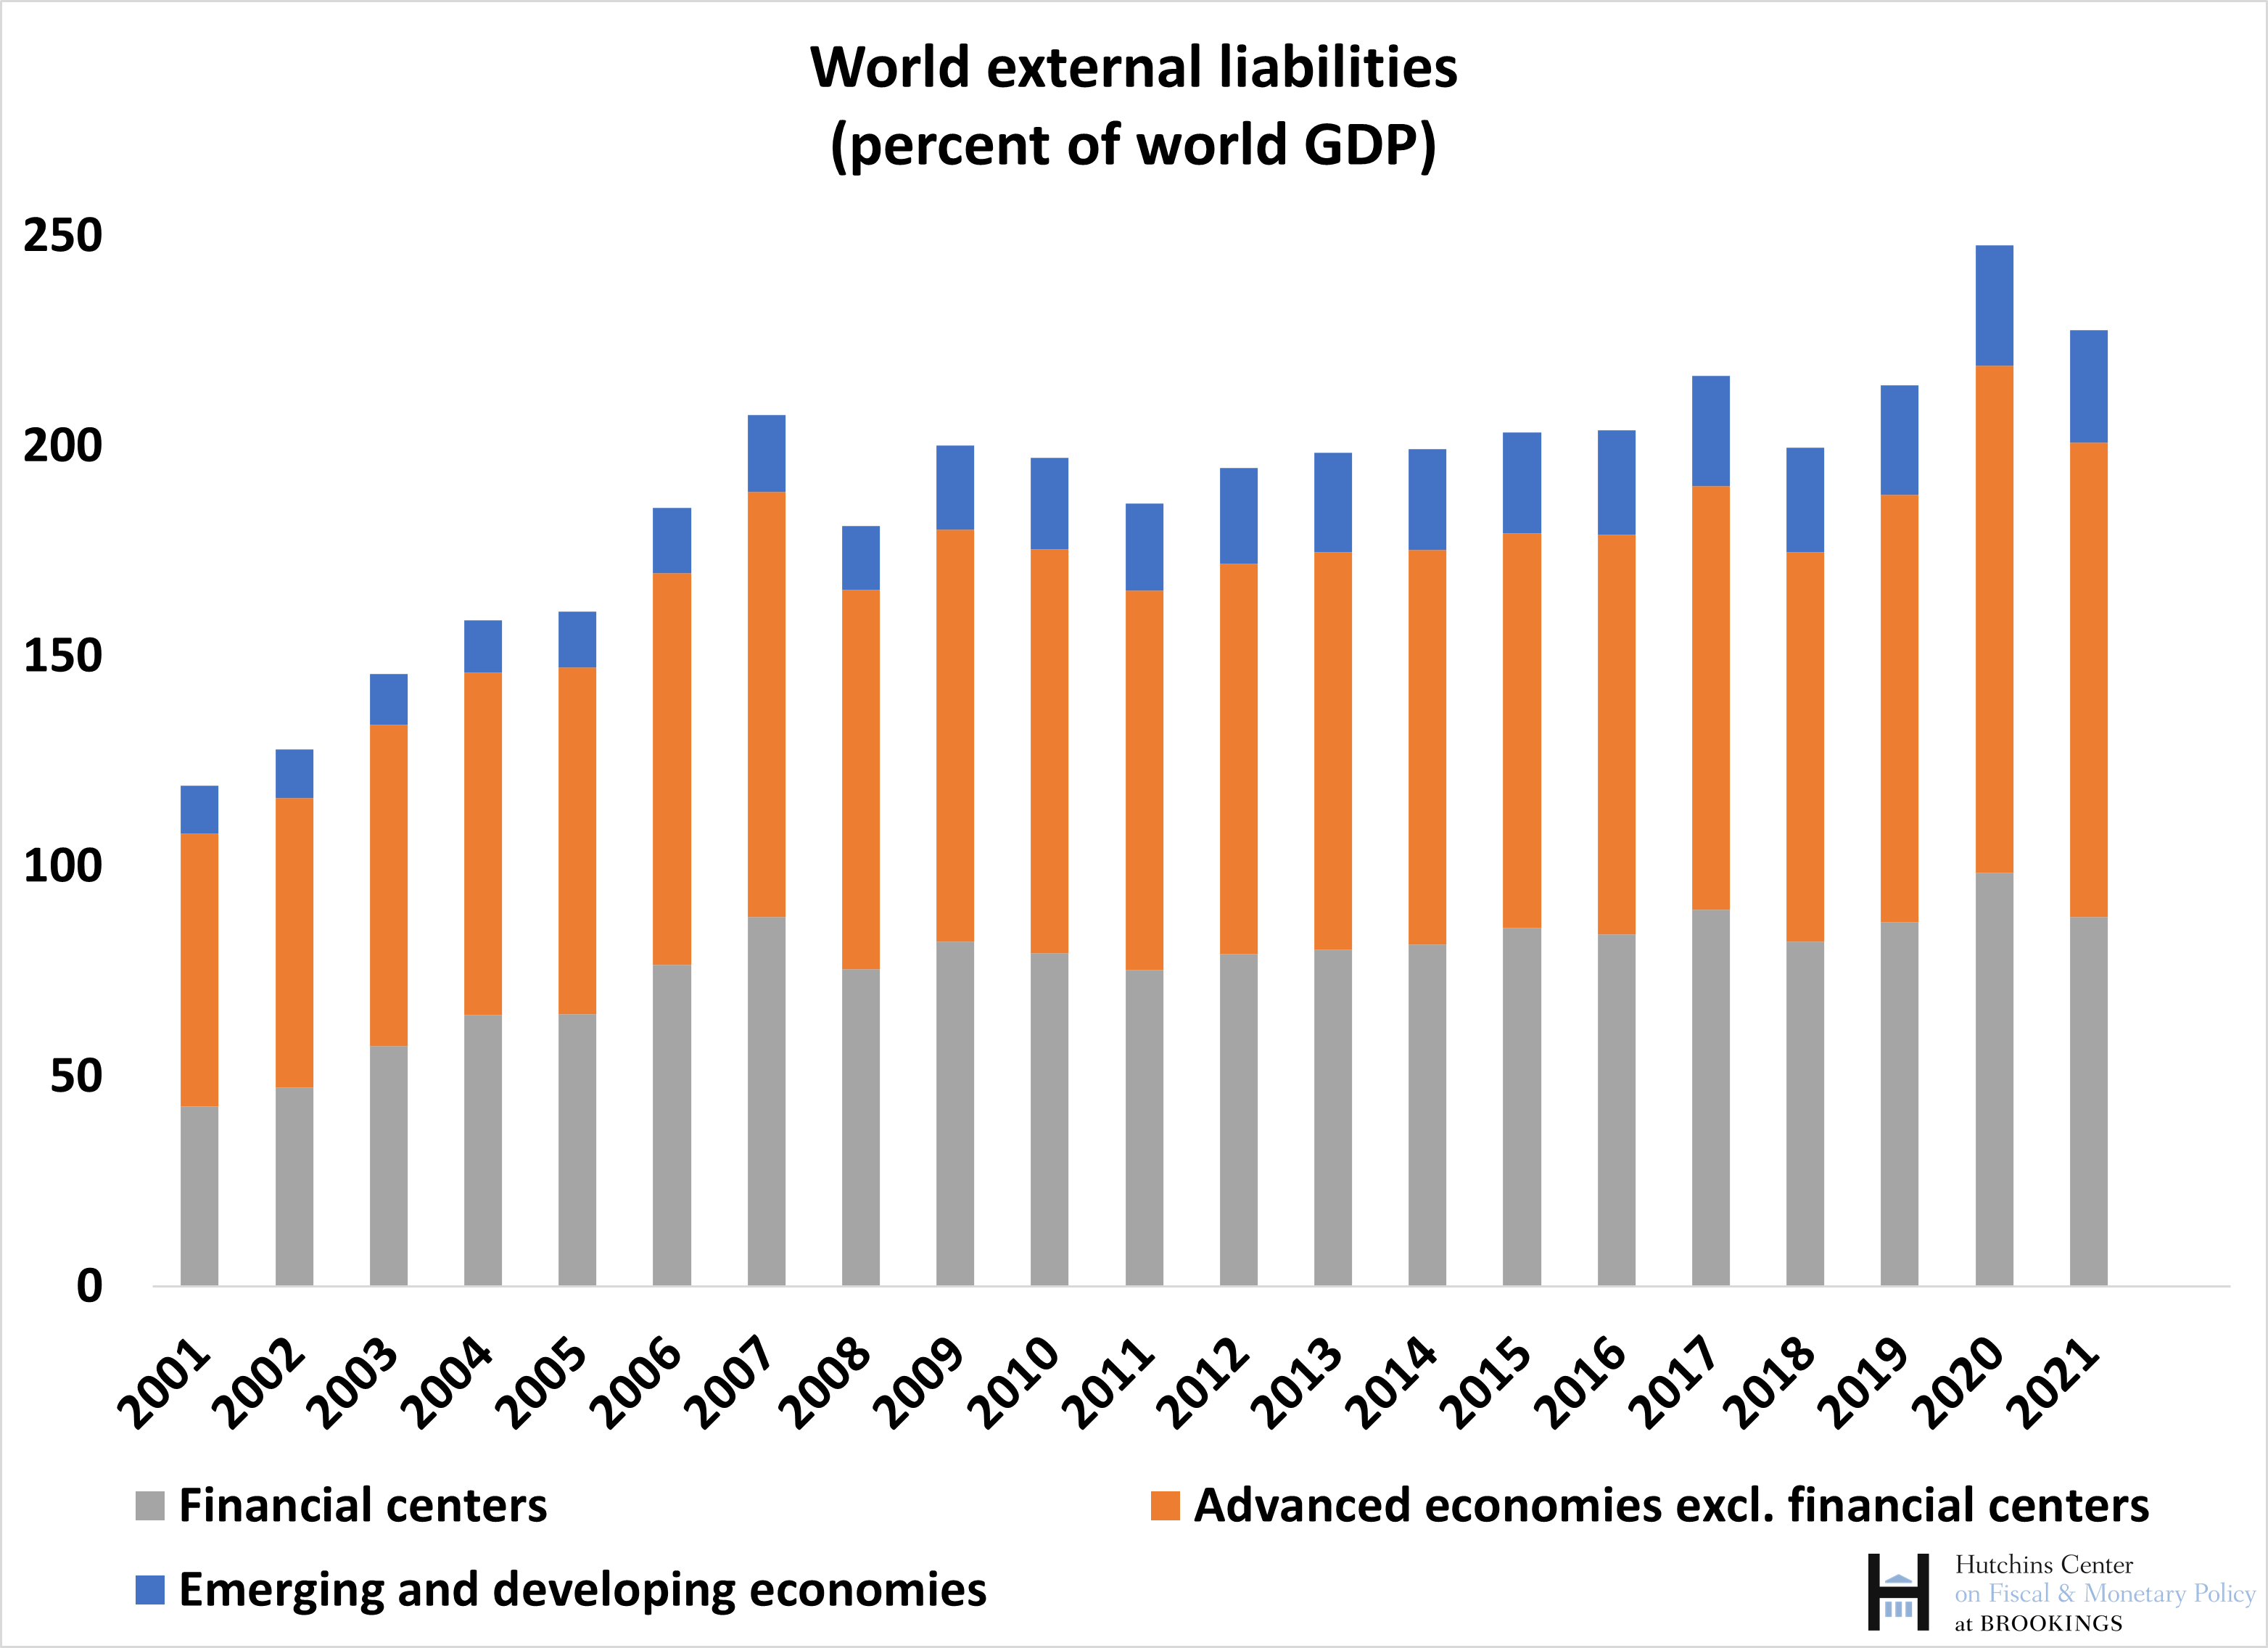
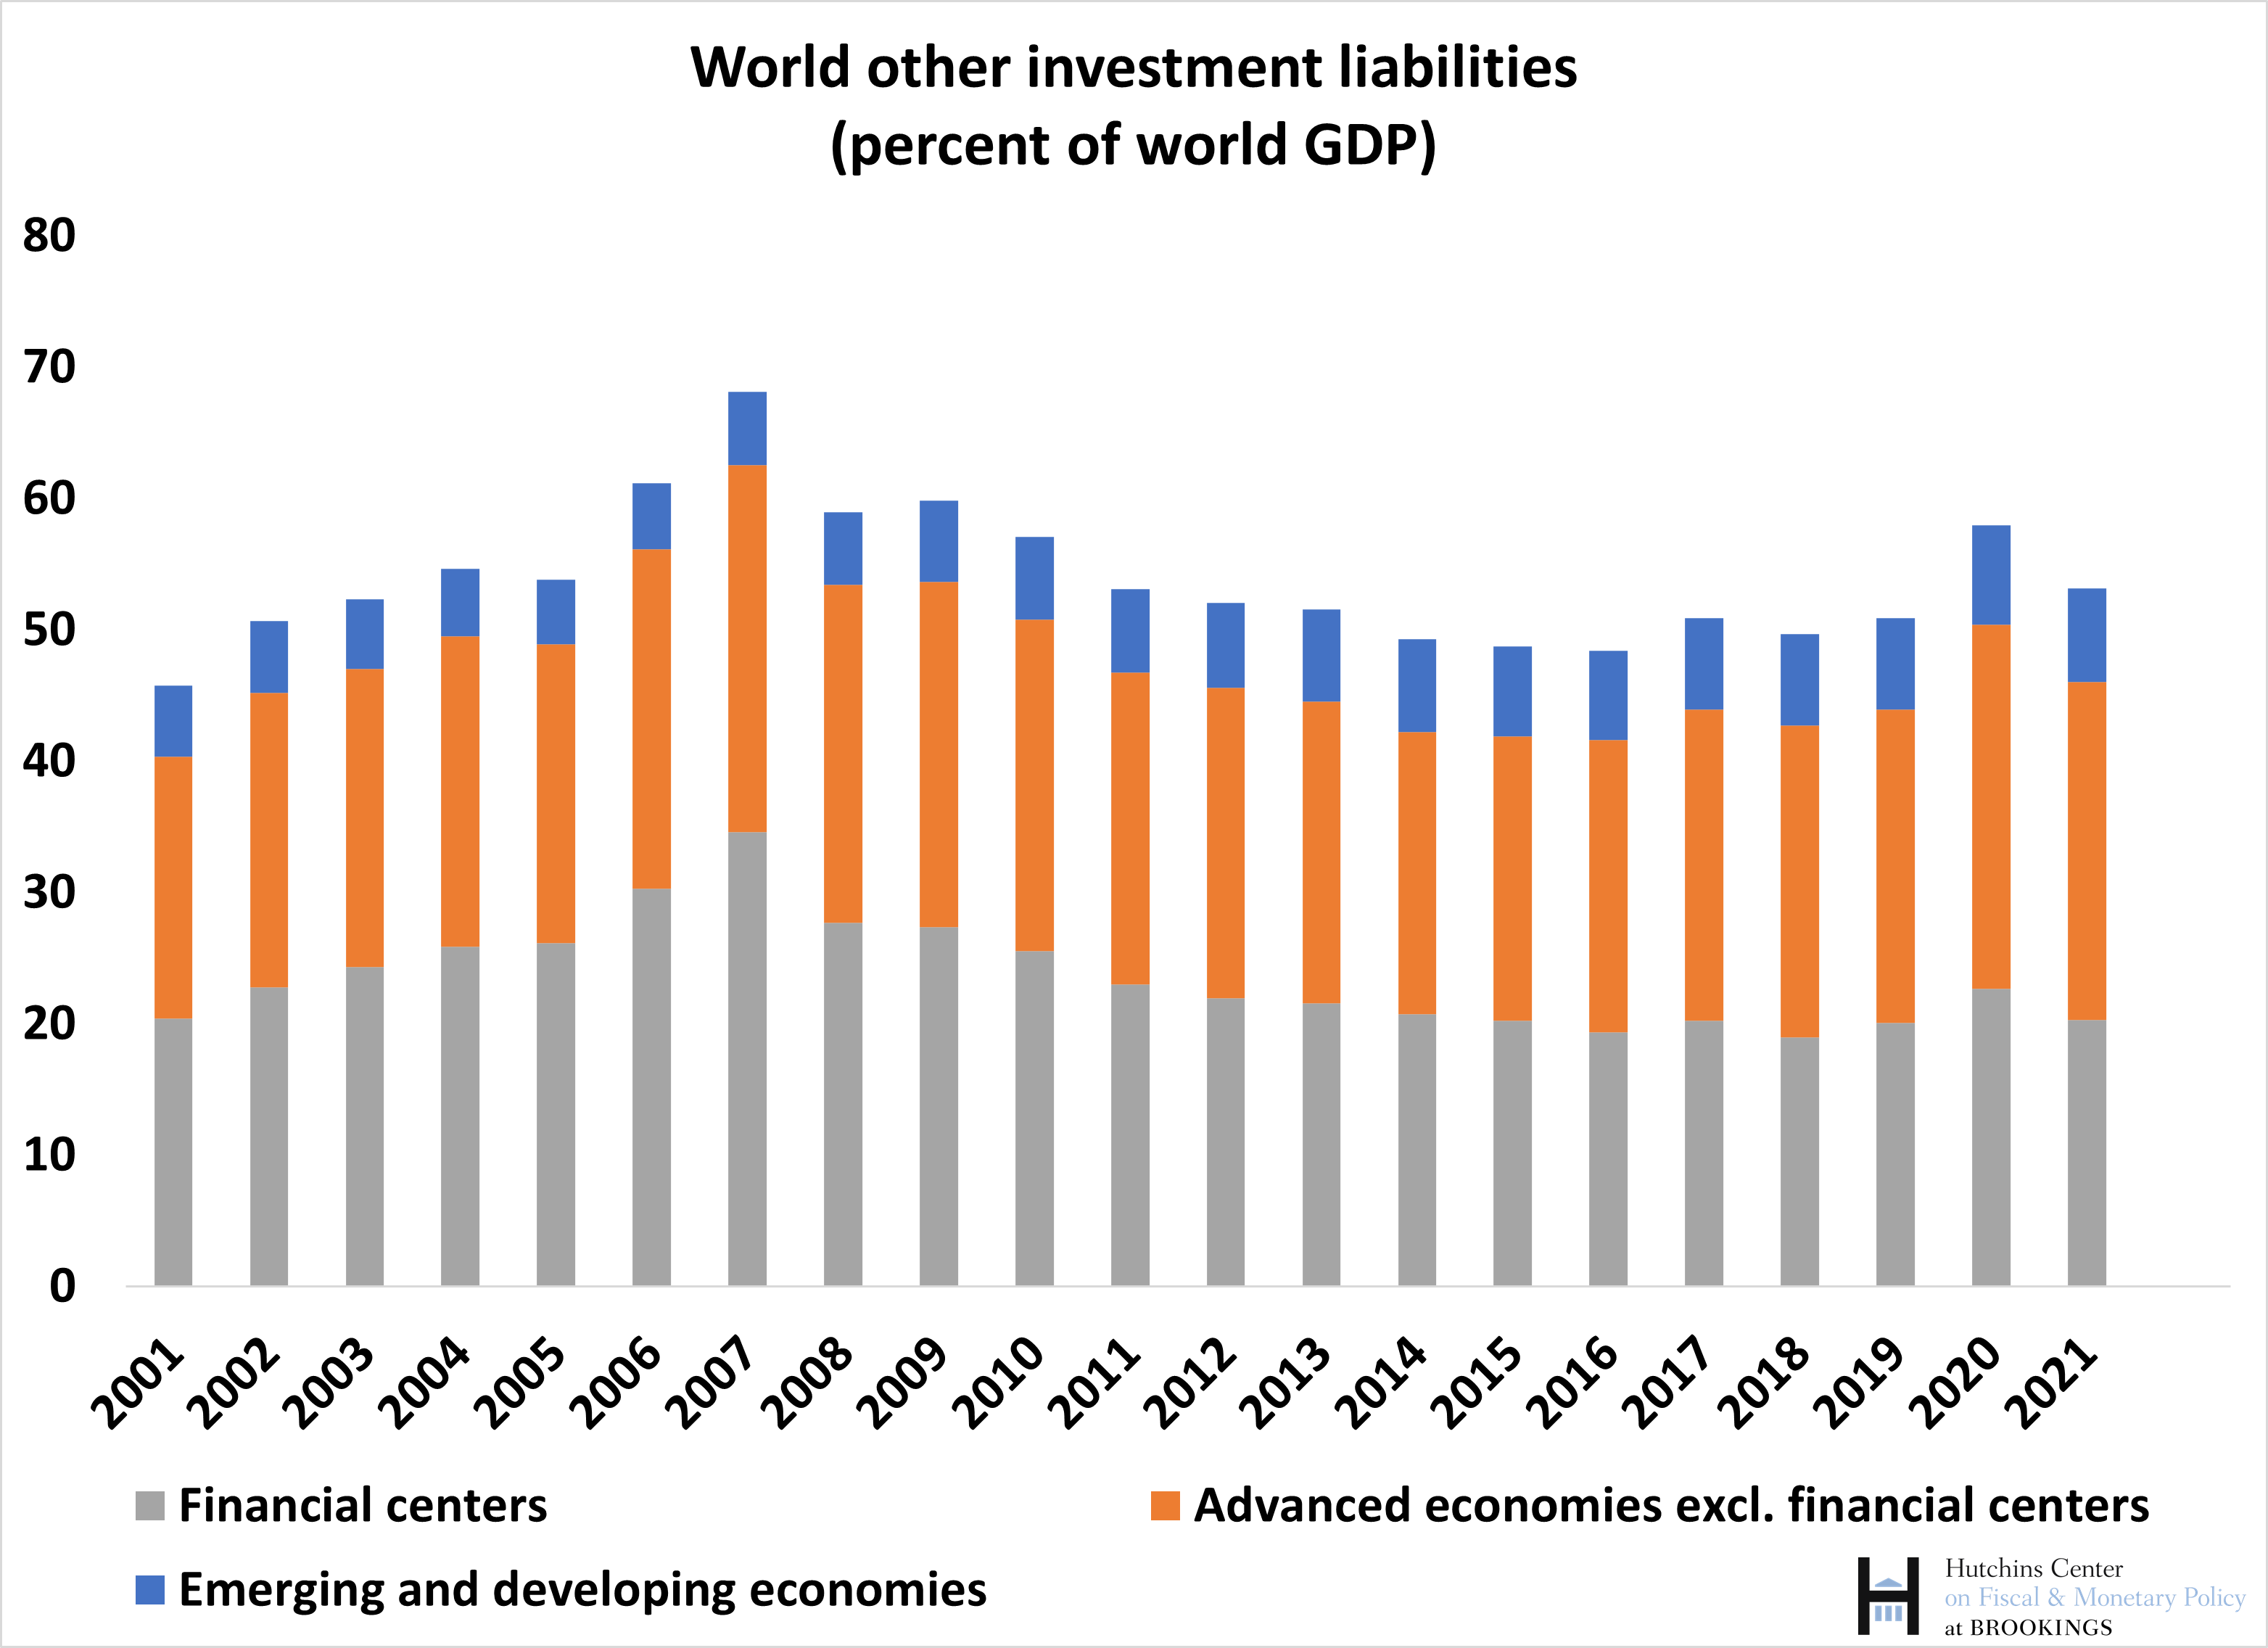
The chart also highlights the size of the external balance sheet of financial centers, a category which includes countries such as Ireland, Luxembourg, the Netherlands, and the United Kingdom, as well as smaller offshore centers such as Bermuda, the British Virgin Islands, and the Cayman Islands. In recent years, however, the size of external liabilities booked in financial centers appear to have stabilized in relation to world GDP (the picture for assets is analogous). To put the size of these holdings in context, financial centers in 2021 accounted for only 7.5% of world GDP, against 42% for emerging and developing economies and just over 50% for other advanced economies.
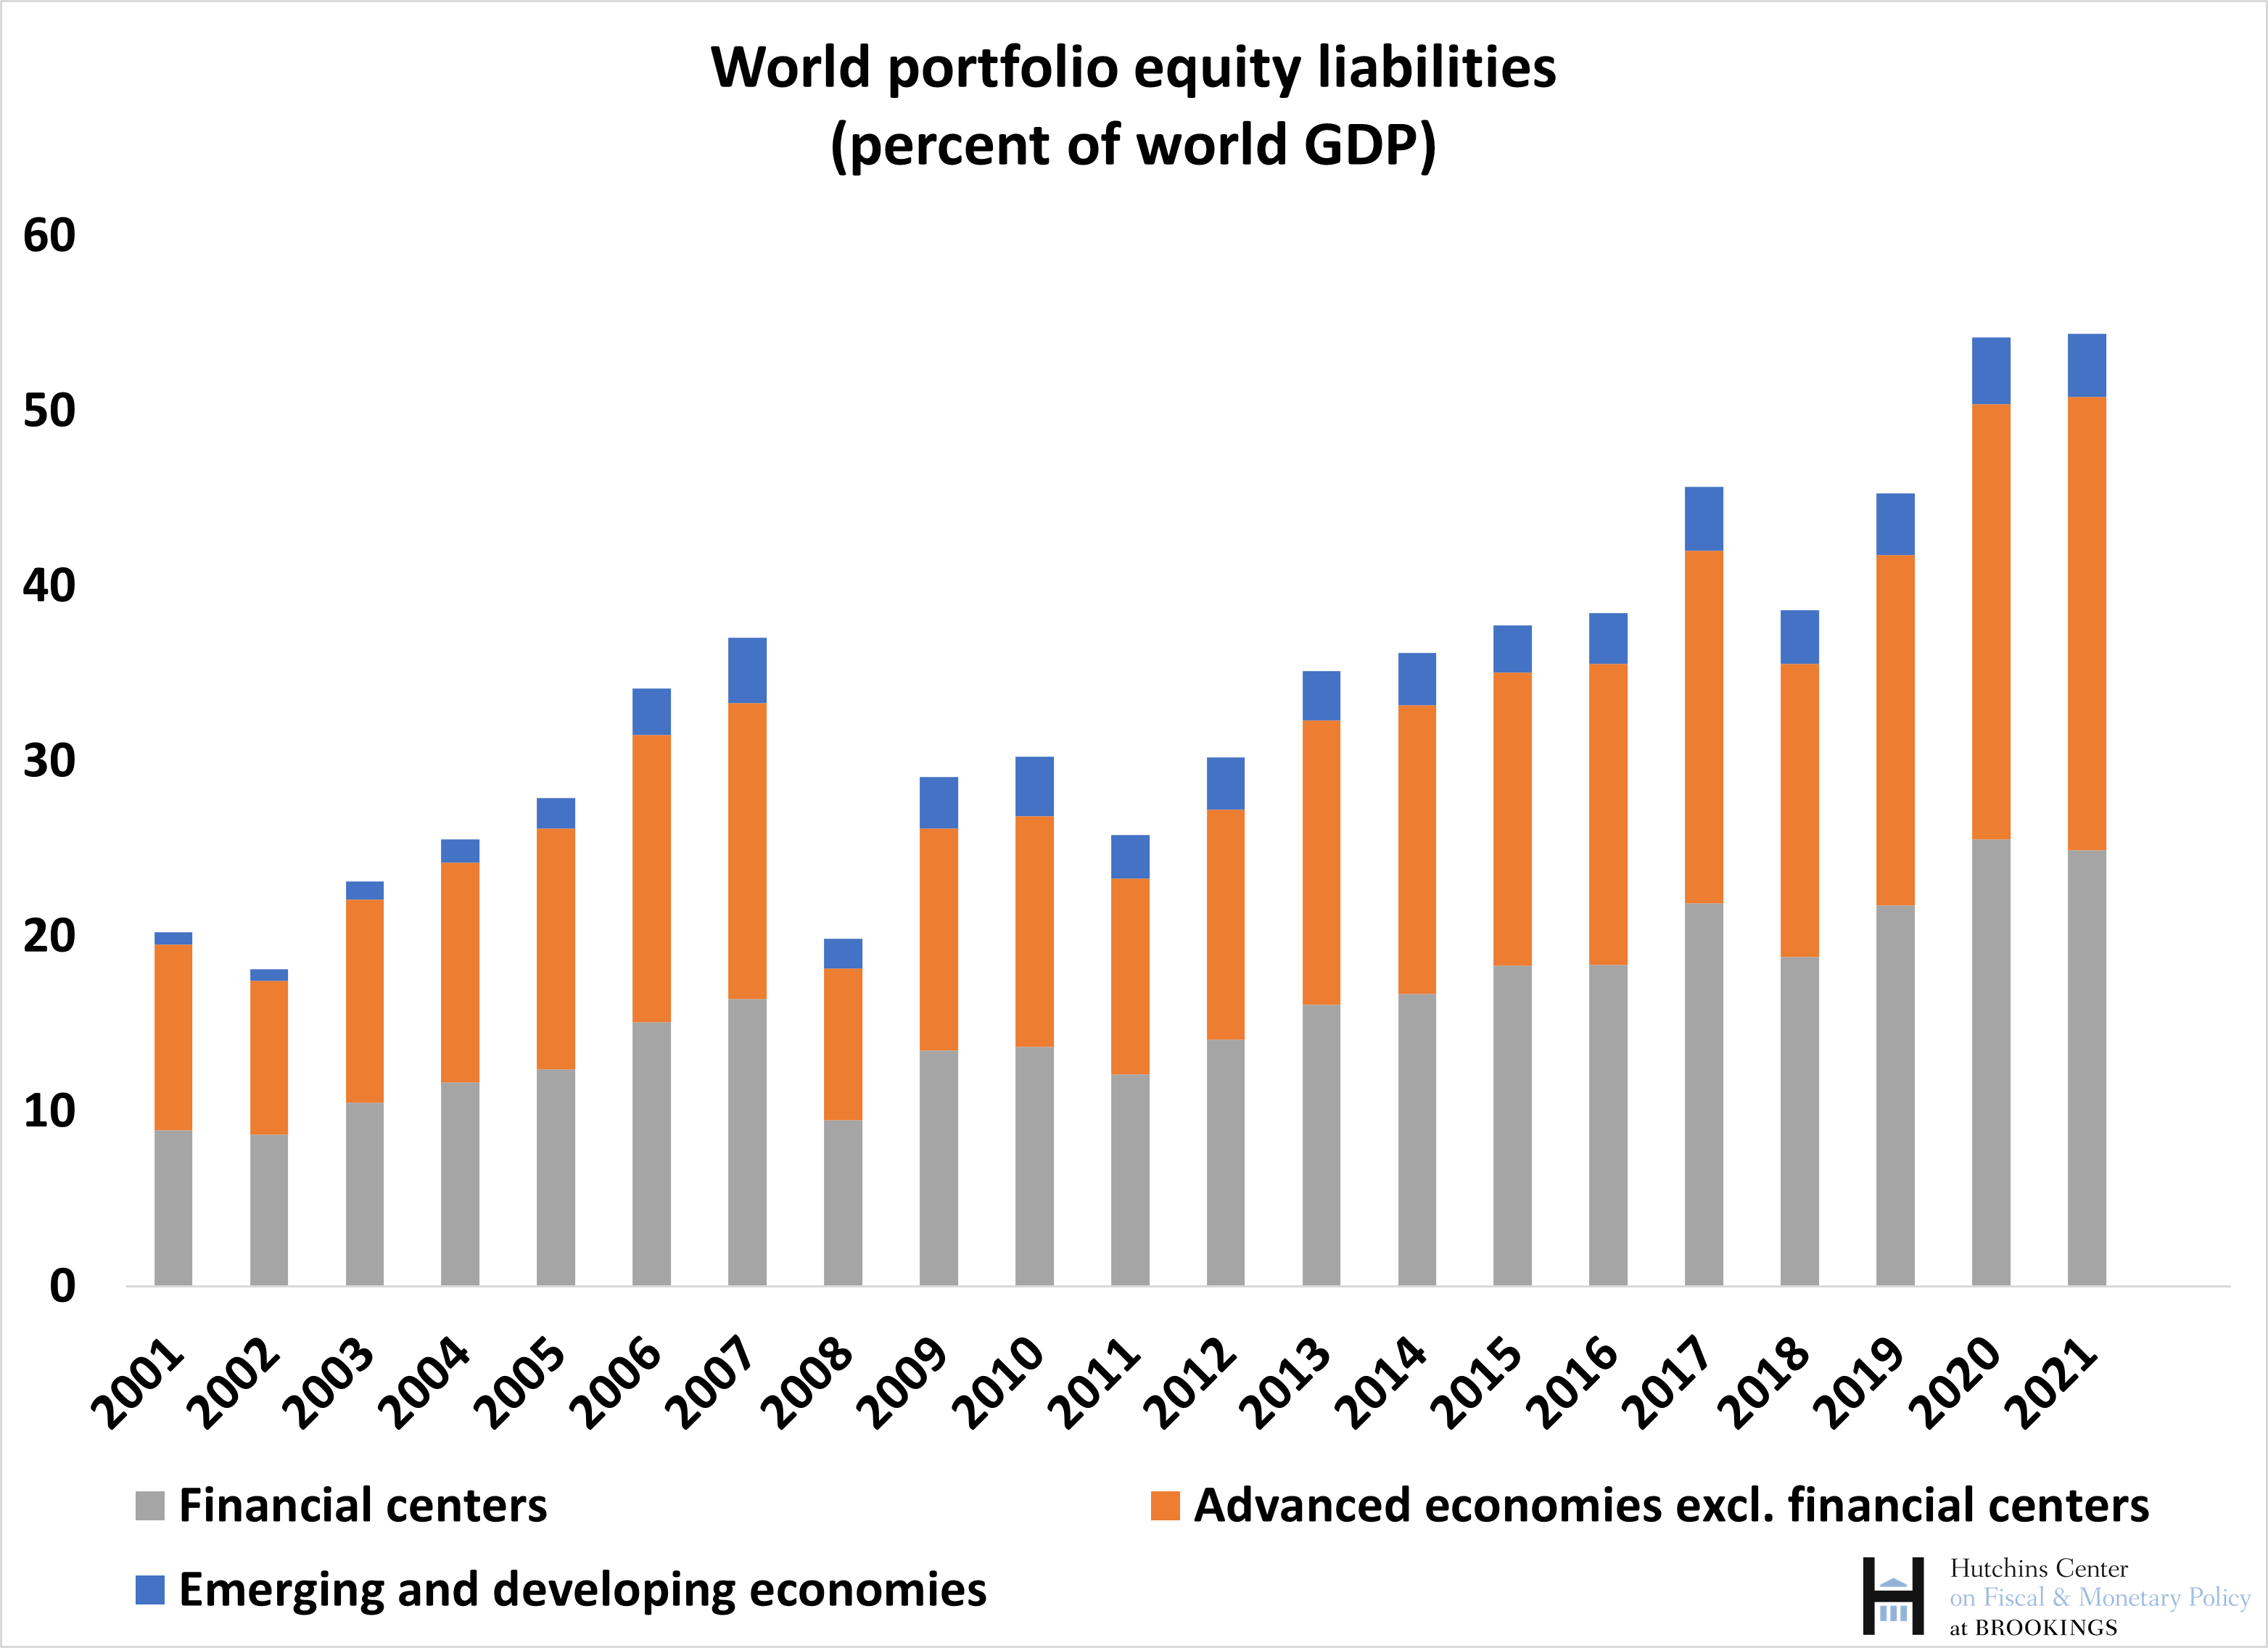
The following chart shows the evolution of portfolio equity liabilities, a category which includes both common stock (shares, mostly listed on stock exchanges) as well as investment fund shares. This category has grown sharply since the global financial crisis, reflecting the large increase in global equity prices as well as the growth in investment in fund shares issued by financial centers (in particular, Ireland and Luxembourg for investment funds in Europe, and the Cayman Islands for hedge fund shares).
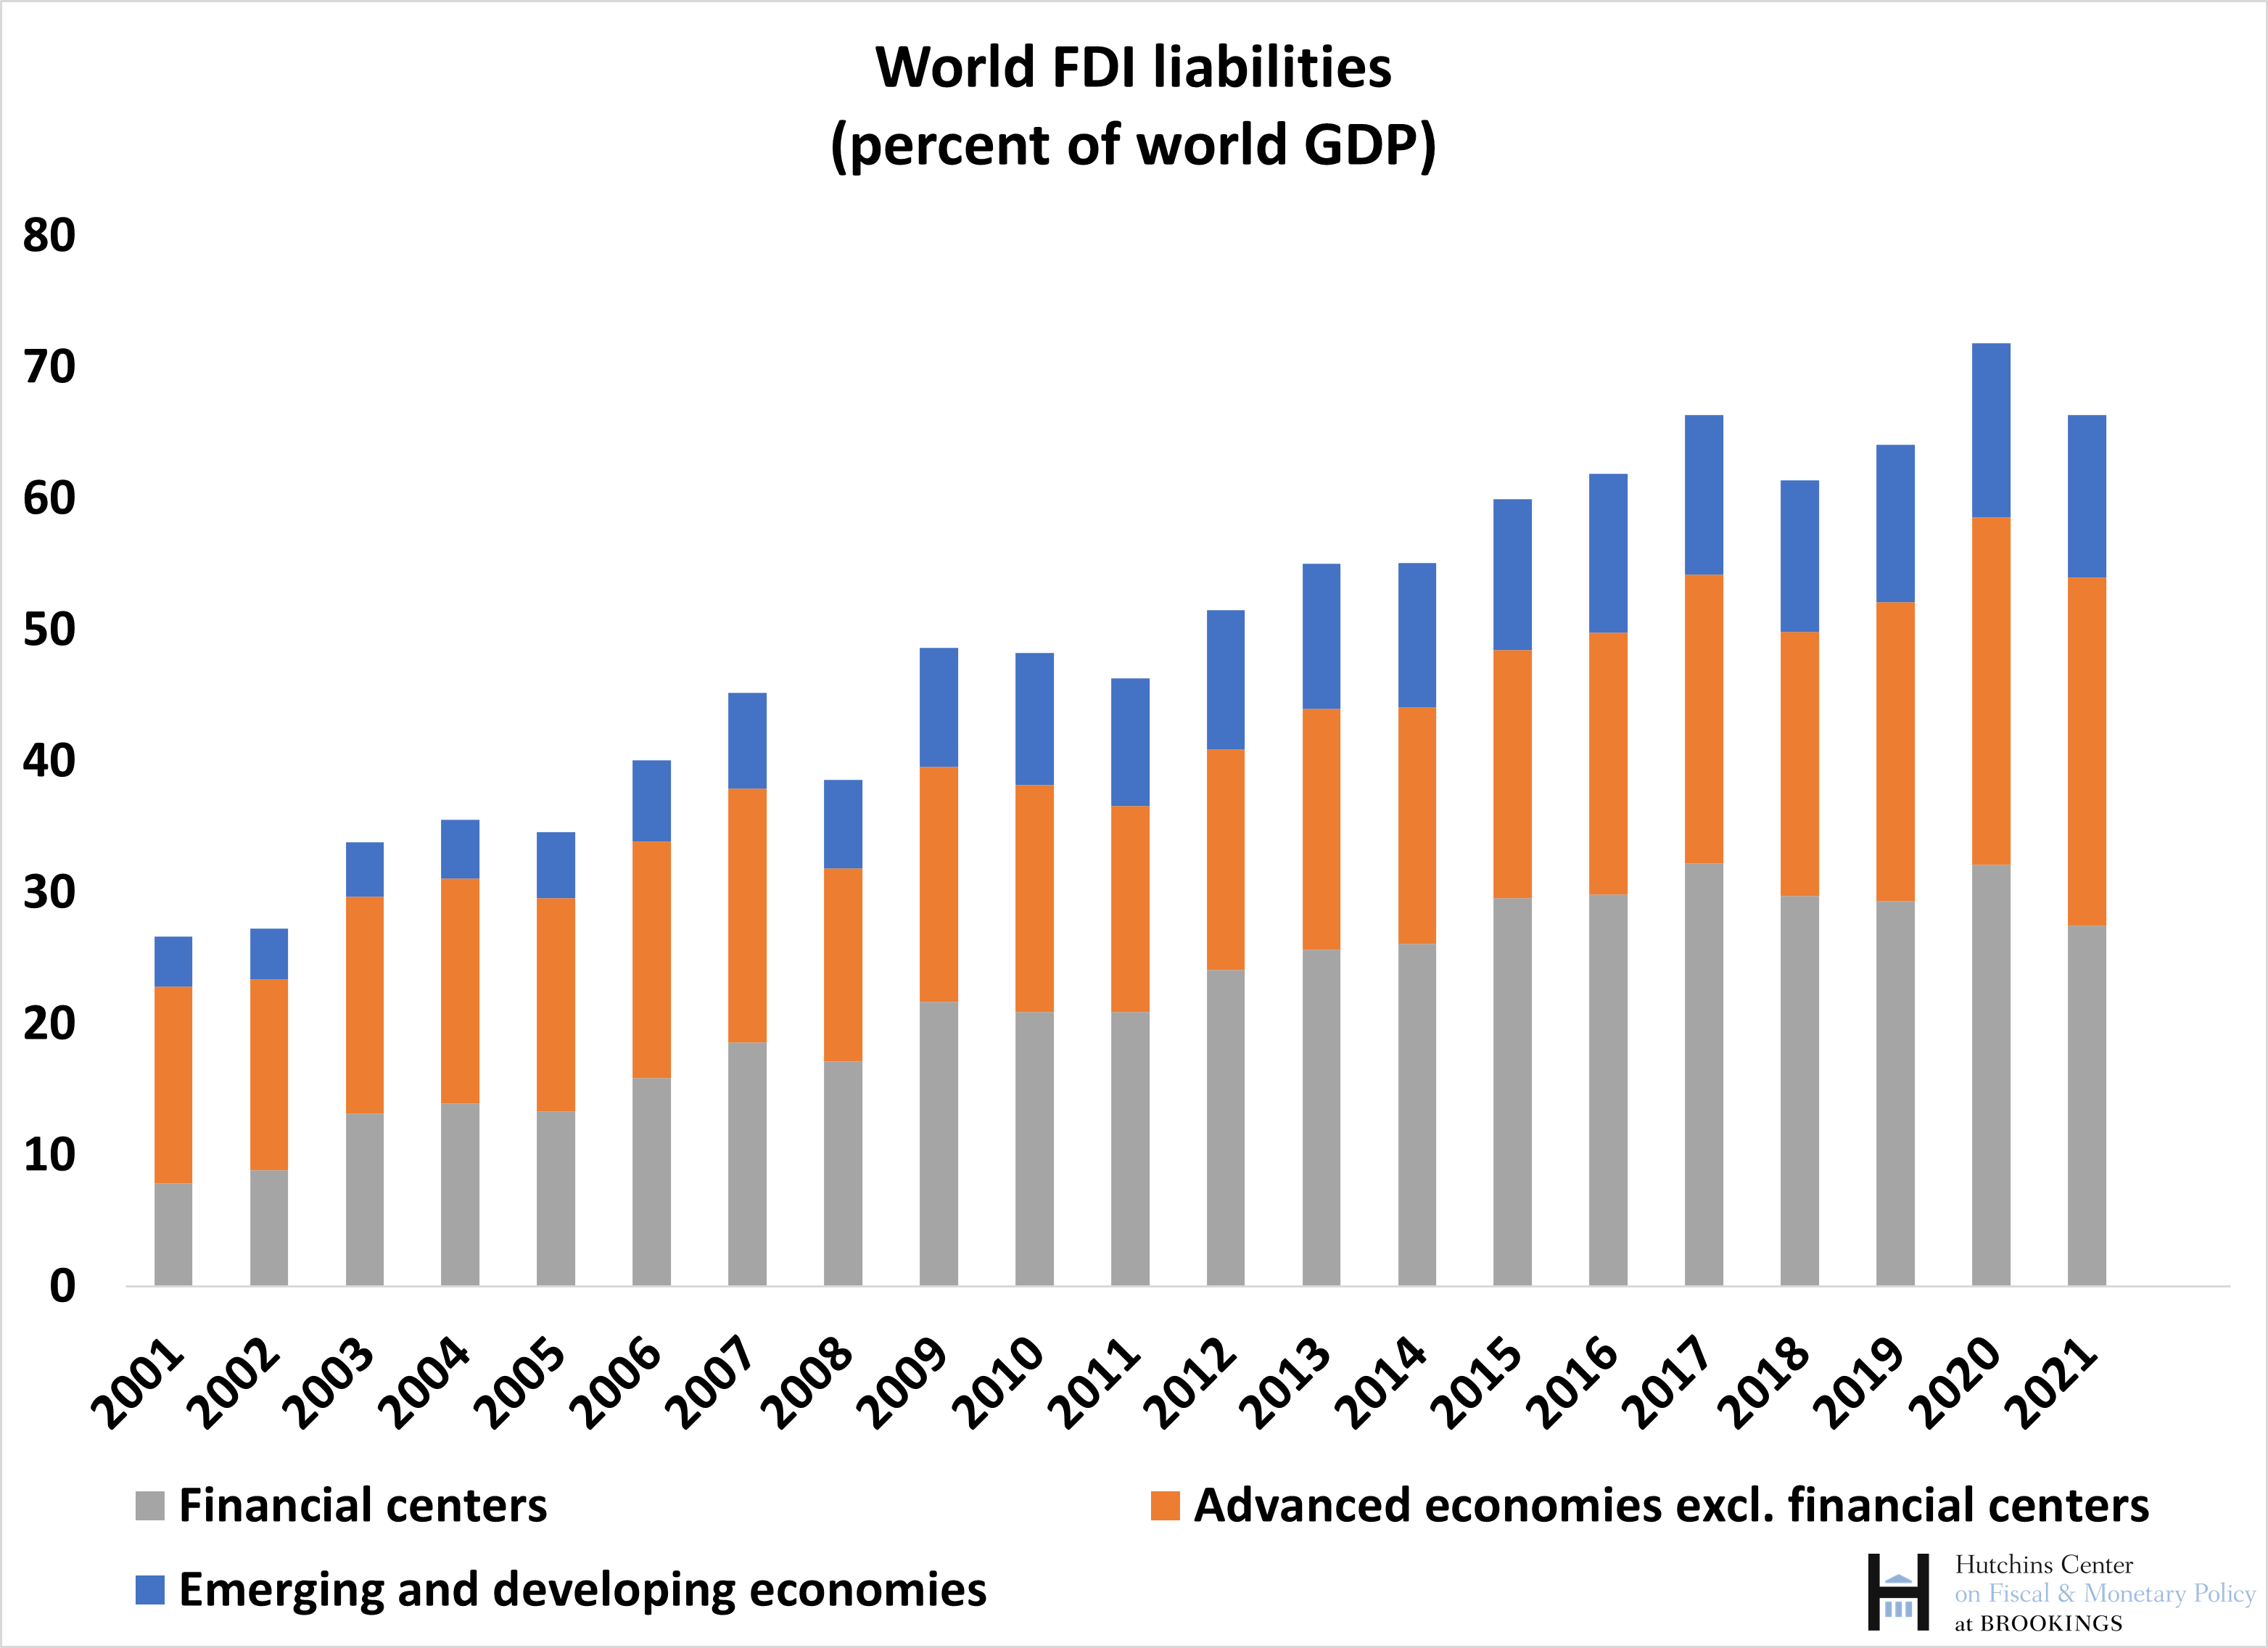
The pattern for foreign direct investment (FDI) follows a broadly similar pattern—indeed, some countries estimate FDI at market value, and hence adjust estimates for rising stock prices. But there is a difference in the pattern for financial centers: specifically, FDI liabilities peaked in 2017 and have declined since (the 2020 observation is less meaningful because the higher ratio is driven by the COVID-induced decline in world GDP). This reflects mainly the unwinding of some special purpose entities in financial centers such as Luxembourg and the Netherlands following the U.S. corporate tax reform of 2017, which typically reduce assets and liabilities by similar amounts as these are pure “pass-through” entities. These same entities had accounted for an important component of the growth in FDI in financial centers during the previous 15 years.
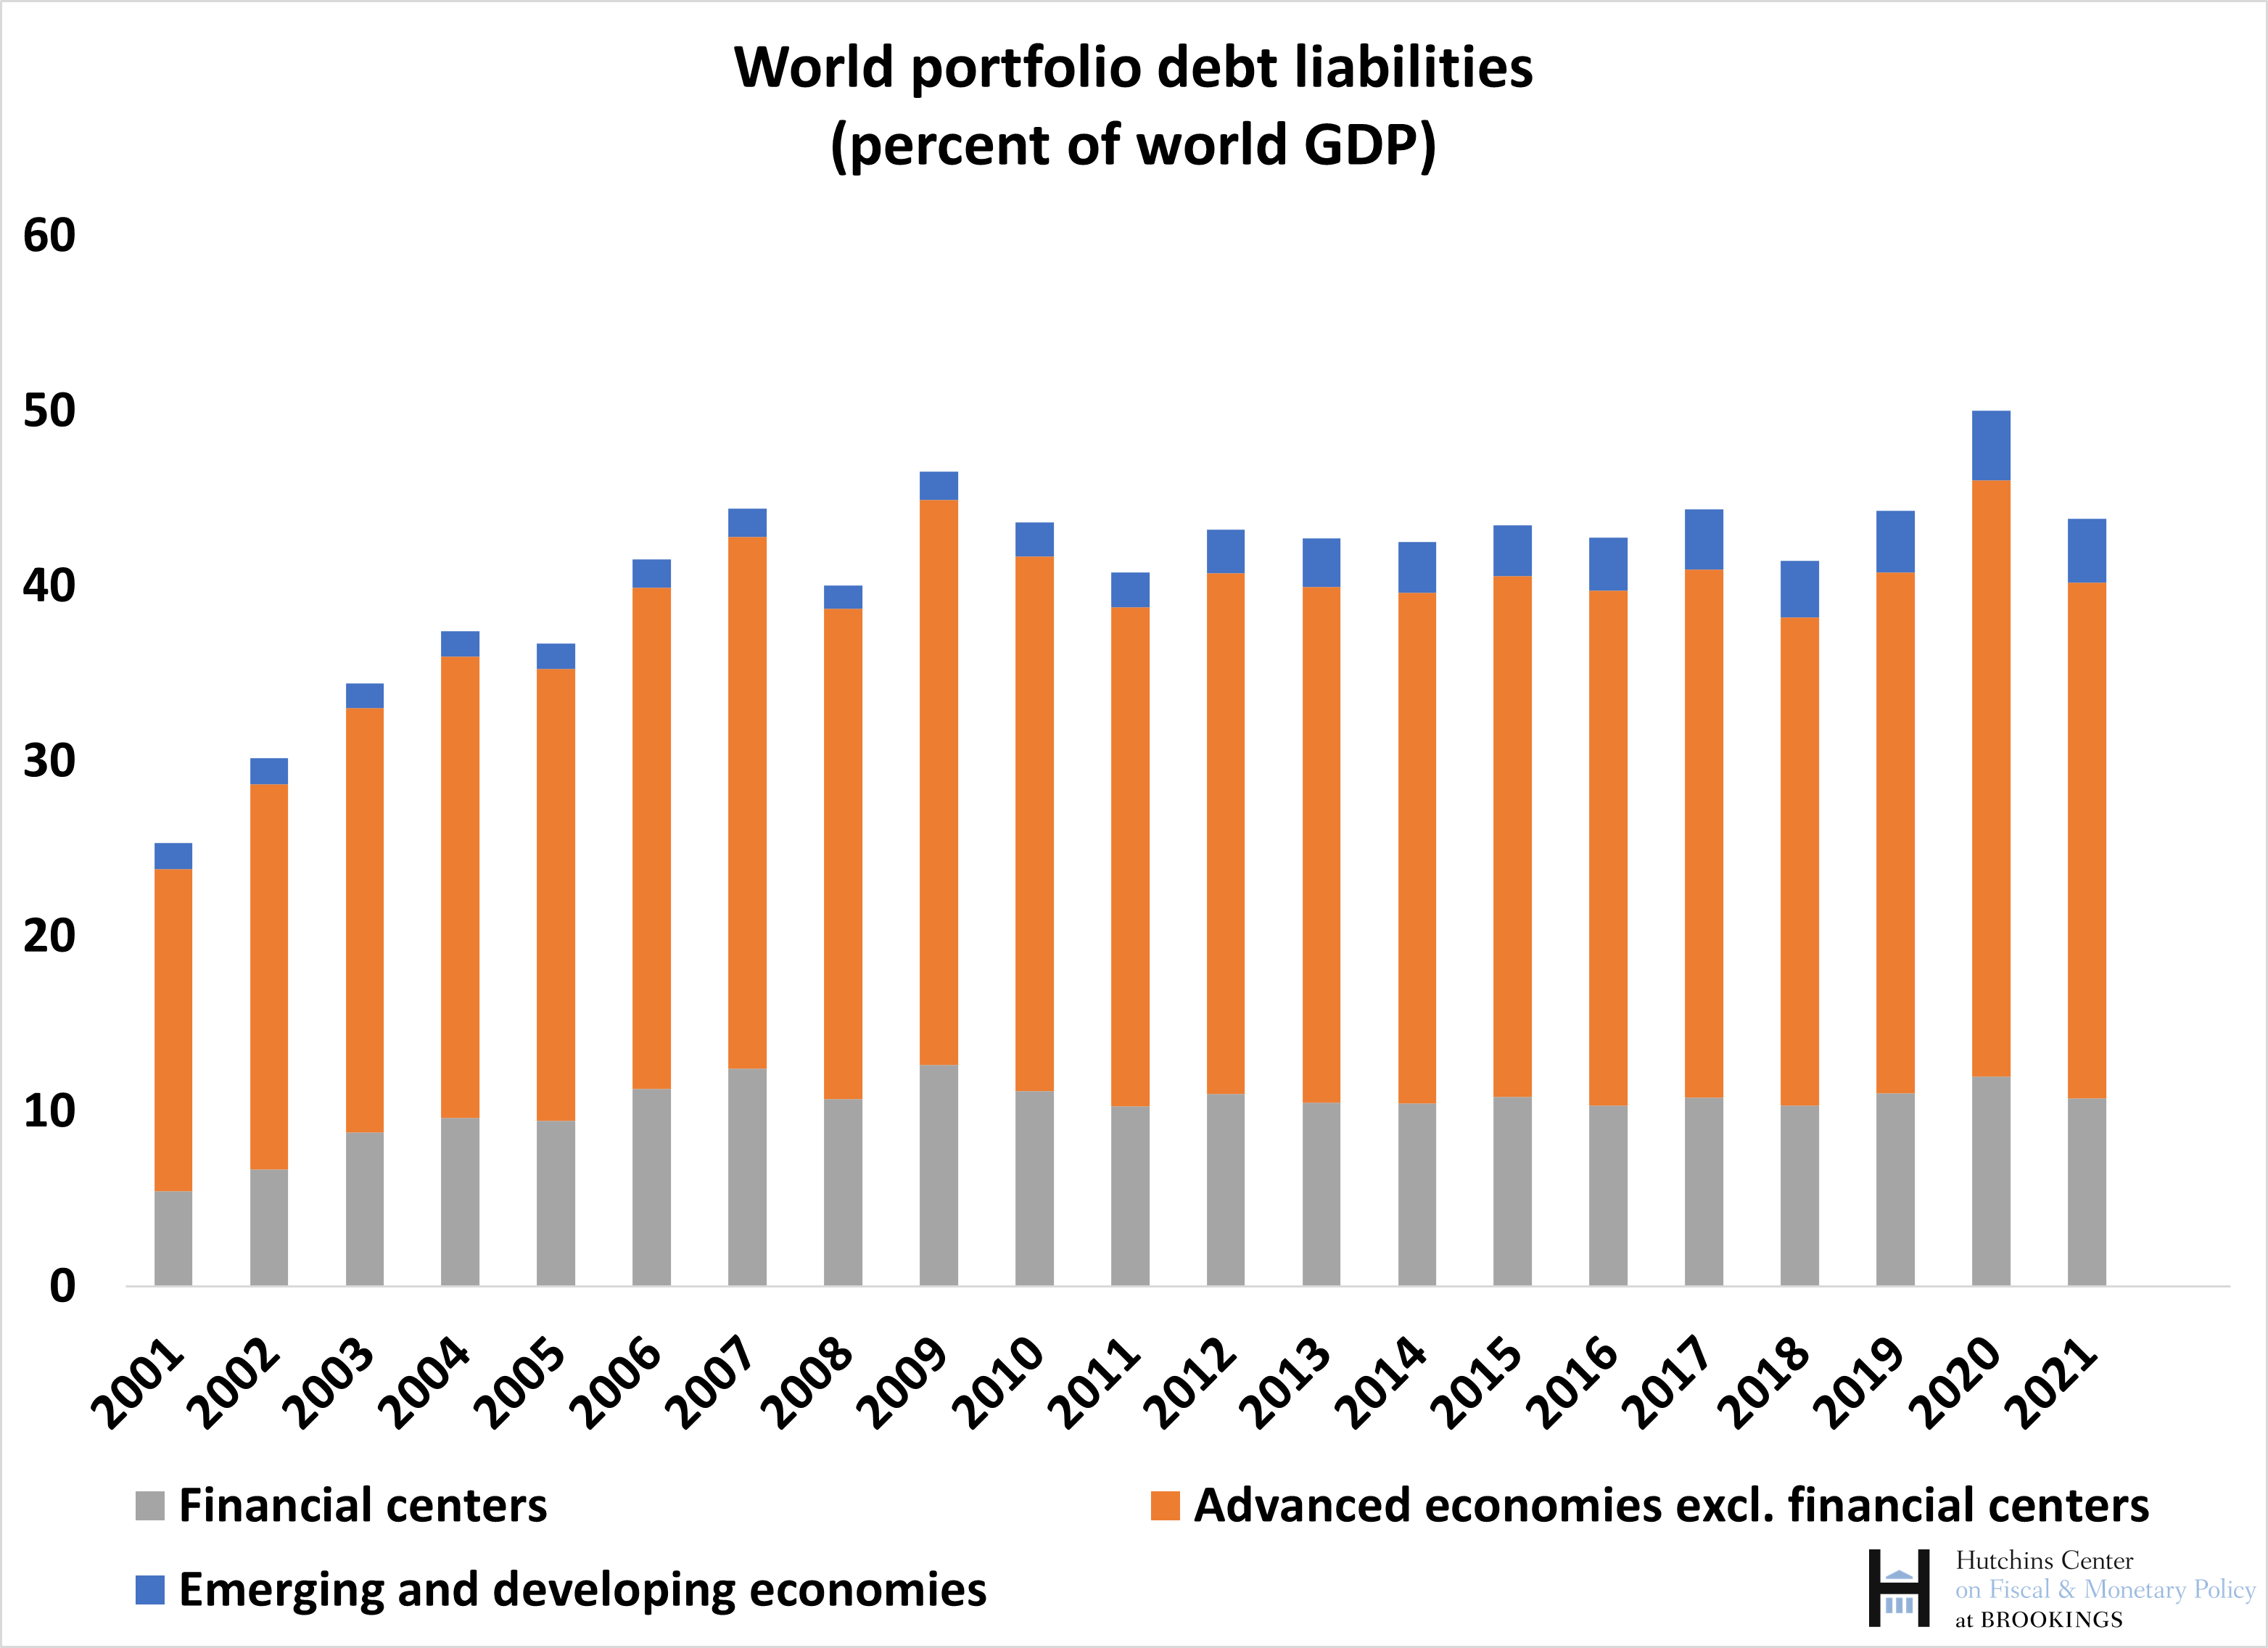
Turning to the categories capturing the behavior of debt instruments, the ratio of portfolio debt instruments (which includes short- and long-term bonds) to world GDP has broadly stabilized after the global financial crisis. Large purchases of government bonds by central banks, the partial fragmentation in euro area bond markets following the 2011-12 crisis, and a slowdown in the accumulation of foreign reserves, which are held mostly in these instruments, were all contributing factors. The size of portfolio debt liabilities in emerging and developing economies has increased in the past decade, as more countries have issued international bonds and as foreign investors have increased participation in local bond markets. It remains relatively modest compared to the overall size of the international bond market. Note, however, that the blue bars understate the size of emerging market bonds outstanding on international markets, because bonds issued offshore by emerging market corporate entities (for instance, by Chinese, Brazilian, Indian, and Russian firms) are classified as liabilities of the offshore center where the issuing entity (an affiliate of the EM parent) resides.
The last liability category we consider, “other investment,” comprises primarily international bank activity in the form of loans, deposits, and trade credits, but also includes activity in these categories by governments and nonbank corporate entities. Here we see the most dramatic shift since the global financial crisis, with a sharp decline in cross-border activity after 2007. This decline reflects the shrinking balance sheets of many large international banks—primarily those from European advanced economies such as France, Germany, Switzerland, and the United Kingdom.
Overall, these data provide a useful characterization of the size and type of financial integration of individual economies with the rest of the world, as well as information on external imbalances and their composition. Their global coverage also allows the analysis of world and regional trends, such as the ones described in this blog. They can usefully be integrated with databases which provide bilateral positions across countries, such as the International Monetary Fund’s Coordinated Portfolio Investment and Coordinated Direct Investment Surveys (CPIS and CDIS, respectively) and the Bank of International Settlements’ statistics on global banking. However, care must be exercised in interpreting the data. This is particularly the case for the past 20 years, where trade in financial assets through financial centers has grown exponentially, as illustrated by the charts in this blog. The routing of financial operations through these centers can obscure the underlying economic linkages across countries (think of a German investor holding a share in Luxembourg of a fund investing in the United States) and the nature of financial instruments (think of the large share of FDI which represents purely financial operations by multinational corporations for regulatory or tax reasons).
The Brookings Institution is financed through the support of a diverse array of foundations, corporations, governments, individuals, as well as an endowment. A list of donors can be found in our annual reports published online here. The findings, interpretations, and conclusions in this report are solely those of its author(s) and are not influenced by any donation.
Author

The Brookings Institution is committed to quality, independence, and impact.
We are supported by a diverse array of funders. In line with our values and policies, each Brookings publication represents the sole views of its author(s).


Commentary
2021 was a year of strong global capital flows: Updating External Wealth of Nations database with year-end 2021 data
December 15, 2022