This analysis is part of The Leonard D. Schaeffer Initiative for Innovation in Health Policy, which is a partnership between the Center for Health Policy at Brookings and the USC Schaeffer Center for Health Policy & Economics. The Initiative aims to inform the national health care debate with rigorous, evidence-based analysis leading to practical recommendations using the collaborative strengths of USC and Brookings.
Earlier this week, the Congressional Budget Office (CBO) published a comprehensive analysis of the American Health Care Act, which is currently being considered by the House of Representatives. While many reactions to the CBO analysis focused on how the AHCA would affect insurance coverage, the bill’s effects on individual market insurance premiums have also received considerable attention.
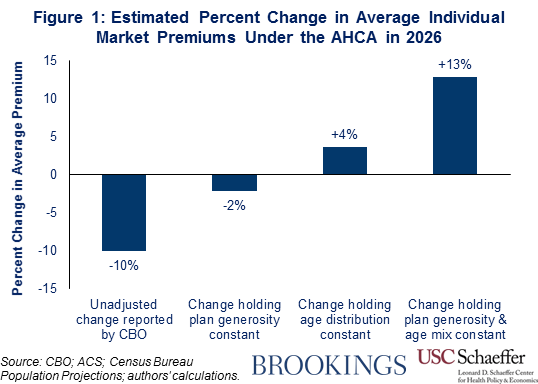
In its report, CBO estimated that average individual market premiums under the AHCA would be 10 percent lower in 2026 than they would be under current law (before considering subsidies). However, as some observers have noted, this estimated change incorporates changes in the generosity of the plans being offered on the individual market, as well as a shift in the composition of individual market enrollment toward younger individuals, who pay lower premiums. The CBO estimate does not, therefore, answer the question of greatest interest, which is how CBO expects the AHCA to affect average premiums for a given generosity of coverage and a fixed population of individual market enrollees.
However, other information provided in CBO’s analysis can be used to answer this question. Using that information, we estimate that premiums would be around 13 percent higher under the AHCA than they are under current law, holding plan generosity and the individual market age distribution fixed at their current law levels. As illustrated in Figure 1, around three-fifths of the difference between this estimate and the CBO estimate of a 10 percent premium decline reflects the adjustment to hold the individual market age distribution constant. The remainder reflects the adjustment to hold plan generosity constant.
It is important to note that all of the premium changes reported in this analysis reflect premiums before accounting for subsidies available to people purchasing individual market coverage. They therefore do not reflect the effects of the AHCA’s changes to those subsidies. The AHCA would cut spending on such subsidies by around half on average, with lower-income people, older people, and people in high-cost areas seeing particularly large reductions. Thus, the increase in average premiums under the AHCA would be much larger if subsidies were incorporated into the analysis.
The remainder of this analysis presents these results in greater detail and briefly discusses the reasons that the AHCA increases individual market premiums when measured on an apples-to-apples basis.
Pitfalls in Interpreting the Premium Estimates Included in the CBO Report
As noted above, CBO estimates that the average premium paid by individual market enrollees in 2026 would be roughly 10 percent lower under the AHCA than it would be under current law (before considering subsidies). For two reasons, however, this estimate must be interpreted with great caution, as it does not mean what it may appear to mean at first glance.[1]
We estimate that premiums would be around 13 percent higher under the AHCA than they are under current law, holding plan generosity and the individual market age distribution fixed at their current law levels.
First, CBO predicts that the AHCA will cause a reduction in the average actuarial value (AV) of individual market coverage. AV measures the share of an individual’s medical costs that are paid for by the insurance plan, rather than by the individual through co-payments, co-insurance, and deductibles. This shift toward lower AV plans will reduce the average premium paid by enrollees. But this will occur because enrollees will be receiving less coverage and be required to pay commensurately more out-of-pocket, not because the cost of purchasing a given amount of coverage has fallen.
Second, CBO predicts that changes made by the AHCA—notably, relaxing limits on how much premiums can vary by age and changing the structure of the individual market subsidies in ways that favor younger individuals relative to older individuals—will increase the share of individual market enrollment accounted for by younger individuals. Because younger individuals pay lower premiums than older individuals, this type of compositional shift can reduce the overall average premium dramatically, even if premiums at any given age remain unchanged or even rise.
Because of these two effects, CBO’s estimate that the average premium would fall by 10 percent under the AHCA does not reflect how the AHCA changes average premiums for a given generosity of coverage and for a fixed population of individual market enrollees. It is therefore of limited use for making apples-to-apples comparisons of how the AHCA affects the overall cost of health insurance coverage.
Deriving Comparable Estimates of Premiums Under Current Law and the AHCA
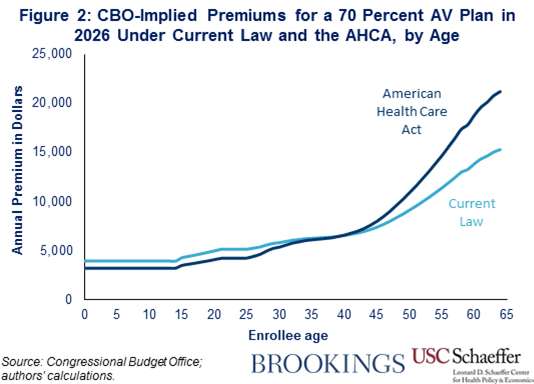
While the 10 percent figure does not answer the question of greatest interest, other information in CBO’s analysis can be used to construct a more informative comparison. In particular, Table 4 of the CBO report displays the premium for a plan with a 70 percent AV under current law in 2026 for individuals at three ages: 21 years old, 40 years old, and 64 years old. The CBO table also reports premiums for a plan with a 65 percent AV under the AHCA for the same three ages and the same year.
Related Books

This information can be used to determine what CBO expects premiums to be under current law and under the AHCA at all ages. To facilitate an apples-to-apples comparison between plans, we then adjust the AHCA premiums to reflect an AV of 70 percent, which approximates the average individual market AV CBO expects under current law in 2026 (before accounting for cost sharing reductions).[2] The details of these calculations (and subsequent calculations) are described in the methodological appendix.
The resulting AV-standardized premiums are displayed in Figure 2 below. As the figure shows, premiums for the same coverage rise for individuals age 39 and older, but fall for younger individuals. This result emphasizes the importance of adjusting for actuarial value when making these comparisons. Whereas CBO’s unadjusted estimates imply that a 40 year old would see an 8-10 percent premium decrease under the AHCA, this individual would, in fact, pay roughly the same amount as under current law for the same coverage. Notably, the dollar increases in premiums for older individuals are much larger than the dollar decreases in premiums for younger individuals. For example, AHCA premiums are more than $3,000 higher for all individuals age 55 or older, while the largest premium decreases under the AHCA, which affect individuals ages 21 to 24, total less than $900.
The final step in this analysis is to use the age-specific premiums reported in Figure 2 to estimate the change in the average premium for the population of individual market enrollees expected under current law. Doing so requires knowing the share of individual market enrollment CBO projects to be accounted for by people of each age under current law.[3] CBO does not specify its precise projected age distribution of individual market enrollment. As a proxy, we use estimates of individual market enrollment by single year of age from the American Community Survey (ACS) for 2015, projected forward to 2026 using population projections from the Census Bureau. While only an approximation of CBO’s actual estimates, having CBO’s actual age distribution would be very unlikely to change the qualitative results of this analysis. In fact, as discussed in the appendix, our approach is likely conservative, as the alternative approaches we considered would generally strengthen our main findings.
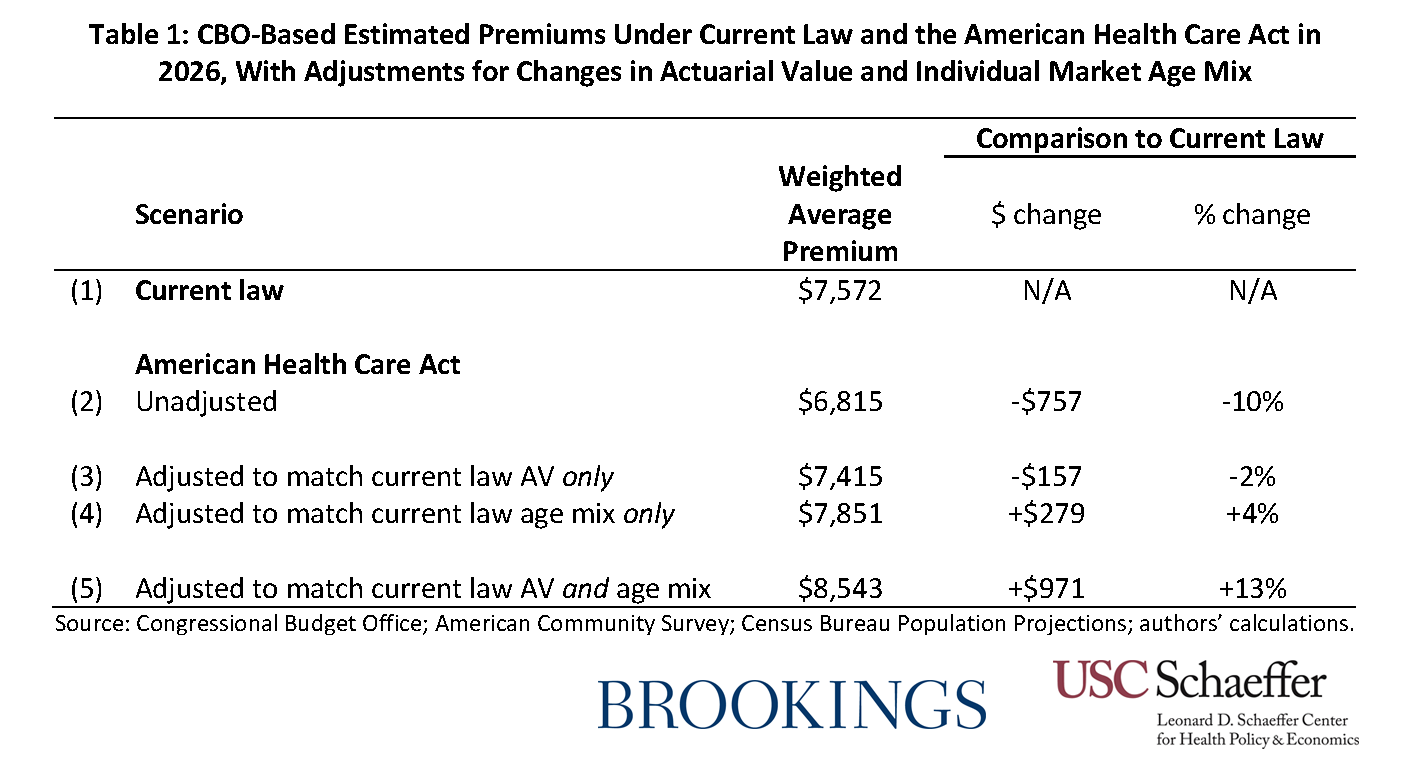
The resulting average premiums under both current law and the AHCA, holding both AV and the age distribution fixed at its current law levels, are displayed in rows 1 and 5 of Table 1, respectively. As indicated in the table, after adjustments to hold AV and the enrollee age distribution fixed, the AHCA increases individual market premiums by $971 per enrollee or around 13 percent.
This estimate contrasts starkly with the 10 percent unadjusted decline reported by CBO and reproduced in row 2 of Table 1. Rows 3 and 4 of Table 1 decompose the overall difference between the two estimates into the portion attributable to the AV adjustments and the portion attributable to the age distribution adjustments. Around three-fifths of the difference is attributable to the age distribution adjustment, while the remainder is attributable to the AV adjustment.[4] Notably, with a constant age distribution, average premiums increase under the AHCA even without accounting for reduced plan generosity. Put differently, average premiums fall in CBO’s analysis only because CBO also concludes that older individuals are disproportionately likely to drop individual market coverage under the AHCA.
Why do premiums rise under the house bill?
The results presented above demonstrate that, measured on an apples-to-apples basis, the CBO estimates indicate that the AHCA would increase premiums for individual market coverage on average. This conclusion should not be surprising in light of the policy changes included in the AHCA.
Most importantly, the AHCA would repeal the individual mandate, which CBO has previously predicted would reduce enrollment among healthier individuals, thereby increasing premiums by about 20 percent.[5] CBO’s analysis of this legislation indicates that the AHCA’s “continuous coverage” provision, which requires individuals with a break in coverage in the last year to pay a 30 percent higher premium when they enroll in individual market coverage, would cause additional reductions in individual market enrollment of around 2 million. CBO expects that the lost enrollees would be disproportionately healthy, so this enrollment loss would cause further premium increases. The reduction in subsidies under the AHCA may also exacerbate adverse selection in the individual market.
The total premium increase is less than 20 percent, however, because CBO expects the premium increases from these provisions to be partially offset by the Patient and State Stability Fund created by the AHCA.[6] CBO predicts that a significant portion of these funds will be used to finance reinsurance programs that compensate insurers for a portion of the claims costs of high-cost enrollees, thereby reducing individual market premiums. As we have noted previously, however, the total funding available for this program is relatively modest relative to total individual market premiums, so it is unsurprising that premiums rise on net when measured on an apples-to-apples basis.
Methodological Appendix
This appendix provides additional methodological detail on the calculations in the main text.
Deriving premiums for all ages: We use the premiums reported for the three specific ages given in Table 4 of the CBO report to impute premiums at all ages. For current law, these calculations are straightforward because the “age curve” that determines how premiums vary with age is specified in regulation.[7] For the AHCA premiums, however, we must infer how CBO expects the age curve to change in response to the AHCA’s provision that increases the amount that premiums are permitted to vary by age. We assume that CBO used the same approach used by tworesearch groups who previously analyzed the effects of this AHCA provision. Those groups assumed that the age factors for individuals ages 21 or older would be set equal to twice the age factors under current law minus 1; age factors for individuals under age 21 would be left unchanged.[8] This approach exactly reproduces the ratio between the premiums for the three ages reported by CBO (apart from very small differences that can be explained by rounding), giving us confidence that CBO did indeed use this age curve.
Determining average AV in 2026 under current law: CBO does not explicitly state the average individual market AV it expects in 2026 under current law. However, information provided in the report allows us to infer that CBO expects the average AV to be around 70 percent. In detail, Table 4 allows us to compute the percentage difference in premium between a 65 percent AV plan under AHCA and a 70 percent AV plan under current law at three ages. The resulting percentage differences at each age are close to the overall differences in average premiums for those ages that CBO reports in the main text. Because CBO explicitly states that it expects an average AV of 65 percent under the AHCA in 2026, this implies that CBO expects an average AV of around 70 percent under current law in 2026. An additional basis for this conclusion is that the average actuarial value of Affordable Care Act compliant policies (before considering cost sharing reductions) was 69.8 percent in 2015, and there is little reason to expect average AV to change dramatically over time.
Adjusting premiums for differences in AV: In this analysis, we adjust premiums for differences in actuarial value. In doing so, we assume that 80 percent of individual market premiums reflect claims costs that would be affected by changes in actuarial value. We further adjust for changes in utilization associated with changes in cost sharing using a price elasticity of -0.2, the conventional value in this context. These parameters imply that the premium for a plan with a 70 percent AV should be 8.8 percent (=0.8*[{0.7/0.65}*{1 + -0.2*ln(0.3/0.35)}]) higher than the premium for a plan with a 65 percent AV.
Estimating the individual market age distribution under current law: We base our estimates of the individual market age distribution under current law on tabulations of the 2015 American Community Survey by single year of age. We count individuals as having individual market coverage if report having directly purchased coverage and do not report coverage through an employer, Medicare, Medicaid, TRICARE, or the VA. We exclude individuals age 65 or older since these individuals are unlikely to have individual market major medical coverage. To project this enrollment distribution forward to 2026 under current law, we assume that enrollment in each age bin grows in accordance with the Census Bureau’s most recent projection of overall population growth in that age bin.
We investigated alternative sources of data on the on the individual market age distribution. Estimates from the Current Population Survey generated nearly identical results. Estimates using the National Health Interview Survey (NHIS) and Marketplace administrative data both suggest modestly larger adjusted premium increases. While we believe there are reasons to prefer the NHIS-based estimates, we have elected to use the American Community Survey estimates in the interest of being conservative.
[1] There may be an additional factor that complicates interpretation of the CBO 10 percent figure. In particular, the AHCA would cause particularly large reductions in the subsidies available to individual market enrollees in high-premium areas, likely driving a shift in the composition of individual market enrollment away from high-premium areas and toward low-premium areas. This shift in geographic composition of individual market enrollment could affect the 10 percent figure in much the same way as the changes in age composition discussed in the main text. However, it is unclear to what extent these types of geographic enrollment shifts were incorporated in CBO’s analysis, so we do not make any adjustment for them in this analysis.
[2] Note that the amounts reported in the figure may understate the premiums for a plan with this AV under the AHCA. CBO indicates that, under the AHCA, it expects that some insurers may be reluctant to offer plans with actuarial values much above 60 percent. If this is the case, then plans with AVs at this level may be offered at a relatively high premium or may not be available at any price.
[3] This analysis focuses on premium changes holding the age distribution of individual market enrollees fixed at what it would be under current law since effects on current individual market enrollees are of particular interest. Similar calculations could be done using other age distributions. Because these alternative distributions would weight different ages differently, this could change the quantitative conclusions of this analysis to some degree. However, the qualitative conclusions that the AHCA will increase premiums, holding AV and the age distribution constant, would continue to hold under any reasonable alternative distribution.
[4] The share of the difference accounted for by the age distribution adjustment depends on whether than adjustment is made before or after adjusting for AV. The text reflects the former approach. Under the latter approach, the age mix adjustment accounts for around two-thirds of the total difference.
[5] It is unclear whether CBO’s estimate of the effect of repealing the individual mandate adjusts for changes in individual market age mix or plan generosity. It is possible that a portion of CBO’s estimate of the effect of repealing the individual mandate reflects these factors.
[6] As noted earlier in this analysis, we focus on changes in premiums before considering changes in subsidies paid directly to individuals. However, the reinsurance programs supported by the Patient and State Stability Fund are also, in effect, subsidies to individual market enrollment. Arguably, a true “pre-subsidy” premium increase under the AHCA should exclude this effect, which would make the premium increase under the AHCA even larger.
[7] Because this analysis concerns 2026, we use the age curve that the Centers for Medicare and Medicaid Services (CMS) finalized for plan years 2018 and later. This age curve differs from the age curve in effect for the 2017 plan year for individuals under the age of 21.
[8] We are uncertain whether CBO exactly matched the approach used by other researchers or whether it modified the age factors that apply to children. If the age rating approach under the AHCA were implemented in practice, those factors would likely need to modified in order to avoid setting premiums too low for children’s coverage. Since it would likely be within HHS’ authority to make such an adjustment, we think it is possible that CBO assumed that such an adjustment would occur in making its projections. If CBO did make such an adjustment, then the AV- and age-adjusted premium increase under the AHCA would be larger than we report here.
Related Content

Authors


The Brookings Institution is committed to quality, independence, and impact.
We are supported by a diverse array of funders. In line with our values and policies, each Brookings publication represents the sole views of its author(s).


Commentary
How will the House GOP health care bill affect individual market premiums?
March 16, 2017