Last week’s headlines around the release of new Census Bureau data spotlighted a continued rise in income inequality. The Gini index—a statistical measure of income inequality—rose to its highest recorded level in 50 years, signaling that the distribution of income in the United States is the most uneven it’s been since the Bureau began tracking it in 1967.
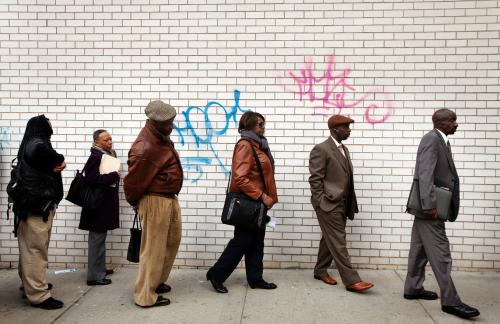
That disturbing trend, however, masks the economic progress Black households have made in recent years. In 2018, their median household income (the level at which half of households have higher incomes, and half lower) reached $41,511. While that level only slightly exceeded that (and was statistically unchanged) from 2017, it continued to top 2007’s pre-recession peak for Black median household income of $41,134.

Equally promising was the geographically widespread increase in incomes Black households experienced. Of the 50 metropolitan areas with the largest Black populations, 18 registered a statistically significant increase in median income for those households between 2013 and 2018. (In 31 of these metro areas, the estimated change was positive, though not statistically different from zero, due to sample size/variation in the American Community Survey.)[1]

Metro areas in the West and South recorded the largest statistically significant increases in Black median household income. San Francisco and Seattle topped the list, with their typical Black households earning at least 30% more in 2018 than 2013. Phoenix, Riverside, Calif., Tampa, Fla., and Orlando, Fla. were among other Sunbelt metro areas where Black households experienced large income gains across that five-year period.
Meanwhile, the five metropolitan areas with the largest Black populations—New York, Atlanta, Chicago, Dallas, and Washington, D.C.—also saw Black median household incomes increase significantly, from rates of 7% in Greater D.C. to 21% in Greater Atlanta.
What accounts for this progress in Black incomes? One likely factor is increased employment opportunity. The share of prime-age (25- to 54-year-old) Black adults in jobs increased significantly in 38 of the 50 metro areas from 2013 to 2018. In the metro areas with the largest increases in Black median household incomes, employment rates for Black adults rose anywhere from 5.6 percentage points (Riverside) to an astonishing 12.7 percentage points (San Francisco) during that period. There was a positive, significant association between the change in Black employment rates and Black median household incomes across metro areas from 2013 to 2018.
Increased employment did not always translate into increased income for Black households, however. In Pittsburgh, for instance, the employed share of prime-age Black adults rose from 63% in 2013 to 73% in 2018, with Black men experiencing a particularly pronounced rise. But Black median household income in Pittsburgh remained unchanged. There, and in metro areas such as Augusta, Ga. and Milwaukee, a strong regional economy may have succeeded in helping unemployed Black workers off the sidelines, but largely into lower-paying jobs that failed to boost typical standards of living for Black households. A new report finds that Pittsburgh exhibits high “occupational segregation” for Black men, limiting their access to higher-paying fields.

In other metro areas, income and employment trends for Black residents may reflect not only improving outcomes, but also changing local populations. In the San Francisco metro area, for instance, the number of Black households declined by about 10,000 from 2013 to 2018 (to roughly 131,000). Jumps in Bay Area income and employment for Black adults may reflect that decline, if rising costs of living have pushed out some lower-income Black households to other regions. In Sunbelt metro areas, by contrast, in-migration of higher-earning Black households may have contributed to rising median incomes.
Notwithstanding these complex underlying patterns, from 2013 to 2018 most major metropolitan areas registered estimated increases in Black median household income that exceeded those for white households. In Phoenix, for instance, the typical Black household’s income rose 29% (from just under $40,000 to more than $51,000), compared to a 12% increase for the typical white household (from $63,000 to $71,000). Across the 20 metro areas with the largest Black populations (where sample sizes are larger), 15 registered a larger estimated rise in median Black income than median white income.[2]
Of course, as the Phoenix example illustrates, substantial gaps remain between Black and white median incomes in most major metro areas. In 2018, the typical white household in Sunbelt areas such as Phoenix, Riverside, and Tampa had an income 20% to 40% higher than the typical Black household. In Northern metro areas including Milwaukee, Minneapolis, and Cleveland, that median income gap was much higher: between 120% and 140%. Chicago, Philadelphia, and Pittsburgh registered high Black-white disparities as well. Many of these metro areas exhibit extremely high rates of racial and economic segregation, which limits upward mobility for low-income families, in part by reinforcing racist structures that devalue Black neighborhoods.
Recent progress, fortunately, suggests that these patterns are not immutable. Policies that support a tight labor market, improved access for Black workers to higher-paying sectors and occupations, and greater affordability in high-cost areas can ensure that major metropolitan economies support continued income gains for Black households in the years ahead.
[1] The only negative change of those 50 metro areas was Baton Rouge, La., where Black median household income dropped an estimated 2%, but that change was not statistically significant.
[2] The rise in Black median household income was statistically significant in 10 of those metro areas.
The Brookings Institution is committed to quality, independence, and impact.
We are supported by a diverse array of funders. In line with our values and policies, each Brookings publication represents the sole views of its author(s).


Commentary
Black household income is rising across the United States
October 3, 2019