The U.S. Census Bureau recently released its annual report on income and poverty in the United States. It provided a lot of good news at the national level: from 2015 to 2016, median household income rose, and the poverty rate fell, finally returning to their levels from before the Great Recession.
New census data released today, September 14, from its American Community Survey (ACS), indicate these gains were largely shared across most U.S. communities. Yet the data on poverty trends in cities and metropolitan areas clearly show that some places are doing better, and making more progress, than others. Three charts highlight not only the gains made on poverty but also continuing—and in a few cases, widening—disparities.
Poverty fell in big and small areas, but is still lower in larger places
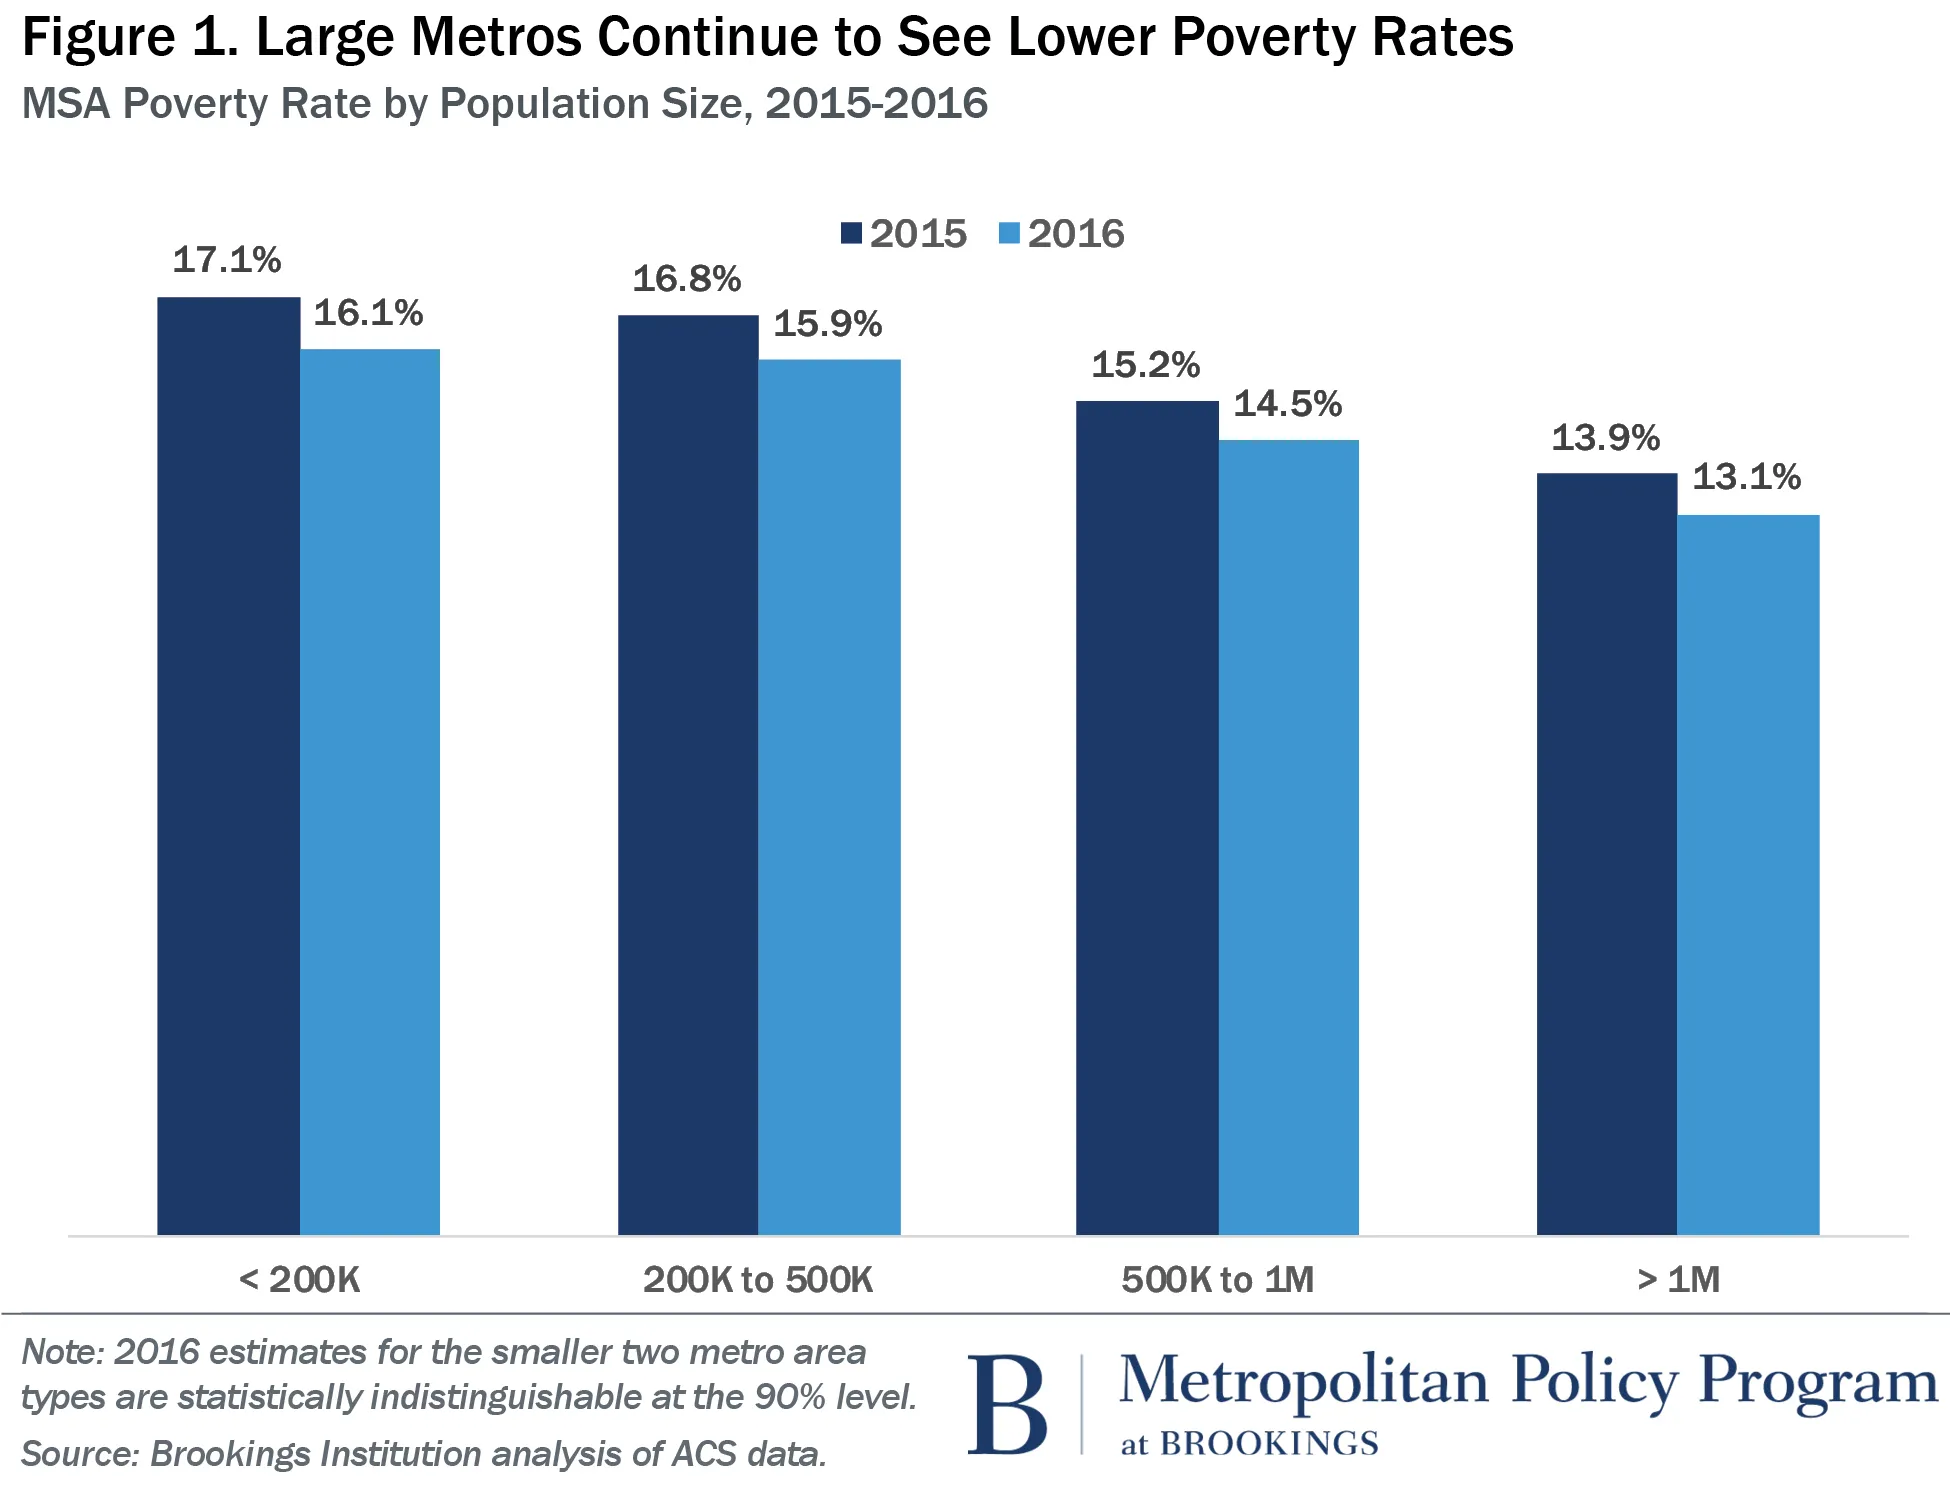
The ACS reported that in 2016, 14.0 percent of the U.S. population lived below the poverty line, down from 14.7 percent in 2015. That rate varied, however, across the nation’s 381 metropolitan areas, the combined urban and suburban areas that represent our regional economies and which house more than four in five Americans.
Figure 1 shows that size is a key dimension that differentiates poverty trends in these metro areas. In 2016, the combined poverty rate in very large metro areas (with more than 1 million residents) was 13.1 percent, below the U.S. average. In small metro areas (with fewer than 200,000 residents), the rate far exceeded the U.S. average, at 17.1 percent. Metro areas with between 200,000 and 1 million people exhibited poverty rates between those extremes. Yet metro areas in each size category posted reductions in their poverty rates from 2015 to 2016, of one-half to one percentage point.
In large metro areas, poverty dropped more in cities than suburbs
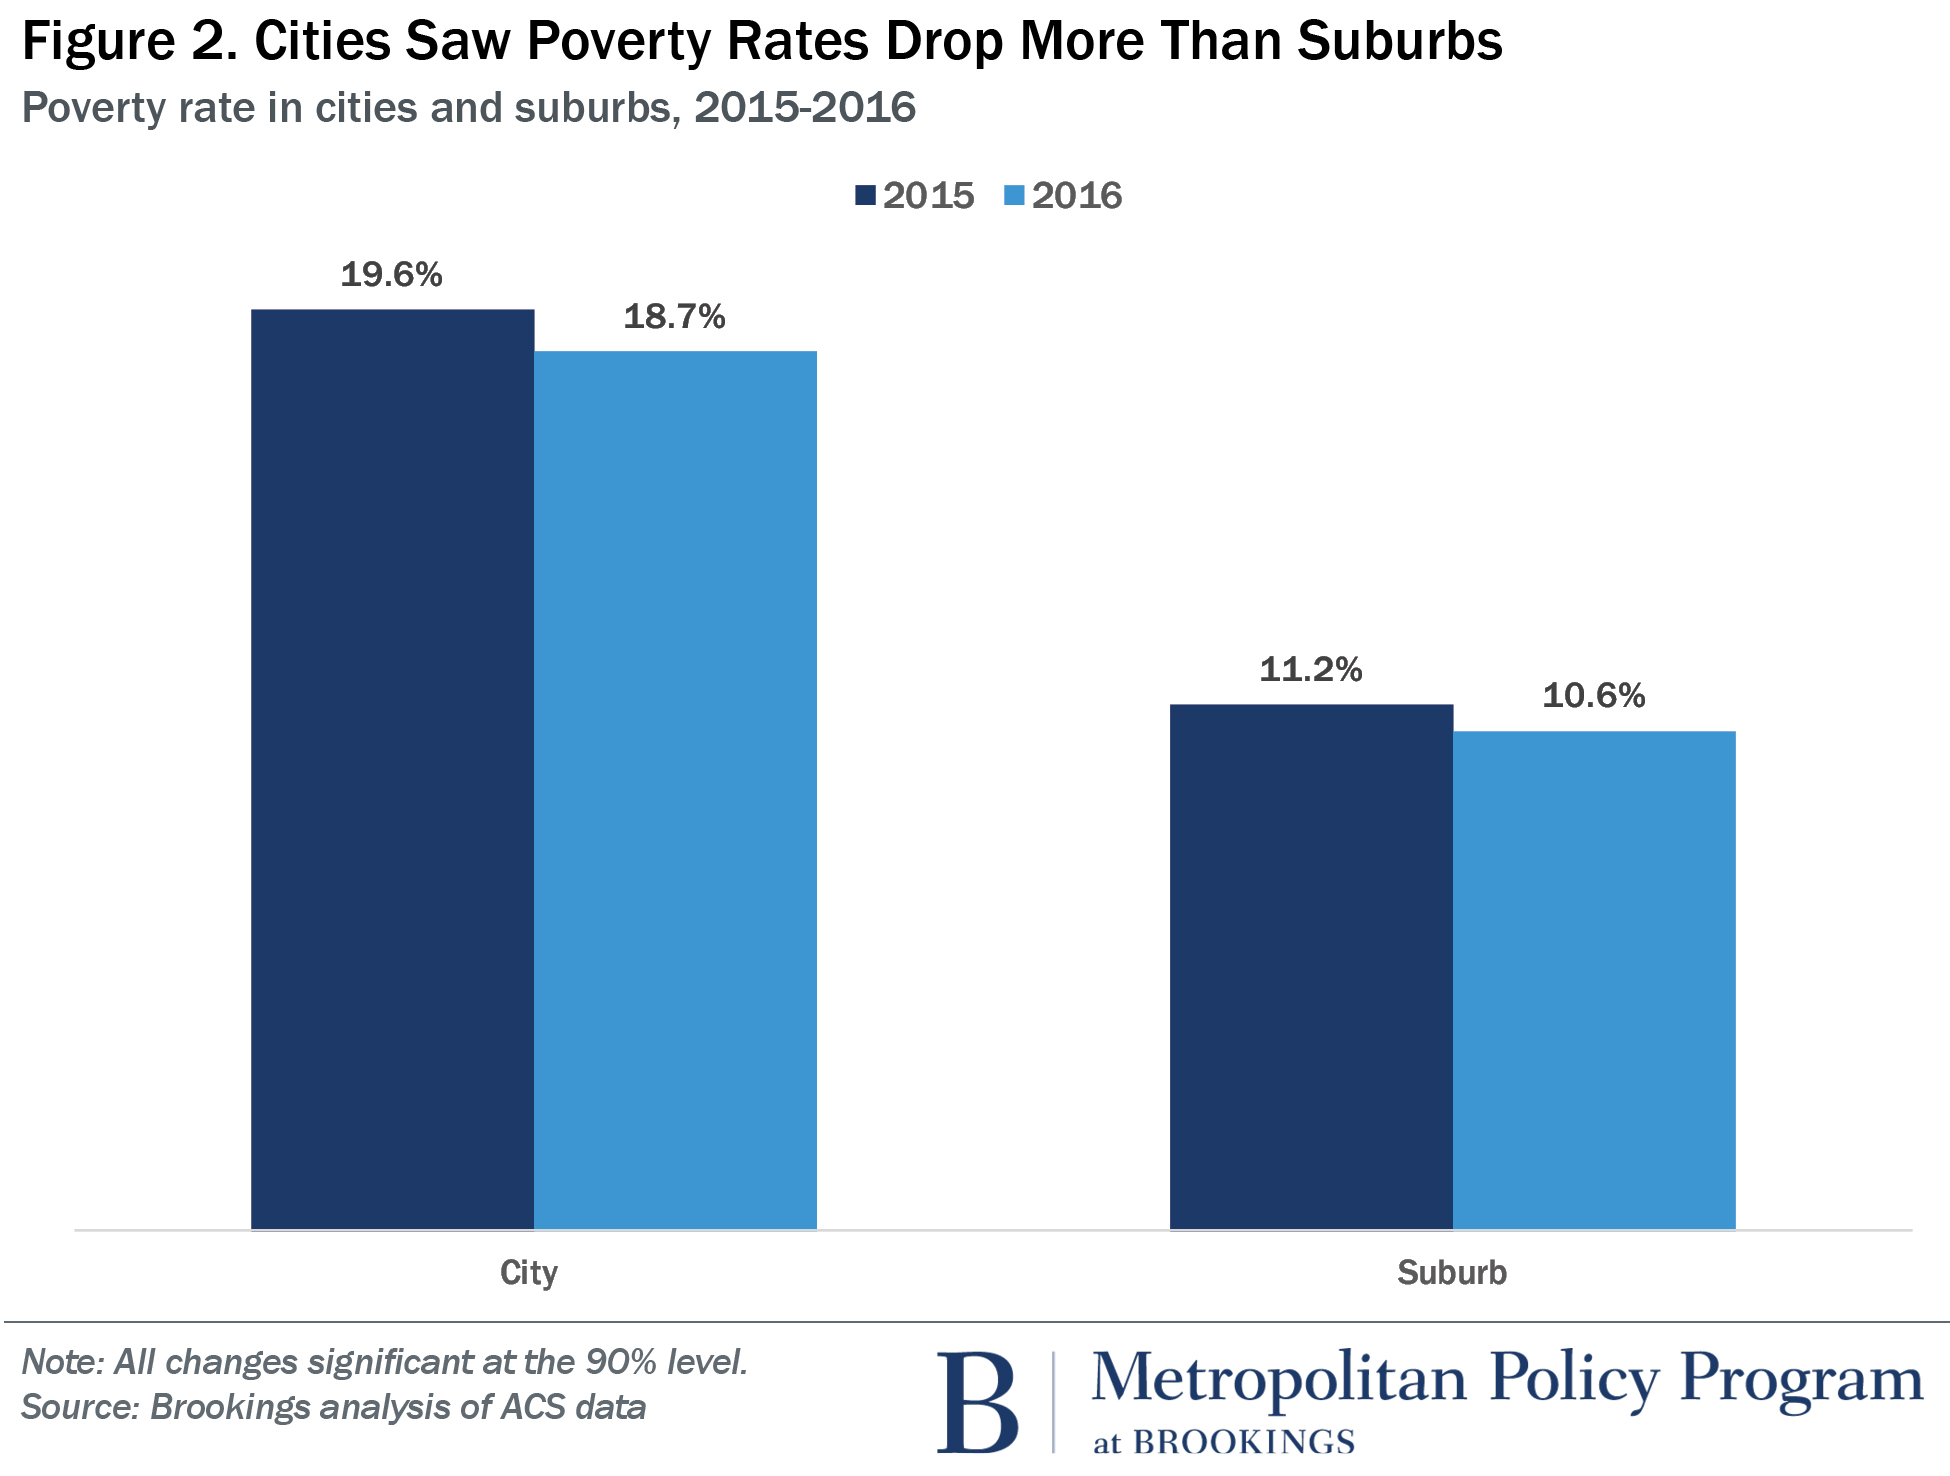
For some time, Brookings has tracked the rise of poverty in America’s suburban communities. More than 10 years ago, the number of people below the poverty line living in suburban areas surpassed the number of those living in big cities within the nation’s 100 largest metropolitan areas. That remained true in 2016, when 15.3 million residents of large metropolitan suburbs lived in poverty, compared to 12.2 million residents of their central cities. (We define central cities as those appearing first in the name of the metropolitan area, plus any others in the name with at least 100,000 residents.)
The trend from 2015 to 2016 suggested that cities made somewhat stronger gains against poverty than suburbs. The share of central city residents below the poverty line fell by nearly a full percentage point, compared to only a little more than half a percentage point for suburban residents. Notwithstanding cities’ greater progress, Figure 2 shows that the overall poverty rate in cities remains far higher than that in suburban communities—by about eight percentage points. Stated another way, the odds that a given city resident lives in poverty remain about 75 percent higher than the same odds for a suburban resident.
More cities than suburbs registered significant poverty drops, but a few registered increases
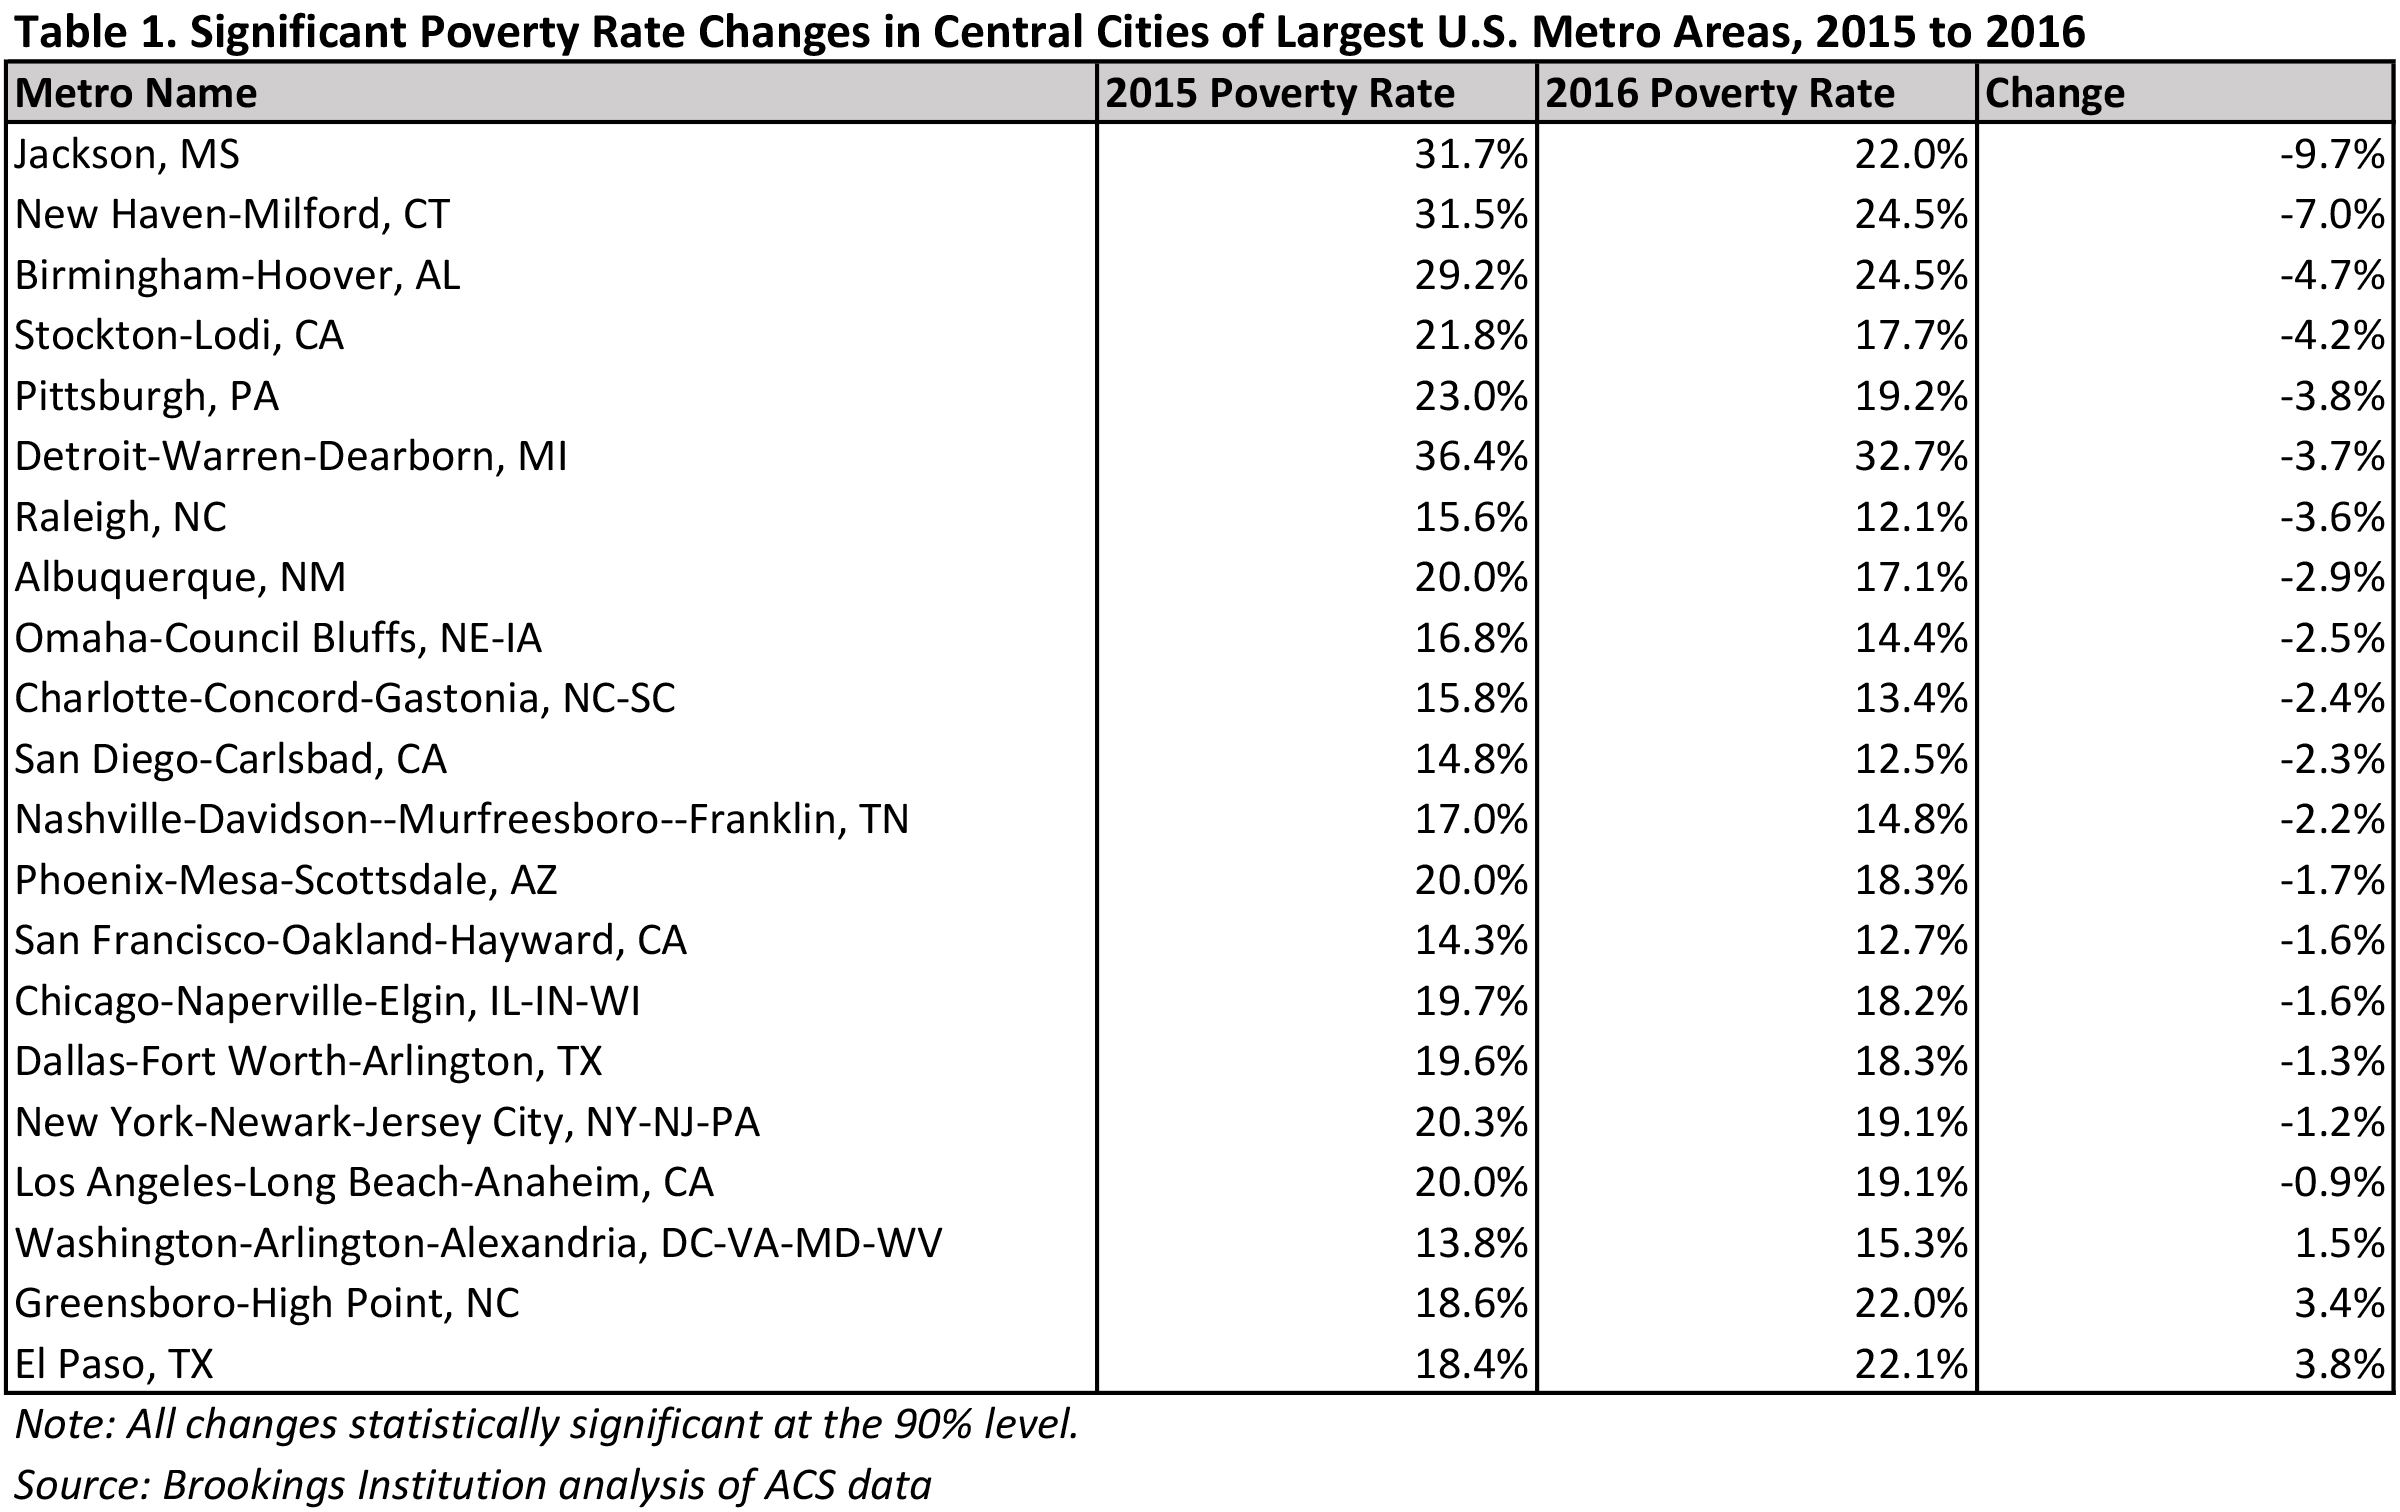
The stronger momentum against poverty evident in the overall city trend appears in the data for individual regions as well. From 2015 to 2016, 17 central cities within the 97 largest metro areas (data were not available for three) posted a statistically significant decline in their poverty rates of at least one percentage-point. The same was true for only eight suburban areas.
Many of the cities that achieved the largest declines in poverty rates have historically exhibited very high shares of their population in poverty, such as Jackson, New Haven, and Birmingham. Others are Sun Belt cities experiencing strong economic growth and falling unemployment, such as Raleigh, Charlotte, San Diego, and Phoenix. That growth is evident, too, in the Rust Belt cities of Pittsburgh and Detroit, each of which registered significant drops in poverty. In fact, Pittsburgh was the only metro area to record significant poverty declines in both its city and suburban areas.
Slightly worrisome was the fact that amid broad progress against poverty in 2016, the central cities of three large metro areas—Washington, D.C. (which also includes the Virginia cities of Arlington and Alexandria), Greensboro, and El Paso—saw the share of their residents in poverty increase by a significant degree.
In the end, today’s numbers provide mostly good news about continued economic recovery in America’s regions and cities, and signs that a strengthening labor market can generate improved outcomes for low-income people. But they also remind us to look behind the national trends to understand how and why local progress against poverty is—or isn’t—happening today.
Related Content


Authors


The Brookings Institution is committed to quality, independence, and impact.
We are supported by a diverse array of funders. In line with our values and policies, each Brookings publication represents the sole views of its author(s).


Commentary
Three charts showing you poverty in U.S. cities and metro areas
September 14, 2017