Two years into the Deferred Action for Childhood Arrivals Program (DACA) and more than 600,000 applications later, U.S. Citizenship and Immigration Services (USCIS) has released statistics on the sub-national geography and characteristics of the applicants for 75 metro areas containing 82 percent of requests. Although these characteristics only relate to those who applied during the 13-month period from August 2012 to September 2013, they provide the first look at the metropolitan areas where high numbers of requestors live.
While it has been clear that California has the most applicants, we now know that 17 metropolitan areas— from Los Angeles to Vallejo—account for 95 percent of the state’s applicants and approximately 27 percent of applications nationwide. Three California metros (Los Angeles, Riverside, and San Francisco) rank among the top 10 metros nationally, and two more rank in the top 15 (San Diego and San Jose).
The top metro areas for DACA requests are large metro areas with large immigrant populations, but not all large metros contain proportional DACA applicants. Boston, for example, is the 10th largest immigrant metro, but ranks 21st for its number of DACA applicants. Likewise, Miami, whose immigrant population trails only New York’s and Los Angeles’s, ranks eleventh on DACA applications. Conversely, Phoenix and Atlanta rank higher for their number of DACA applicants (seventh andeighth, respectively) than their overall foreign-born population rank (14th and 12th, respectively).
The extent to which a state’s DACA applicants are concentrated in its major metro areas varies across the country. About 95 percent of Illinois’ applicants are in Chicago; 86 percent of Arizona’s applicants are in Phoenix; 70 percent of Georgia’s applicants are in Atlanta. In Florida, only 46 percent of DACA applicants live in Miami, and in Texas 65 percent of applicants come from the Dallas and Houston metropolitan areas collectively.
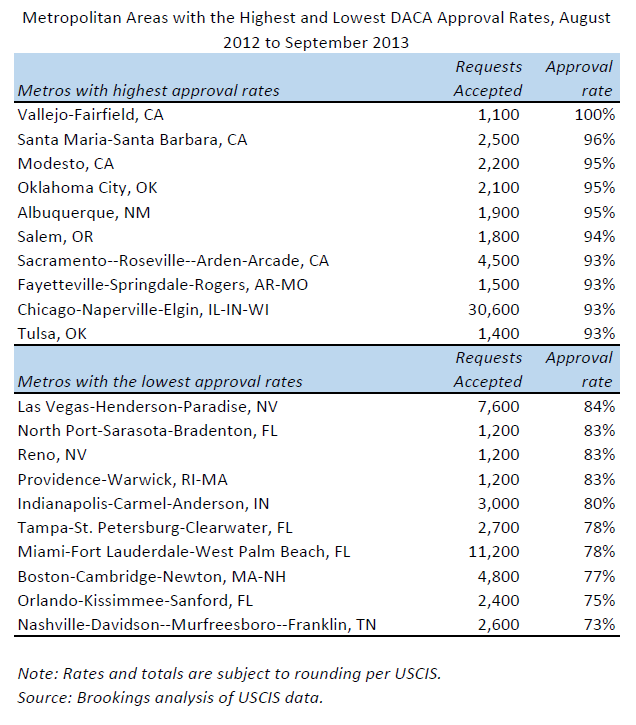
The USCIS release includes the number of DACA approvals for 71 of the 75 metros. We estimated the approval rates for these places. They vary widely: from 73 percent in Nashville to 100 percent in Vallejo (subject to USCIS rounding). Four metro areas in Florida rank among the 10 with the lowest approval rates. Lower approval rates do not necessarily mean higher denial rates. Rather, Orlando, Boston, and other low-ranking metros may have a high number of applications still being processed. But it could also be that these places—especially those that are newer immigrant destinations—do not have a robust immigrant service infrastructure in place to assist eligible young adults with their applications.
See downloadable table for metropolitan applications and approval rates in sidebar above.
Metro areas in California, a state well known for its network of immigrant services, all have approval rates at or above 90 percent. Other metros with high approval rates and large numbers of applicants are Chicago, Phoenix, and Seattle. Smaller metro areas in the West such as Modesto; Salem, OR; and Santa Barbara also rank among those with the highest rates of DACA approval.
These data are a welcome glimpse into who is benefiting from DACA and where they live. As the first wave of applicants approach their renewal dates, these data provide valuable information for service providers, municipal governments, and researchers.
The Brookings Institution is committed to quality, independence, and impact.
We are supported by a diverse array of funders. In line with our values and policies, each Brookings publication represents the sole views of its author(s).


Commentary
A Metropolitan Glimpse at DACA Applicants
July 17, 2014