On February 11, the Center for Technology Innovation hosted an event at the Brookings Institution titled “Smart cities and artificial intelligence”. Watch video from the event here.
Fifty-one percent of Americans prefer to access public services through digital technologies or mobile apps, according to a national survey undertaken by researchers at the Brookings Institution. Only 13 percent say they prefer accessing services through phone calls, 9 percent favor personally going to government offices, and 27 percent don’t know.
The survey was an online U.S. national poll undertaken with 2,081 adult internet users between February 5 and 7, 2019. It was overseen by Darrell M. West, vice president of Governance Studies and director of the Center for Technology Innovation at the Brookings Institution and the author of The Future of Work: Robots, AI, and Automation. Responses were weighted using gender, age, and region to match the demographics of the national internet population as estimated by the U.S. Census Bureau’s Current Population Survey.
Views of Digital Service Delivery
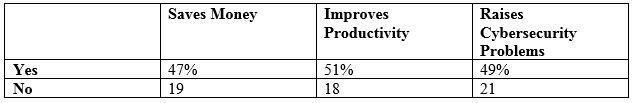
We asked whether relying upon digital technologies saves cities money, improves productivity, or exposes people to cybersecurity problems. Forty-seven percent say it saves money, 51 percent believe it improves productivity, and 49 percent feel it raises cybersecurity problems.
Use of Mobile Apps
With the ubiquity of smartphones, some government agencies have developed mobile apps for public service delivery. We asked people whether they have used a mobile app in the last year to access public services. Thirty-six percent say they have, 43 percent indicate they have not, and 21 percent do not know whether they have done so.
When asked to rate the quality of mobile apps, 27 percent say they are positive, 26 percent are negative, and 47 percent do not know.
We asked people the kind of mobile app for public services they would value, and 31 percent say an app for parking and transportation issues, 25 percent for public safety, 9 percent for tax services, 4 percent for water and air quality, and 31 percent are unsure.
Encourage Cities to Invest
Almost half say they would encourage cities to invest financial resources in technologies designed to provide access to public services. When asked about mobile app investments, 45 percent would encourage cities to do this, 21 would discourage cities, and 34 percent are unsure. In regard to digital technologies in general, 43 percent would encourage cities to invest, 21 percent would discourage them, and 36 percent are unsure.
How Much Does Digital Technology Help?
To get a sense of whether people believe digital technologies would help residents deal with urban issues such as parking and transportation, we asked for their overall views. Twenty percent say digital technologies help residents a lot, 33 percent believe they help some, 16 percent feel technologies do not help very much, and 31 percent are unsure.
Survey Questions and Answers
1. Some cities use digital technologies to help residents deal with urban issues such as parking or transportation. How much do you think technologies help with these issues?
- 16% not very much
- 33% some
- 20% a lot
- 31% don’t know or no answer
2. Would you encourage cities to invest financial resources in digital technologies that allow people to access public services?
- 12% strongly discourage
- 9% discourage
- 24% encourage
- 19% strongly encourage
- 36% don’t know or no answer
3. Would you encourage cities to invest financial resources in mobile apps that allow people to access public services?
- 11% strongly discourage
- 10% discourage
- 26% encourage
- 19% strongly encourage
- 34% don’t know or no answer
4. Do you prefer to access public services through digital technologies/mobile apps, calling government offices, or personally going to government offices?
- 51% digital/mobile
- 13% calling government offices
- 9% personally going to government offices
- 27% don’t know or no answer
5. In the last year, have you used any mobile app that allowed you to access public services?
- 43% no
- 36% yes
- 21% don’t know or no answer
6. Overall, how would you rate the quality of these mobile apps?
- 14% very negative
- 12% somewhat negative
- 18% somewhat positive
- 9% very positive
- 47% don’t know or no answer
7. In what area would you most value having a mobile app for public services?
- 25% public safety
- 31% parking and transportation
- 9% tax services
- 4% water and air quality
- 31% don’t know or no answer
8. Do you think relying upon digital technologies for service delivery saves cities money?
- 19% no
- 47% yes
- 34% don’t know or no answer
9. Do you think relying upon digital technologies for service delivery improves productivity?
- 18% no
- 51% yes
- 31% don’t know or no answer
10. Do you think relying upon digital technologies for service delivery exposes people to cybersecurity problems?
- 21% no
- 49% yes
- 30% don’t know or no answer
Gender:
- 51.7% male, 48.3% female in sample
- 47.9% male, 52.1% female in target population
Age:
- 8.4% 18-24, 16.2% 25-34, 15.9% 35-44, 20.5% 45-54, 21.8% 55-64, 17.2% 65+ in sample
- 13.9% 18-24, 19.4% 25-34, 17.8% 35-44, 18.3% 45-54, 16.4% 55-64, 14.2% 65+ in target population
Region:
- 14.6% Northeast, 28.3% Midwest, 36.7% South, 20.4% West in sample
- 18.0% Northeast, 22.0% Midwest, 36.4% South, 23.6% West in target population
Survey Methodology
This online survey polled 2,081 adult internet users in the United States February 5 and 7, 2019 through the Google Surveys platform. Responses were weighted using gender, age, and region to match the demographics of the national internet population as estimated by the U.S. Census Bureau’s Current Population Survey.
In the 2012 presidential election, Google Surveys was the second most accurate poll of national surveys as judged by polling expert Nate Silver. In addition, the Pew Research Center undertook a detailed assessment of Google Surveys and found them generally to be representative of the demographic profile of national internet users. In comparing Google Survey results to its own telephone polls on 43 different substantive issues, Pew researchers found a median difference of about three percentage points between Google online surveys and Pew telephone polls. A 2016 analysis of Google Surveys published in the peer-reviewed methodology journal Political Analysis by political scientists at Rice University replicated a number of research results and concluded “GCS [Google Consumer Surveys] is likely to be a useful platform for survey experimentalists.”
This research was made possible by Google Surveys, which donated use of its online survey platform. The questions and findings are solely those of the researchers and not influenced by any donation. For more detailed information on the methodology, see the Google Surveys Whitepaper.
Related Books


Related Content


Author

The Brookings Institution is committed to quality, independence, and impact.
We are supported by a diverse array of funders. In line with our values and policies, each Brookings publication represents the sole views of its author(s).


Commentary
Brookings survey finds 51 percent prefer digital access to government services over phone calls or personal visits to agency offices
February 13, 2019