The United States continues to confront a weak economic recovery. According to today’s employment report by the Bureau of Labor Statistics, payroll employment stalled last month, and the unemployment rate remained elevated at 9.1 percent. The private sector added 17,000 jobs while governments shed the same about—resulting in zero job growth. The most recent estimate of second quarter GDP was revised down from 1.3 percent to 1.0 percent following on a first quarter increase of only 0.4 percent.
As policymakers focus their attention on strategies to create new jobs, The Hamilton Project continues to examine the magnitude of the current employment situation through our analysis of the nation’s “job gap.” This month we also explore the job gap by state and highlight a number of states that have been particularly hard hit by the Great Recession.
The August “Job Gap”
As in previous months’ postings, The Hamilton Project updates America’s job gap, the number of jobs that the U.S. economy needs to create in order to return to pre-recession employment levels while absorbing the 125,000 people who enter the labor force each month.
The August “job gap” is estimated at 12.4 million jobs, up 180,000 jobs from July.
The chart below shows how the job gap has evolved since the start of the Great Recession in December 2007, and how long it will take to close under different assumptions for job growth. The solid line shows the net number of jobs lost since the Great Recession began. The broken lines track how long it will take to close the job gap under alternative assumptions about the rate of job creation going forward.
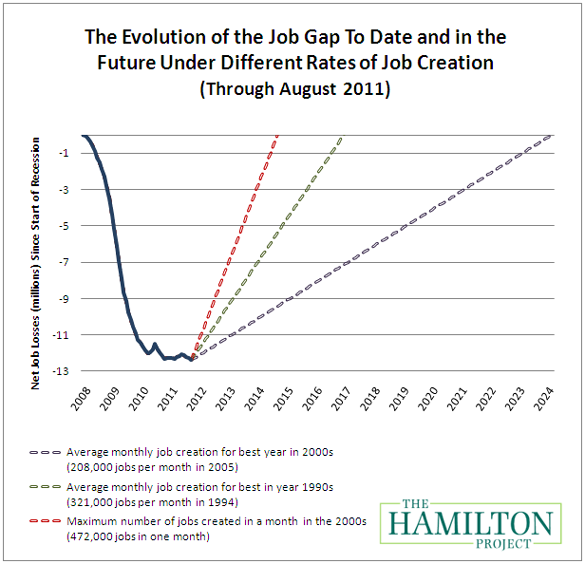
If the economy adds about 208,000 jobs per month, which was the average monthly rate for the best year of job creation in the 2000s, then it will take until February 2024—almost 12 and a half years—to close the job gap. Given a more optimistic rate of 321,000 jobs per month, which was the average monthly rate for the best year of job creation in the 1990s, the economy will reach pre-recession employment levels by December 2016—over five years.
Job Gap by State
Using the pre-recession employment rate in each state as a benchmark, we assess the state job gap, or how many new jobs each state needs to generate to get back to normal. The Hamilton Project last explored state job gaps in July 2010. Revisiting these numbers, we find that many of the same states highlighted last year are still struggling to recover today.
|
Job Gaps by State |
||||
|
As of July 2011 |
As of May 2010 |
|||
|
Rank |
State |
Job Gap |
Previous Rank |
Previous Job Gap |
|
1 |
California |
1,921,262 |
1 |
1,514,625 |
|
2 |
Florida |
769,052 |
2 |
699,719 |
|
3 |
Georgia |
581,787 |
3 |
513,096 |
|
4 |
New York |
577,154 |
6 |
411,393 |
|
5 |
Illinois |
528,844 |
4 |
487,069 |
|
6 |
Texas |
507,511 |
10 |
294,583 |
|
7 |
North Carolina |
487,685 |
7 |
398,936 |
|
8 |
Michigan |
476,709 |
5 |
439,313 |
|
9 |
Pennsylvania |
380,024 |
11 |
290,556 |
|
10 |
Ohio |
357,541 |
8 |
346,516 |
Almost every state on this list has experienced significant job loss from either the construction or manufacturing industries. Georgia and Florida appear again because of job losses in the housing industry that have not been restored. The increase in California’s job gap is driven partly by population growth, but California has also an additional 100,000 government jobs. Texas has continued to experience high population growth, which contributed to a worsening job gap, despite modest employment growth. At the other end of the spectrum, New England and the “farm belt,” with relatively less manufacturing and less housing-related turmoil, have fared better.
Change in Employment Rates by State
Job losses resulting from the Great Recession have not been spread equally around the country. The map below shows the severity of the decline in the employment-to-population ratio by state since the recession began in 2007. This ratio measures the fraction of the working-age population that is either unemployed or out of the labor force and provides the broadest measure of the health of the labor market. The employment to population ratio includes the people who have left the labor force and thus provides a more complete picture of the labor market than unemployment rates. States that are shaded darker red have been hit the hardest by job losses.
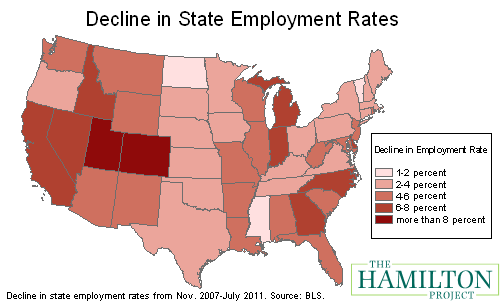
Every state remains short on jobs, but certain areas are particularly hard hit. Industry declines in states such as Michigan, Indiana, and North Carolina have driven worsening employment situations. States like California, Nevada, Colorado, Utah and Florida suffered significant declines in construction employment during the housing crisis, and those jobs losses still remain. Even in better performing states where job growth was positive since the start of the recession, overall employment rates have declined because the pace of job creation has lagged behind the increase in population.
Conclusion
As President Obama prepares to deliver a major address on strategies to create jobs, it is important to focus on both the national impacts of the Great Recession as well as the state-by-state and regional impacts. As noted above, job losses have not been distributed equally around the country and, in the same vein, there is no “one-size-fits-all” prescription for recovery. Last fall, The Hamilton Project hosted a forum and released policy proposals focusing on ways to help America’s hardest-hit communities. Next month, the Project will release new proposals on ways to enhance training for the nation’s disadvantaged and dislocated communities to help ensure that we are preparing some of our most vulnerable populations to step into the jobs of the future.


Commentary
Taking the Job Gap to the State Level: A Closer Look at the August Employment Numbers
September 2, 2011