Thanks to debt relief under two programs, the Heavily Indebted Poor Countries Initiative and Multilateral Debt Relief Initiative, debt in sub-Saharan Africa was cut by two-thirds by 2008. The relief has given the region a new lease on life.
But since 2008, public debt in sub-Saharan countries has been rising at a increasingly rapid pace. By 2016, the subcontinent’s gross public debt to GDP ratio had doubled (Figure 1). The increase in debt should have raised all sorts of flags and triggered triage, but it didn’t. Neither the International Monetary Fund nor the World Bank sounded the alarm.
By 2017, some economies—Chad, Mozambique, South Sudan, Sudan, and Zimbabwe—had run into serious trouble, and the multilateral organizations finally woke up and paid the problem some attention. Last year, the debt to GDP ratio breached the 50 percent mark, and the multilaterals gently warned economies such as Ethiopia, Cameroon, Ghana, Kenya, Mauritania, and Zambia that they needed to rein in public spending. But we believe that until one of Africa’s big five economies—Nigeria, South Africa, Angola, Ethiopia, and Kenya—becomes debt distressed, the alarm bells won’t be truly be rung.
Figure 1: Primary deficits and public debt in sub-Saharan Africa have grown since 2009
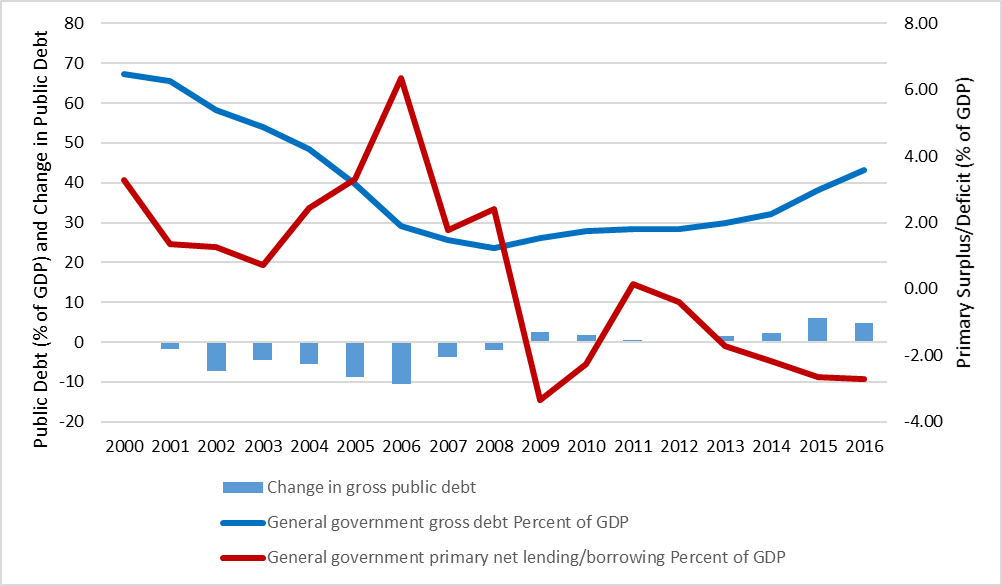
Source: Authors’ calculation, based on data from the IMF’s World Economic Outlook.
3 measures of public debt
Sadly, that time will soon be here. In a forthcoming paper, we take a close look at public (domestic and external) debt in Africa. Here, we provide a nontechnical preview.
After surveying the literature, consulting debt specialists, and crunching some numbers, we’ve come up with three simple measures that anyone can track, using elementary arithmetic and publicly available data:
- Debt measure 1: The first is a static measure of the government’s indebtedness, the ratio of gross public debt to the gross domestic product. Since debt has to be repaid using what is produced and sold, this measure makes sense. But what is harder to determine is what range of this ratio is manageable. That would depend on the terms of the debt and the ability of the government to service it. For most developing economies, anything above 40 percent should be considered risky.
- Debt measure 2: The second is a dynamic measure of how quickly the ratio of public debt to GDP is changing. Obviously, this can change because of what’s happening to either the numerator or the denominator. But it is fair to assume that if this ratio is going up quickly, it should be a matter of concern.
- Debt measure 3: The third is a measure of the sustainability of the debt, that is, the difference between the rate of interest and the rate of economic growth. Another way to interpret this is to vision it as a dynamic measure of the economy’s ability to repay relative to the interest that is being accumulated on the debt. This can also be seen as a (terribly oversimplified) measure of how well the borrowed money is being used by the government.
We chose these three indicators because they are easy to understand, calculate, and explain. But each has drawbacks, and readers are advised not to make important decisions based on our analysis. Be warned, also, that the publicly available data can be unreliable because they presume honest and complete reporting by governments. And they often have to be cobbled together from several sources that use different definitions of debt and the terms (interest rates) at which it is contracted.
One more thing: We rank the countries using three combinations of these measures. The first is a ranking using only measure 1; the second is an equally weighted average of measures 1 and 2; and the third is an equally weighted average of measures 1, 2, and 3. Figure 3 at the bottom reports the results, using the latest publicly available information.
What the numbers tell us
What we found made us sit up and pay attention. Take a look at the three rankings in Figure 3.
- When we looked just at the average public debt levels (the numbers are for 2017 and 2016, depending on the latest available), the picture does not look too bleak. Several countries are clearly in trouble, but they are all small economies: Cape Verde, Gambia, Congo, Mozambique, and Mauritania have debt to GDP ratios near or above 100 percent, but keep in mind that their collective GDP is less than $30 billion. Even with next five countries in the ranking (the top 10) , the total is still less than $100 billion. But the total for the top 15 starts to look worrisome. The five additional countries—Sudan, Angola, Kenya, Gabon and Mauritius—have a collective GDP of more than $300 billion, and debt-to-GDP ratios above 60 percent. Keep in mind also that Angola and Kenya are two of the largest five economies in sub-Saharan Africa, estimated to be one-eighth of the region’s economic output.
- Adding a measure of debt dynamics—the percentage increase in debt to GDP ratios from 2010 to 2016—to the mix makes things look worse. This is not because of what’s happening in the top third of Figure 3; that remains roughly unchanged. It’s what is happening to the ranking of Nigeria, Africa’s largest economy. Having doubled its debt-to-GDP ratio, Nigeria moves up eleven slots. With more than a quadrupling of their debt to GDP ratios between 2010 and 2016, South Sudan and Equatorial Guinea, both resource-rich economies, move up from the bottom third to the middle or even the top. Chad, Gabon, Zambia, and other resource rich economies fare almost as badly.
- Adding a measure of the sustainability of debt (r-g) makes matters worse for the countries with adverse debt dynamics. In general, countries with bigger differences between real interest rates (r) and economic growth (g) have higher debt ratios. When this measure is added to the mix, Equatorial Guinea, Chad, South Sudan, Congo, and Gambia do especially badly. And the big three economies—Nigeria, South Africa, and Angola—are now all ranked in the middle third of the subcontinent’s countries; we would classify them as economies facing a moderate risk of debt distress.
Figure 2: For most countries in Africa the cost of borrowing exceeds the rate of growth
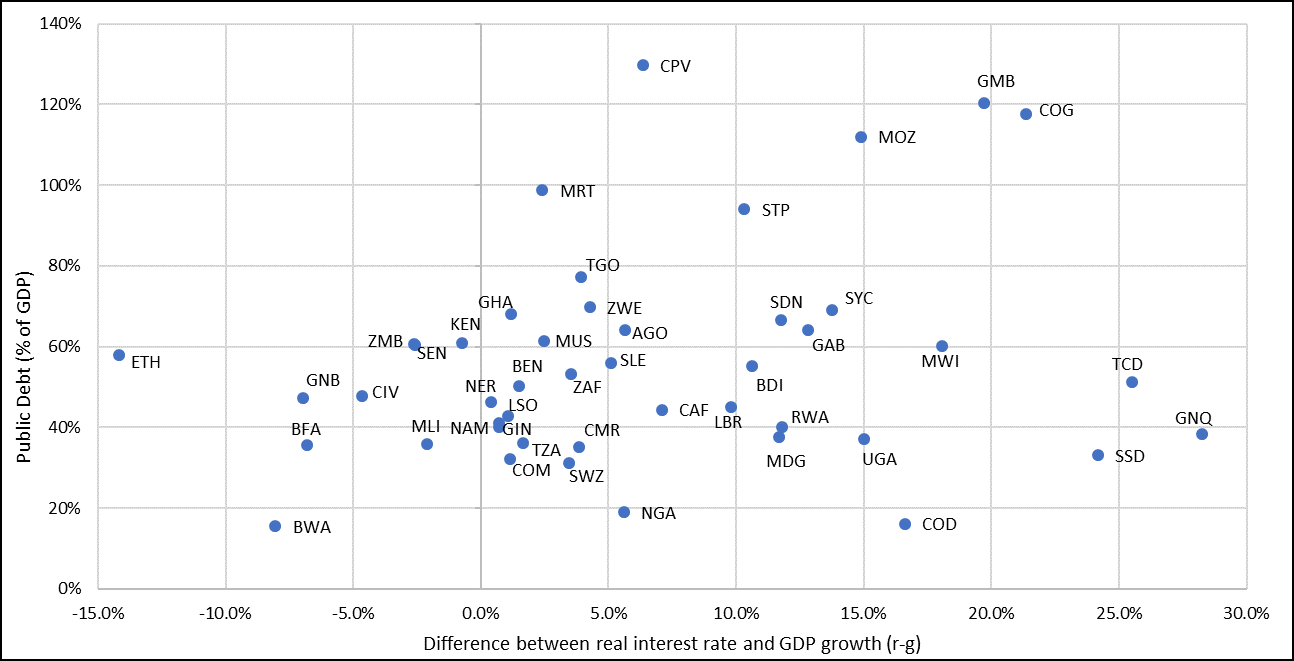
Source: Authors’ calculation based on data from the IMF’s World Economic Outlook and the World Bank World Development Indicators. Note: 2017 data for 10 countries, 2016 data for 34 countries, and 2015 data for two countries. Eritrea and Somalia are excluded since no data are available.
It is already time for triage
Debt dynamics have become adverse for much of Africa as a result of widening primary deficits, slowing growth, and rising interest rates. Since 2012, the subcontinent has not had primary surpluses, the only other way besides growth to reduce domestic public debt. The primary balance tracks the difference between the real interest rate and the real growth rate. Real interest rates are expected to remain higher than growth rates for a majority of African economies. In 2016, the subcontinent experienced negative per capita growth for the first time since 1999, and growth in 2017 was anemic. 2018 is not expected to be much better.
Africa is running out of time. Governments in the region have to make a big effort to generate growth and raise revenues. Increasing tax revenues is something that almost all of the subcontinent’s governments can do by themselves. For a continent of small economies, increasing growth rates will be harder without help from abroad. But there are some countries that can do this on their own. With more than half of the region’s economic output, Nigeria and South Africa control not just their own destinies but also those of their neighbors. If they don’t do well and soon, the prospects for Africa do not look good.
Figure 3: Debt levels and simple debt dynamics in sub-Saharan Africa
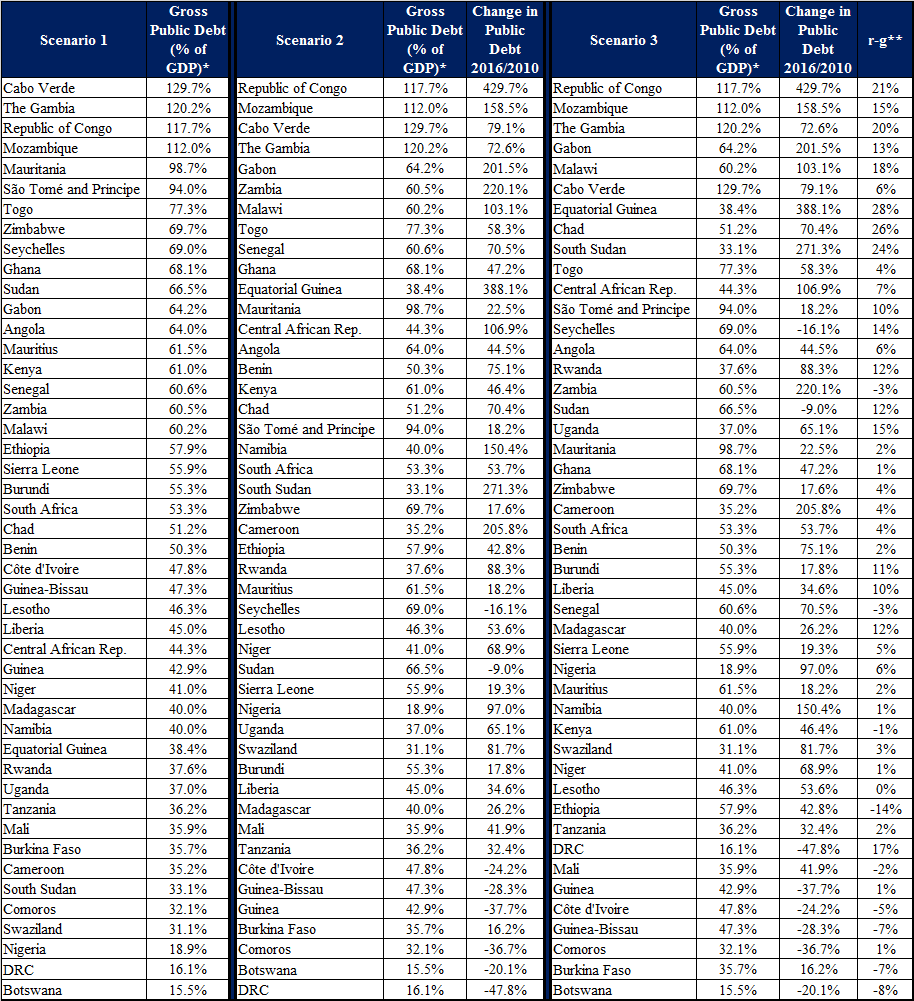
Source: Authors’ calculations, based on data from the IMF’s World Economic Outlook, the World Bank’s World Development Indicators, and various countries’ national statistics offices and central banks.
Related Content


Authors


The Brookings Institution is committed to quality, independence, and impact.
We are supported by a diverse array of funders. In line with our values and policies, each Brookings publication represents the sole views of its author(s).


Commentary
Sounding the alarm on Africa’s debt
April 6, 2018