For sports fans, few things are more frustrating than watching your team lose game after game. When this happens, conversations turn to who is to blame and how to fix the problem. Certainly, if you were the general manager, you could do a better job.
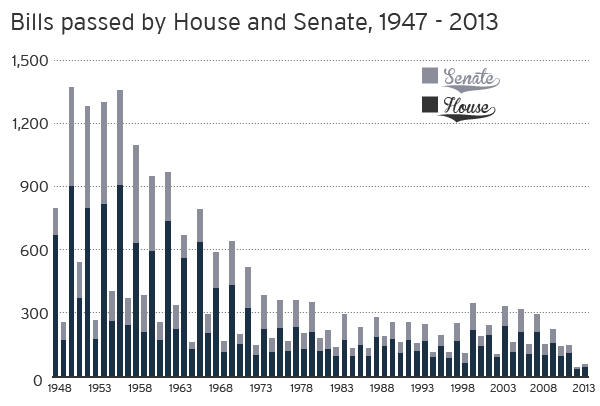
Political junkies face the same situation today. If the 113th Congress was a sports team, it would be on a record-breaking streak of futility. During the first session, the 113th Congress passed fewer public laws than any other Congress since at least 1947 (see Figure 1). And this is not for lack of trying: the number of bills introduced was on par with previous Congresses, with nearly 3,800 in the House and almost 1,900 in the Senate. Of the 5,700 bills introduced across both chambers, only 56 – less than 1% – became public laws.
If our goal was to end a baseball team’s losing streak, we would try to ensure that the players who contribute the most to scoring runs would get the lion’s share of playing time. That is, we would want to assess which individual members of the team were helping to resolve the problem, and which were exacerbating it. We can take the same approach to Congress.
Just as in baseball where hitters have to clear all four bases to score a run, so too must legislators get their bills through a procedural gauntlet in order to pass a public law. In baseball, we would look to the number of hits, home runs, and walks to predict the number of runs that a player is adding to his team’s score. In Congress, we look to a variety of landmarks in the legislative process to give us a sense of the productivity and efficiency of individual legislators. By developing a series of baseball-inspired statistics based on these legislative junctures, we offer a framework through which to evaluate the performance of legislators. We can tell who is carrying the team and who is dead weight at the end of the bench.
In the following weeks, we will introduce a series of new statistics measuring legislators’ performance during the first session of the 113th Congress. Based on these individual stats, we will calculate an overall “score” of productivity, and then use these scores to rank the effectiveness of legislators – and groups of legislators – in Congress.
The great thing about politics as opposed to sports is that we (the constituents) are, in fact, the general managers of our representatives. With the 2014 election around the corner, we can choose who to keep and who to throw out when cleaning house. With these metrics in hand, we can optimize the composition of Congress to ensure more runs (i.e., public laws) in the future. Let Congressional Moneyball begin.
The Brookings Institution is committed to quality, independence, and impact.
We are supported by a diverse array of funders. In line with our values and policies, each Brookings publication represents the sole views of its author(s).

Commentary
Congressional Moneyball: Measuring Legislative Effectiveness
January 14, 2014