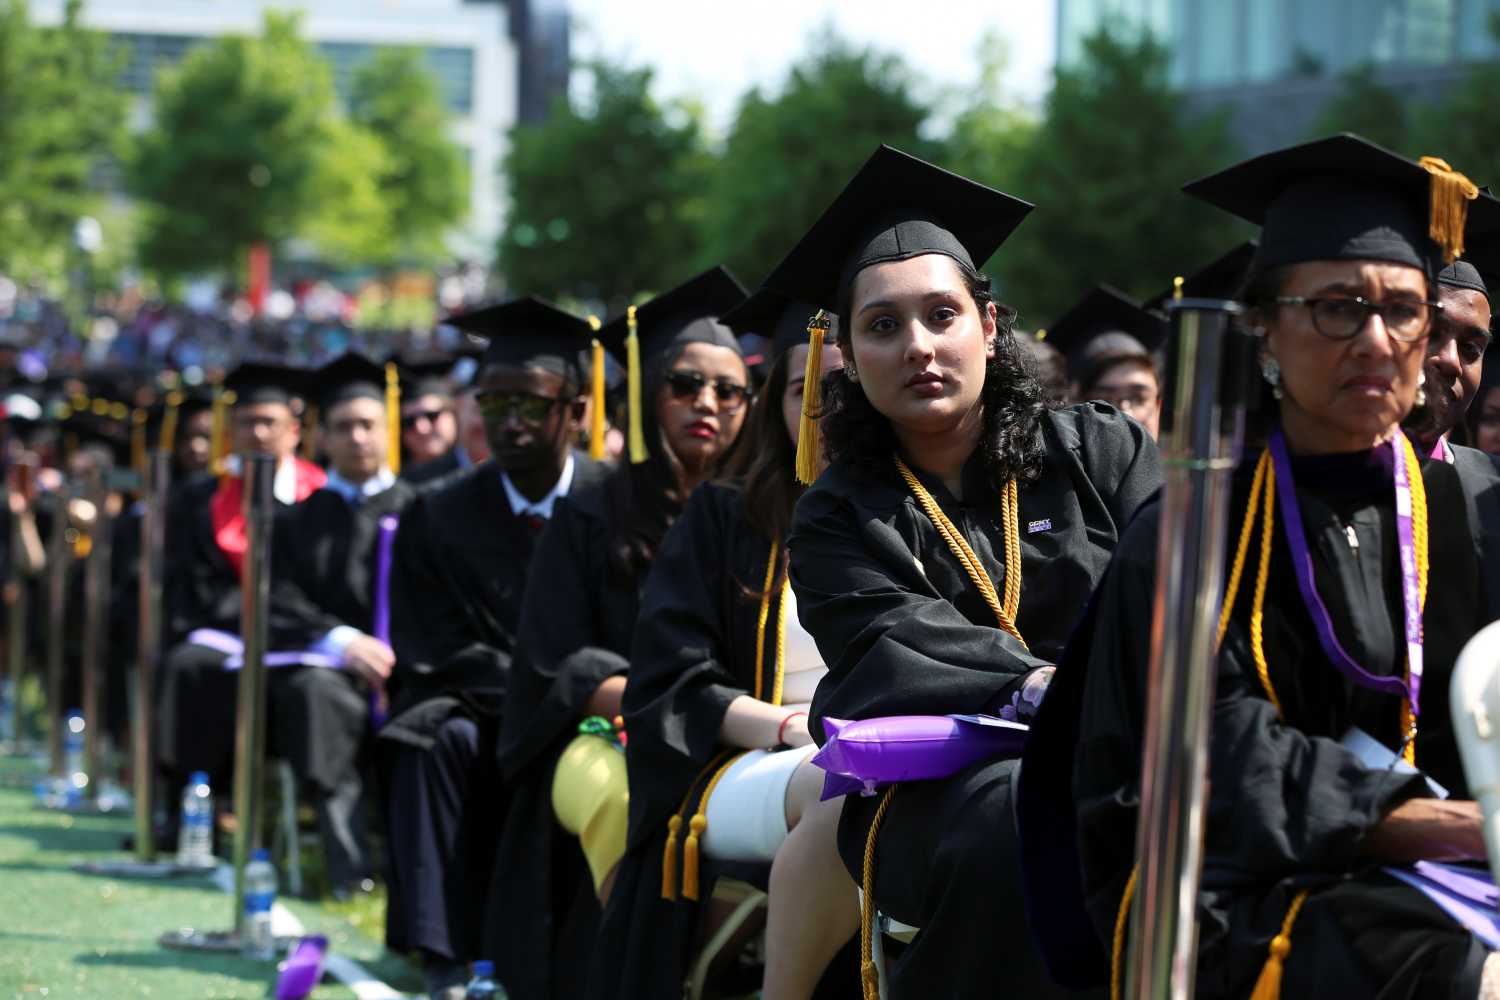
About 40% of UC-Santa Barbara students represent the first generation in their family to attend college—something my university is proud of. Often, first-generation students come from low-income backgrounds, but are they really all that different from other students who grew up in poverty but are not the first in their families to attend college? At the national level, how do first-gen students fare in college, and how are they supported?
In this post, I first provide some basic, data-based facts about these students. Unless otherwise mentioned, all our data comes from the Beginning Postsecondary Students Longitudinal Survey conducted by the National Center for Education Statistics. This survey has been conducted every eight years since 1990, and it collects information from beginning college students at the end of their first year, and then three and six years after starting college. For this post, I look only at students enrolled in four-year schools, and “first-gen” means neither parent has a four-year degree. I conclude with some discussion of evidence and reminders that “first-gen” and “low-income” are not synonymous labels for college students.
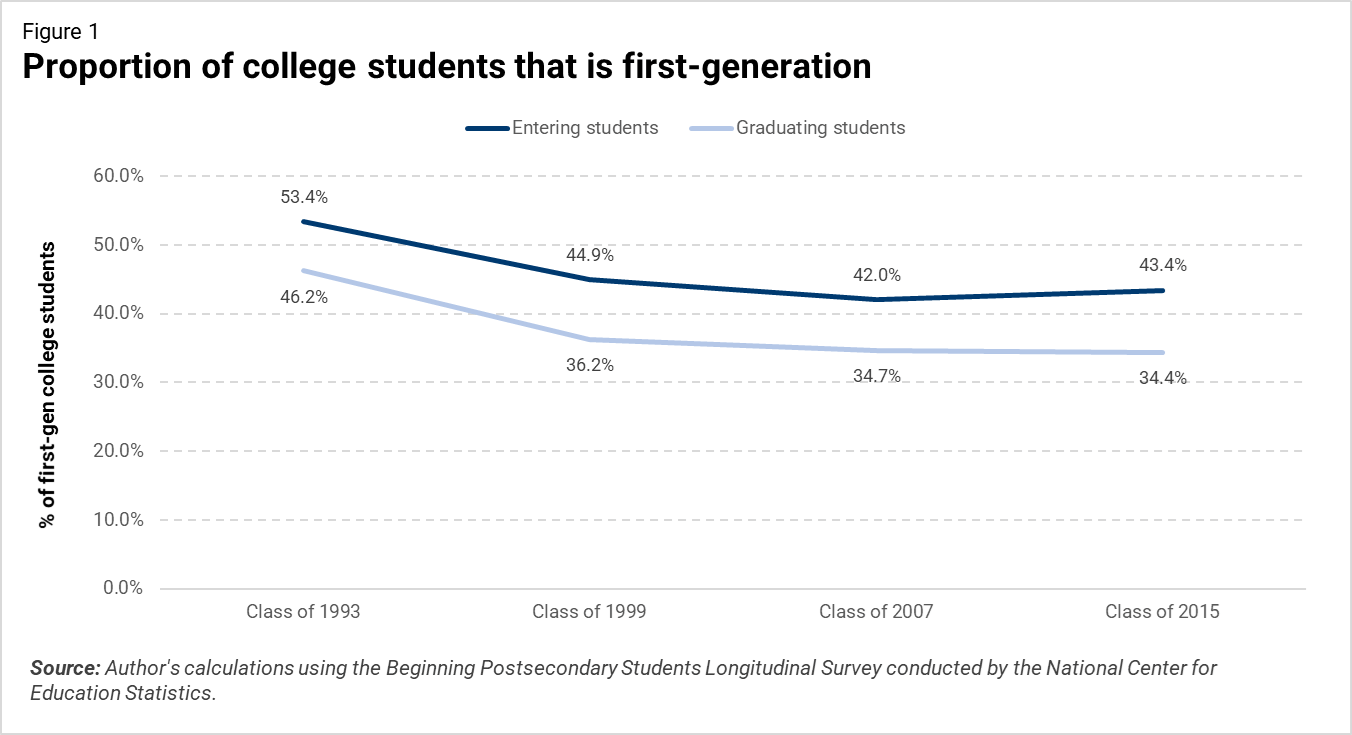
Fact 1: First-gen students are now a sizable, stable population among college enrollment.
The first fact is that neither college-entering rates nor college-graduating rates for first-gen students have changed much in recent years (see Figure 1 below). But note that they decreased drastically in the ‘90s—partially due to the increased bachelor’s attainment rate in the U.S. in the ‘60s and ‘70s—leading to more college-goers having at least one college-educated parent. Today, over 40% of entering students are first-gen, as are about one-third of graduating students. (In Figure 1, the label “Class of 2015” means students who would have graduated in 2015 if they spent four years earning their bachelor’s. As is standard, the calculation of graduation rates allows up to six years for graduation.)
Fact 2: First-gen students disproportionately enroll in less-selective colleges.
There is a very striking pattern when one looks at first-gen enrollment across college selectivity levels.
In open-admission schools, two-thirds of students are first-gen. Contrast this with “very selective” schools, where less than one-third of students are first-gen. (As an aside, the high proportion of first-gen students at my large, R1 university appears to be something of an anomaly.) The fact that very selective schools have lower fractions of first-gen students is likely not surprising as these schools are (a) more expensive and (b) require more savvy and resources on how to get admitted (i.e., guidance from parents). Unfortunately, as you will see next, outcomes for first-gen students are better precisely at those very selective schools where they are least likely to attend.
Fact 3: First-gen students complete college at lower rates than their peers.
Most first-gen students who attend a very or moderately selective school graduate, while the large majority of first-gen students who attend an open-admissions school do not. Of course, the more selective schools cherry-pick students likely to graduate, where open admission schools take all comers who meet basic qualifications. However, the same cherry-picking-or-not distinction is true for non-first-gen students. At very selective schools, family educational background is associated with a modest difference in graduation rates (10 percentage points). In contrast, the graduation rate for first-gen students at open-admission schools is below half the rate for non-first-gen by a gap of 23 percentage points.
First-gen students are different from low-income students
I dug a little deeper into graduation rates by running regressions predicting whether a student graduated on the basis of both first-gen status and parents’ income. First-gen students tend to come from lower-income families (average family income of $58,000 by my calculations) than do non-first-gen students (average family income of $120,000). Perhaps the differences in graduation rates are explained by these large differences in family income?
The first lesson from the analysis is that, while income matters, first-gen status matters even when controlling for income. Holding all else equal, I find that first-gen students are 16% less likely overall to graduate than are non-first-gen students with equal parental income. So being a first-gen student really does mean something more than just coming from a low-income family. This finding resonates with other studies that have looked at the experiences of first-gen students. (For further reading, see Terenzini et al., Engle, and Engle and Tinto.)
The second lesson from the regressions is that the apparently varying first-gen/non-first-gen gaps in graduation rate by college selectivity—the ones shown in Figure 3 above—are mostly about the same size after controlling for family income. With these models, I find that first-gen students are about 16 percentage points less likely to graduate than other students at institutions of varying levels of selectivity. The exception is very selective institutions, where the first-gen difference is only about 7 percentage points.
First-gen students warrant more support than they get
I also examined financial aid. Interestingly, public universities give more financial aid to first-gen students while private universities give more to non-first-gen students. (Data for this question comes from the 2016 Baccalaureate and Beyond Longitudinal Study, which is a little more current than the Beginning Postsecondary Students Longitudinal Survey.) The survey data shows first-gen students in public universities get about $5,100 in need-based aid and $10,100 total in their senior year, while non-first-gen students get about $3,200 in need-based aid and $8,700 overall. In private universities, first-gen students get about $8,900 in need-based aid and $19,400 overall, while non-first-gen students get about $8,800 in need-based aid and $22,000 overall.
In other words, public universities give first-gen students more need-based aid than non-first-gen students receive, presumably reflecting income differences. Merit-based aid is about equal. In contrast, at private universities, non-first-gen students get about $2,600 more financial aid than do first-gen students. What’s happening at private universities, presumably, is that non-first-gen students are competed for with considerably more “merit-based’ aid.
Prior research suggests that increased financial aid is particularly important in helping first-gen students succeed, though other academic supports could help as well. Angrist, Autor, and Pallais conducted a field experiment that randomly assigned aid to Nebraska high school graduates to study the effect of merit aids on college degree completion. They found that the estimated effect for first-gen students is twice as large as the estimates for students from more-educated families. Further, Angrist, Lang and, Oreopoulos found that a combination of financial aid for higher grades (with enhanced academic support services) was especially effective for first-gen students, but only for women as it had little apparent effect for men.
In summary, first-gen students do well at selective institutions, but the less selective institutions that most attend haven’t found a way to get graduation rates up compared to rates for non-first-gen students. Part of the difference in outcomes is due to first-gen students coming from lower-income families. Income differences don’t explain everything though. The disadvantages of coming from a family where you are a pioneer in higher education are real.
The author is grateful to UC-Santa Barbara undergraduates and Gretler Fellows Leshan Xu and Karen Zhao for research assistance.
Related Content


Author

The Brookings Institution is committed to quality, independence, and impact.
We are supported by a diverse array of funders. In line with our values and policies, each Brookings publication represents the sole views of its author(s).