
Last week, the National Assessment Governing Board and National Center for Education Statistics released results from the 2017 National Assessment of Education Progress (NAEP). Often referred to as “the Nation’s Report Card,” these results provide a bi-annual barometer on how states and the country as a whole are performing in the classroom. This year’s results are particularly noteworthy because they are from the final NAEP administered before implementation of the new Every Student Succeeds Act (ESSA), which replaced No Child Left Behind (NCLB). In this sense, these results reflect a boundary in the timeline of education policy, demarcating the end of the NCLB era and the beginning of the ESSA era.
The release itself and the early commentary on the results so far has largely highlighted the overall flat trend lines among the nation’s schoolchildren. Though the early NCLB era did see some improvements in student achievement, it appears that this progress has largely stalled during the latter half of the period. Moreover, a dip in performance in the 2015 assessment has persisted in the current results, suggesting it was no statistical anomaly.
Racial achievement gaps continue gradual decline, income-based gaps static
Though the failure to make overall progress in recent years is disappointing, there are some positive trends with respect to achievement gaps. Racial and ethnic achievement gaps have been on a gradual, and at times bumpy, decline since the 1970s. The current results indicate that trend has continued, as shown in Figures 1 and 2 below.


Combining the math and reading scores in the current NAEP results, we see that the white-black achievement gap is down 0.15 standard deviations in fourth grade and 0.11 standard deviations in eighth grade since 2003, the first NCLB-era assessment. The white-Hispanic gap is down 0.15 and 0.20 standard deviations in fourth and eighth grades, respectively, over the same period. Based on the sizes of the gaps in 2003, these represent reductions of 13-25 percent.
For interpretation’s sake, students in late elementary grades grow at a rate of around 0.3-0.5 standard deviations per year (although this varies across tested grades and subjects). Reducing the achievement gap by 0.2 standard deviations could be loosely interpreted as reducing the gap by about a half-year of typical academic instruction.
In contrast to the improvement in racial and ethnic achievement gaps, however, achievement gaps based on students’ eligibility for free or reduced-price lunch—our best proxy for poverty in the NAEP data—do not show much progress. The free and reduced-price lunch (FRPL) gaps have dropped by just 0.03 and 0.02 standard deviations in fourth and eighth grade, respectively, since 2003. Part of the slow progress on this measure is likely attributable to the Great Recession, which coincided with small increases in the FRPL gap for several rounds of NAEP assessments across both grades.
Further, income-based gaps are a complex issue. The FRPL gaps we report here mask important variation that can occur within groups of FRPL-eligible and FRPL-ineligible students. Students in deeply impoverished households may have little in common with other students who come from lower-middle-class households that could also be eligible for the program. Similarly, students just above the income eligibility threshold differ in many ways from wealthy students.
In fact, trends in income gaps can differ based on how groups of students are defined. Sean Reardon has found steadily increasing income-based achievement gaps over the last five decades when comparing achievement from students in the 90th versus 10th percentile of household income (a truer wealthy-poor comparison). Reardon’s findings might help to explain the growing gap between the highest and lowest performers (regardless of income) on the two most recent rounds of the NAEP, during a period of growing wealth and income inequality in the U.S. Thus, even though the FRPL gaps we see appear generally static over this period, other distributional shifts related to household income—and corresponding achievement gaps—could exist outside of NAEP’s view.
States make uneven progress on gaps
The maps below provide a snapshot of the size of different achievement gaps across states, based on the 2017 NAEP results. From here on, we focus on eighth graders for brevity, with trends among fourth graders generally similar. From top to bottom, the maps correspond to FRPL achievement gaps, white-black achievement gaps, and white-Hispanic achievement gaps. Darker shades of blue represent larger achievement gaps. States shaded in gray had insufficient data to report a gap.
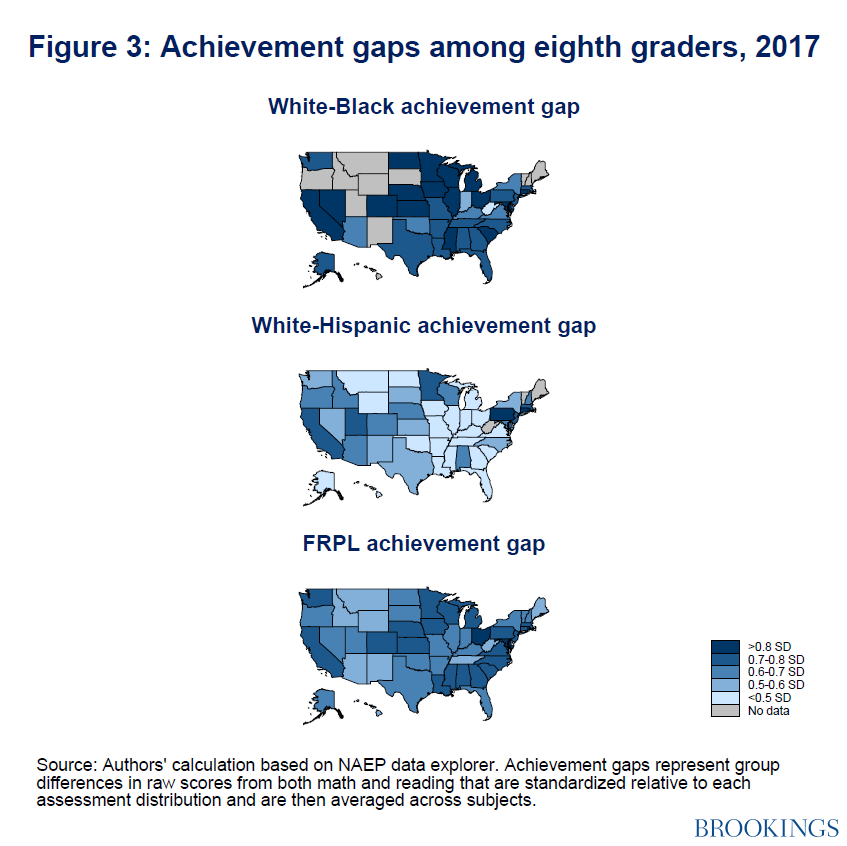
A few patterns are evident in these maps. Consistent with Figure 2, white-Hispanic gaps appear smaller than white-black and income-based gaps. Many more states have large white-black gaps (>0.8 standard deviations) than either of the other types of gaps. In addition, it appears that states with relatively small income-based gaps tend to have relatively small white-black and white-Hispanic gaps.
Interestingly, patterns in achievement gaps across states generally elude regional classification. It does not appear that specific regions of the country are doing particularly well while other regions lag behind, a pattern often seen when looking at overall achievement levels on the NAEP. Nor does it appear that states with high per-pupil spending or Common Core implementation, for example, are doing noticeably better than their counterparts. These maps suggest that local and state policies and conditions—including, for example, within-state wealth and income gaps—could help to define the size of these gaps.
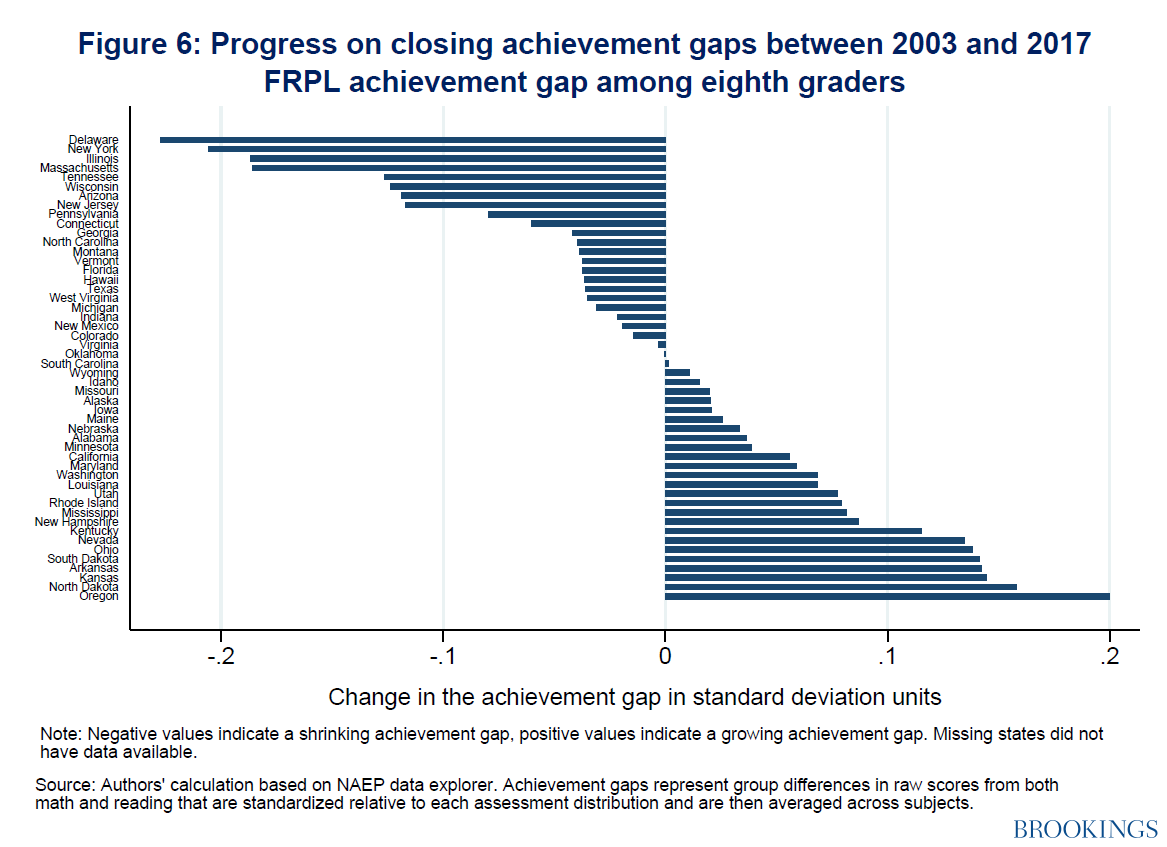
Some states have made large strides in narrowing these gaps since 2003, while gaps in other states have worsened substantially. Figures 4 through 6 show state-level progress in closing eighth-grade achievement gaps since 2003. Negative numbers indicate progress in closing a gap.
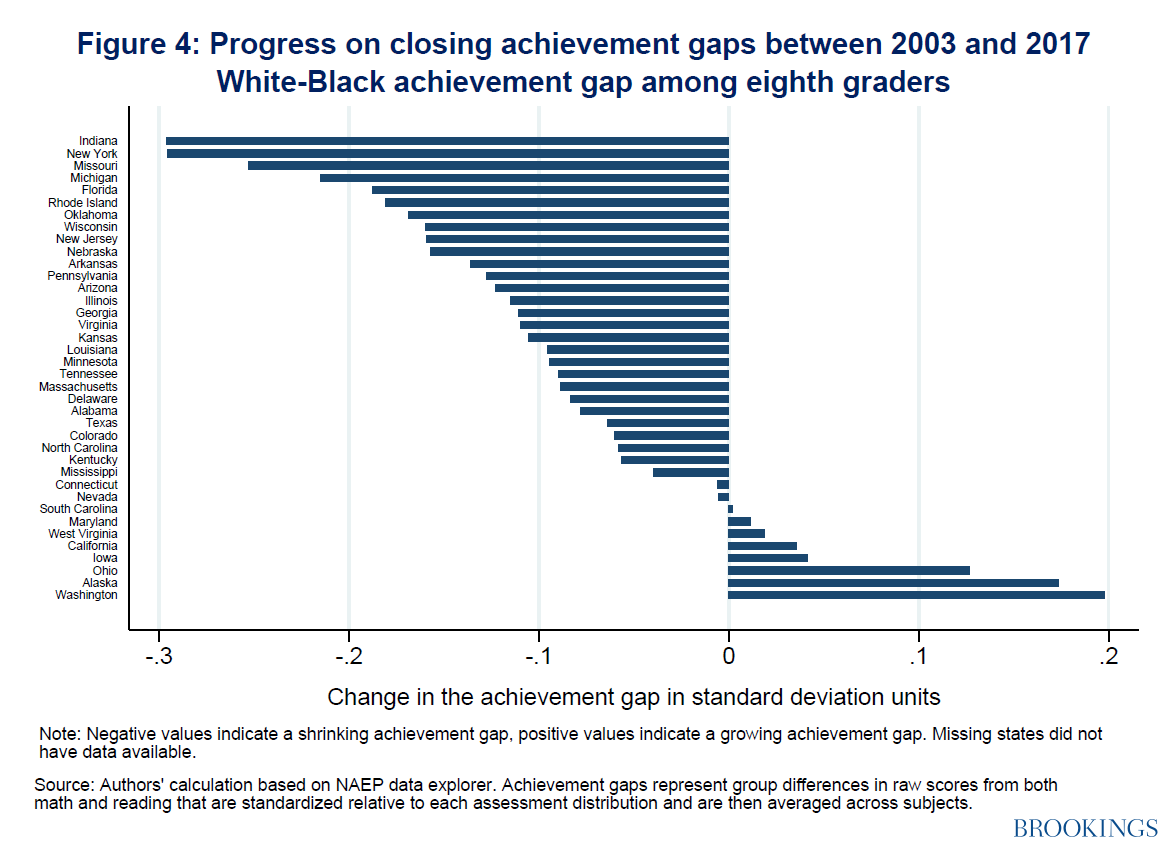
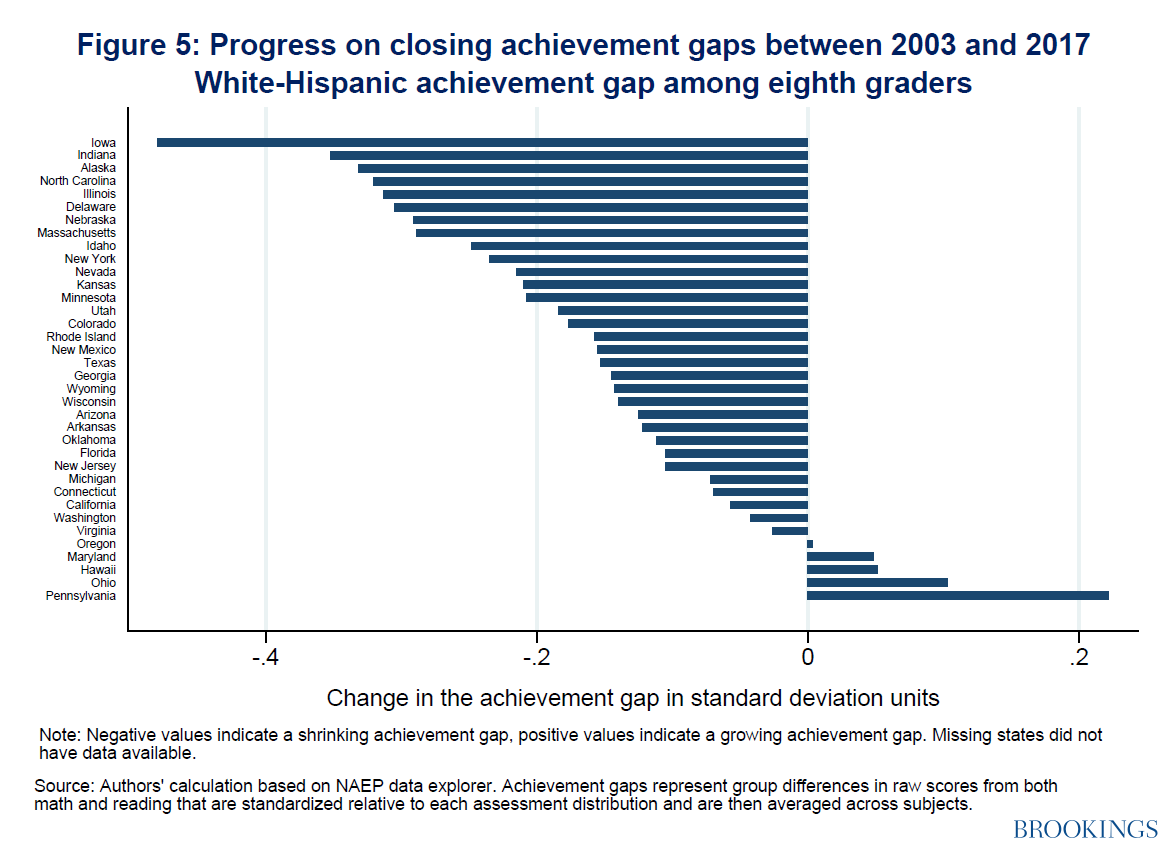
Examining these figures, we see that a large majority of states have made progress on closing race- or ethnicity-based achievement gaps. This is particularly true for white-Hispanic gaps, with 13 states having reduced their gaps by more than 0.2 standard deviations.
However, consistent with the national trends, fewer states have made improvements in closing income-based (FRPL) achievement gaps. Fewer than half of all states have made any detectable progress on closing this gap since 2003. Eight states saw this gap increase by 0.1 standard deviations or more.
Large gaps remain
In spite of the positive trends on race-based gaps that have continued in the 2017 NAEP assessment, there is still far too much daylight between different groups of students. The current national achievement gaps between groups—ranging from 0.6-0.8 standard deviations in Figures 1 and 2—represent differences of roughly one-and-a-half years of normal academic progress. Unless we rapidly increase the rates at which we close our race-, ethnicity-, and income-based gaps, unequal access to education and the consequences of this inequality will affect students today as well as subsequent generations.
Related Content

Authors


The Brookings Institution is committed to quality, independence, and impact.
We are supported by a diverse array of funders. In line with our values and policies, each Brookings publication represents the sole views of its author(s).