
The pipeline for training America’s teachers has been the subject of much discussion, with questions and disagreements about both quantity and quality. A largely overlooked aspect of the pipeline question asks which colleges train teachers. Today’s part of that question asks: Are education majors trained at relatively less selective colleges, or is the distribution of education majors pretty much the same as the distribution of other majors? The answer turns out to be the former. Graduates with education majors are disproportionately found at schools where students have lower SAT scores. The difference in SAT scores is large enough to be thought-provoking, at the least. (For a recent look at SAT scores for teachers see Goldhaber and Walch in EducationNext.)
Let me explain how we went about measuring this. Every university reports to the federal government the number of degrees granted in different disciplines. (Some universities leave blanks in their reporting forms, but in general the coverage is quite good.) Universities also report the 25th percentile and 75th percentile of SAT scores of their student body. We averaged the two SAT numbers, by subject, and then added together the scores for math and reading. That gives us our measure for selectivity of each college. Note we’re not looking at SAT scores of education or non-education majors separately; we’re looking at how competitive the college is.
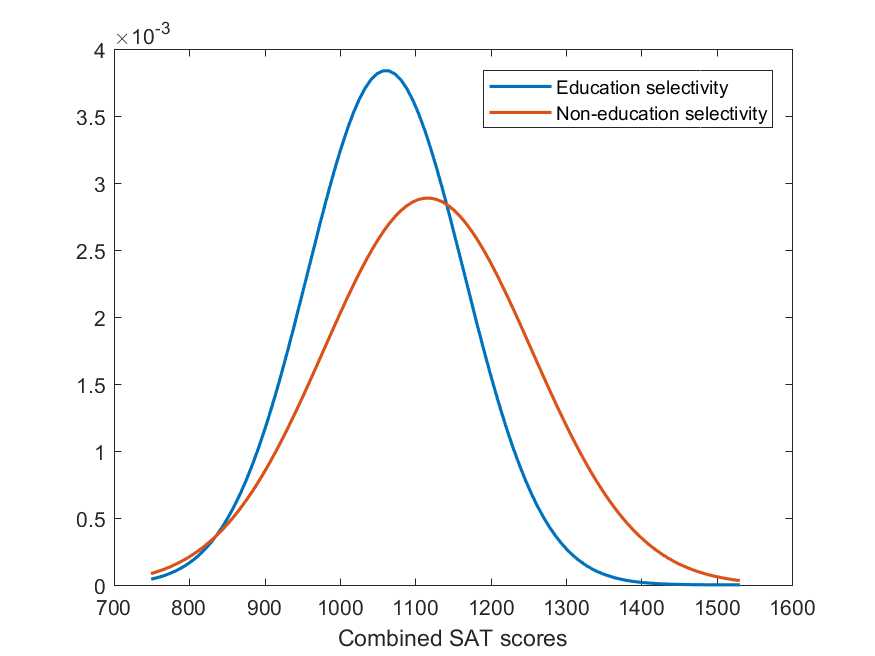
Next we take the average of each college’s combined SAT score, weighted according to the number of education majors it graduates. This gives us what you might think of as an “education selectivity” score, or the average SAT score of admits at colleges that generate the most education majors. The education selectivity score penciled out at 1060 out of 1600. We did the same for non-education majors, producing a “non-education selectivity” score, giving a result of 1116.
Education majors are trained at less selective colleges. In other words, relatively few come from flagship universities while more come from regional colleges with lower bars for entry. But is the difference large enough to be meaningful? The education selectivity score corresponds to about the 60th percentile of college-bound seniors in reading and the 55th percentile in math. The numbers for non-education majors are the 70th and 64th percentiles respectively. The combined difference is nine or 10 percentiles. Thus the difference is not gigantic, but it’s certainly large enough to be meaningful.
While there is a noticeable difference, there is also a great deal of overlap between the colleges that train education majors and colleges that train other disciplines. That’s not very surprising. After all, even colleges with big teacher training programs train students in many other majors as well. The picture here, using bell curves as approximations, shows the selectivity distribution for education versus non-education. While the selectivity difference is noticeable, so is the overlap.
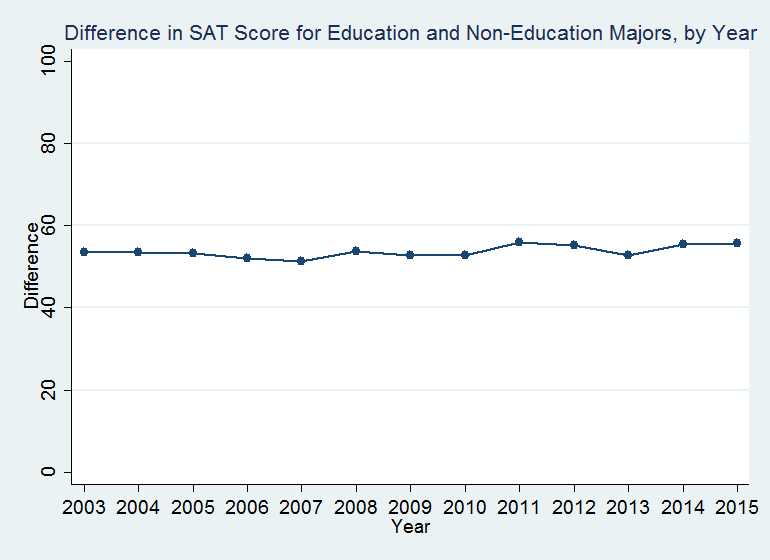
The data presented so far is for the most recent year for which data is available, 2015. Technically, the selectivity gap between education and non-education graduates appears to have risen over the last decade, but just by a couple of SAT points. For all practical purposes, as shown in the next figure, the selectivity difference is quite constant.
In the data, the “education” category presented here encompasses a number of different majors within the field. There is some difference in college selectivity across such majors, but not really all that much. The selectivity numbers for “general” education training and “specific subject areas” are about 25 SAT points higher than for “specific levels and methods” and “special education.” I will admit I was a little surprised to find the slightly low numbers for special education, given how much a teacher needs to know in this area. One should remember, though, that these are selectivity numbers for colleges—not for the individual students who select specific sub-majors.
Having documented that the college pipeline for training teachers runs through less selective colleges, how concerned should we be? We certainly don’t need all teachers to major in education at Harvard. (This happens to be a good thing, since Harvard doesn’t have an education major—although students can earn a Massachusetts middle/secondary school teaching certificate on top of their regular major.)
More-selective colleges do generally provide more academic opportunities than their less-selective brethren. They also often provide better networking opportunities. Both these elements contribute to developing future education leaders in education. (Do remember that alternative certification programs and master’s degrees are not included in any of these numbers.)
What’s more, the difference in selectivity is higher at the upper end of the selectivity distribution than it might appear based on the average numbers. The 90th percentile numbers for college selectivity are 1195 for education majors and 1380 for non-education disciplines. Those numbers correspond to SAT percentiles of 80th and 75th (education majors) versus 94th and 92nd (non-education majors), respectively. That’s starting to be a much larger difference.
So while the lower selectivity of colleges that train teachers is not so large as to be a cause of panic, it is large enough to think about whether this is the best way our system should run.
Isabel Steffens provided research assistance for this post.
Related Content

Author

The Brookings Institution is committed to quality, independence, and impact.
We are supported by a diverse array of funders. In line with our values and policies, each Brookings publication represents the sole views of its author(s).