The strength of the relationship between instructional days and student learning is central to policy debates and cost-benefit analyses regarding the length of the school year. Identifying the causal relationship between instructional days and student learning is difficult, though, as schools with longer terms might differ in other confounding ways (e.g., they might have more effective teachers), changes to school calendars are generally not randomly enacted by specific schools or districts, and the students in a particular school typically start and end the school year on the same dates. Moreover, it is difficult to imagine a district or state conducting a randomized controlled trial (RCT) in which students or schools are randomly assigned to “treatment” and “control” conditions that differ only by school year length.
These challenges have motivated researchers to seek out natural experiments that approximate RCTs by creating quasi-random variation in school calendars and testing schedules. For example, one such study exploits the fact that the fall and spring assessments in a nationally representative survey of kindergarteners were administered on different, randomly determined days, even for students in the same schools and classrooms. The authors found that students who experienced more school days between the fall and spring tests made significantly larger achievement gains than their peers who experienced fewer schools days between tests. Specifically, the authors found that, on average, achievement improves by about one test score standard deviation (SD) over the course of a full (250 calendar day) school year. Analyses of other similar natural experiments suggest a similar relationship between instructional days and average achievement gains. These studies demonstrate that an additional month of schooling would increase the average student’s achievement by 12 to 15 percent of a test score SD, which is similar in magnitude to the impacts of other potential education interventions. For example, the Tennessee STAR experiment suggests that reducing average class size from 22 to 15 increases achievement by 0.20 test score SD and a one SD improvement in teacher effectiveness is associated with an increase of 0.10 to 0.20 test score SD.
However, the studies discussed in the preceding paragraph focus entirely on average effects of instructional time on student achievement. While average effects are interesting and a useful way to summarize the impact of educational inputs and interventions on student learning, they fail to reflect the potentially nuanced ways in which the full distribution of outcomes is affected. This can lead to misleading results and ultimately bad policy recommendations, especially if one part of the distribution is of particular policy interest (e.g., students in the bottom quartile of the achievement distribution).[i] For example, high achieving students might benefit more from additional time in formal schooling than their lower achieving peers, a phenomenon known as the Matthew Effect, which is an instance of “skills begetting skills.”
Michael S. Hayes and I investigate the distributional impact of instructional time on achievement gains in a recent IZA Discussion Paper. We do so by estimating the impact of instructional days on various quantiles of the achievement distribution using the same nationally representative data on kindergarteners. We generally find that high-achieving students benefit more from increased instructional time than do lower-achieving students, which is consistent with a Matthew Effect of formal schooling. Figure 1 depicts these results for math achievement, plotting the effect of one school year (250 calendar days) on each percentile of the math achievement distribution (measured in test score SD). While the average effect of a little more than one SD is, of course, constant across the distribution, the quantile effects are monotonically increasing. Moreover, the effect on the 10th percentile of about 0.75 SD is significantly lower than the average effect, while the effect on the 90th percentile of about 1.75 SD is significantly larger than the average effect. The patterns are similar for reading achievement. Interestingly, and consistent with previous research, we find no evidence that the impact of instructional time varies by observed socio-demographic characteristics of the students.
Figure 1: Quantile Treatment Effects of a 250-day school year on math achievement
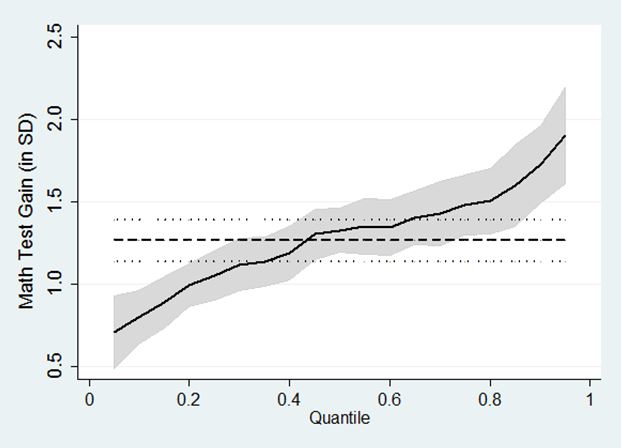
Dashed and solid lines represent linear and quantile regression coefficient estimates, respectively. Dotted lines and shaded areas represent corresponding 95% confidence intervals.
Larger effects of instructional time on the top of the achievement distribution suggest that while lengthening the school year would likely increase average achievement among all students, a widening of the achievement distribution, and therefore the achievement gap, is a potential unintended consequence of such policies.
Generally, policymakers, practitioners, and analysts must consider the average and distributional impacts of educational inputs and interventions. Attention to potential and realized distributional impacts is important to the design, adoption, implementation, and analysis stages of the policy process. For example, when an intervention’s impact is expected to vary across the achievement distribution, the adoption of that intervention should be guided by the policymaker’s primary objective or target population. In the analysis stage, a focus on average effects when treatment effects vary across the achievement distribution obfuscates cost-benefit analyses when a policy objective is to improve educational equity and might even contribute to the persistence of achievement gaps.
[i] Others have made this point in the context of evaluating welfare reform and school choice interventions.


Commentary
Impact of instructional time not equal across students
September 24, 2015