“As of 2013, outstanding student loan balances in the US exceeded $1.2 trillion, more than any other type of household debt with the exception of mortgages.” So write William Gale, Benjamin Harris, Bryant Renaud and Katherine Rodihan, authors of “Student Loans Rising: Overview of Causes, Consequences, and Policy Options,” a paper from the Urban-Brookings Tax Policy Center. The tables below are described in the paper:
Student loan balances reported by households grew markedly over the past two decades.
From the report:
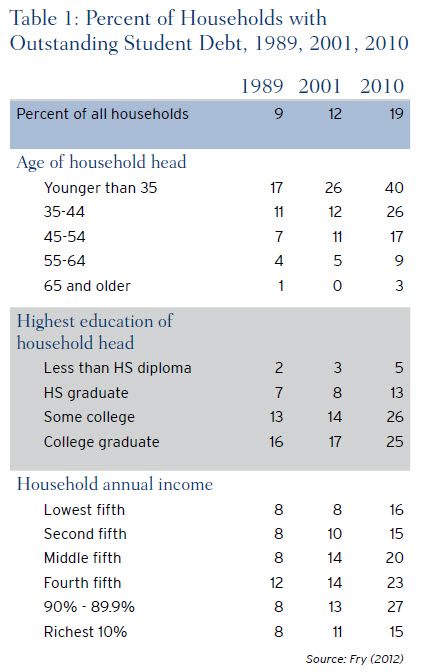
As shown in Table 1, the overall share of households with student debt more than doubled from 1989 to 2010, with the share rising slowly from 9 percent in 1989 to 12 percent in 2001 before jumping to 19 percent by 2010 (Fry 2012). Although the increase throughout this period is largely accounted for by increased prevalence of student debt among households younger than 35, all age groups showed an increase in likelihood of holding a student loan between 2001 and 2010. As of 2010, student loans were owed by more than 40 percent of households under the age of 35, 25 percent of households between 35 and 44, 18 percent of households between 45 and 54, and even 10 percent of households aged 55 to 64. The latter groups presumably represent parents or grandparents who have taken out loans on behalf of their children. In addition, between 2001 and 2010, the prevalence of loans rose significantly in all income groups (especially the 60th to 90th percentiles) and in all educational attainment categories (especially those with some college or who obtained degrees).
Student loans have also grown as a share of income.
From the report:
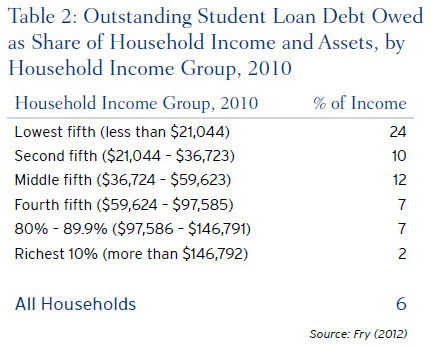
As shown in Table 2, among all households in the lowest fifth of the income distribution, outstanding student loans are about 24 percent of income (Fry 2012). Given that only 16 percent of households in this group have any student loans, outstanding loan balances are quite large relative to income. Likewise, among all households in the next two quintiles, student loans represent 10-12 percent of income, but only one-fifth or less of those households have any student debt. Among higher income households, student loans are a smaller proportion of income.
The authors emphasize that:
From the outset, we note that isolating the impacts of student loan debt is a difficult exercise. Student loan debt represents debt undertaken to finance an investment in human capital. Simply comparing the financial and economic circumstances of households with and without student debt can be misleading if it does not also account for the additional earnings capacity produced by the education that was financed by that debt. Put differently, the key question is how the combination of the debt-financed education and student loan debt affect outcomes.
Download the paper to read all of the analysis and conclusions. See also a new analysis by Beth Akers of the Brown Center on Education Policy: “Reconsidering the Conventional Wisdom on Student Loan Debt and Home Ownership.”
The Brookings Institution is committed to quality, independence, and impact.
We are supported by a diverse array of funders. In line with our values and policies, each Brookings publication represents the sole views of its author(s).


Commentary
Two Charts that Show the Growth of Student Loan Debt
May 12, 2014