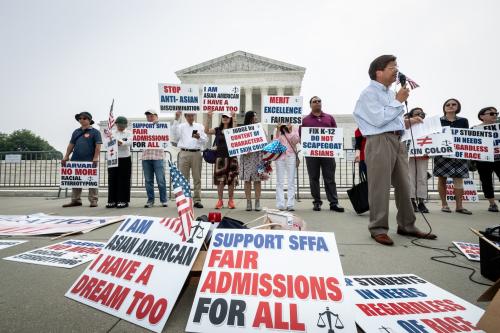
From the Trump administration’s reversal of guidance on the institutional consideration of race, to the current legal case against Harvard University (Students for Fair Admissions, Inc. v. Harvard), opposition to race-conscious postsecondary admissions policies at the national level has been front and center in the public’s mind. However, state opposition and legal bans to affirmative action have had even greater success. As shown below, nine states have ever banned affirmative action; Texas’s ban was reversed by a Supreme Court decision in 2003, leaving eight states that currently ban the policy. The majority of these bans were adopted by either ballot initiatives or legislative referenda.
Figure 1. A recent history of state affirmative action bans
Once bans on affirmative action are in place, a large body of research finds that the enrollment of underrepresented racial/ethnic minority students (particularly black and Latinx students) decreases for colleges, at selective institutions, and graduate and professional schools. Bans on affirmative action likely hinder those same students from accessing all of the benefits that accrue to the graduates of more selective institutions. These bans may lead to the loss of benefits from a racially and ethnically diverse student body that numerous scholars have documented. And race-neutral admissions policies do not appear to result in the degree of parity that race-conscious admissions policies have produced.
Research investigating why and when states adopt affirmative action bans—referred to as policy antecedents—is critical in light of the potential for inequitable experiences and outcomes for some of the most vulnerable student populations in the United States. There are many plausible explanations for why states adopted affirmative action bans. Is it the political ideology of citizens of the state? The concentration of potential college students? Do the choices of other nearby states contribute?
Analyzing the history of state bans
In a recently published study, I investigated what characteristics of states were correlated with affirmative action ban adoption (47 states excluding Alaska and Hawaii because they are not contiguous, and Texas due to adoption not occurring at the state level). I estimated the association between adopting a ban and measures of state demographics and political climate using an event history analysis. These models are able to provide information based on both the longitudinal information about states and comparisons between states that have and have not ever adopted an affirmative action ban.
Evidence explaining bans
I find two consistent state characteristics that are associated with ban adoption. First, the theory I used to guide this research suggested that a direct connection to the phenomenon of interest (in this case access to higher education) could be a critical predictor of the adoption of policies like affirmative action bans. I investigated the relationship between ban adoption and the black, Latinx, black and Latinx, and white shares of undergraduate enrollment.
The only consistent relationship was between ban adoption and white enrollment share. Second, as neighboring states adopt a ban, the state of interest is less likely to adopt a ban. Some individuals and organizations did select certain states as prime environments for advocacy of ban adoption. However, these individuals did not work in all states that adopted bans and, in some states where the individuals advocated, bans were never adopted. This makes it interesting to focus on the way that neighboring states could potentially learn from each other, while acknowledging that outside actors could and did advocate for ban adoption.
What does this mean practically? I find that a 1 percentage point increase in the number of white students attending state flagship institutions is associated with a 10% decrease in the odds of adopting a state ban. Therefore, a decline in the percentage of white students at the flagship institutions is associated with a state having higher odds of adopting a ban. Figure 2 demonstrates this relationship by showing the predicted probability of adopting an affirmative action ban across the range of values for the percentage of undergraduate students at the state flagship who identify as white.
Figure 2. Share of white enrollment at university flagships and affirmative action bans
When 30% of a state’s flagship institution’s full-time, first-time undergraduate population is white, the estimated probability of adopting an affirmative action ban is about 75%. When the percentage of white students increases to 60%, probability of adoption is about 19%. And once white students become 90% of the student body, the probability of adoption for states is about 1%. These numbers are not far off from the actual share of white undergraduate students attending state flagship institutions (ranging from 26% to 97% over the study period).
This research does not establish a cause-and-effect relationship, though several robustness checks further supported the main findings. For instance, I investigated whether the results might differ when including multiple years of enrollment data. I also included alternative models that included enrollment data from all state public institutions or all research-focused institutions, which are more likely to be known by residents of the state. Across all these robustness checks, I still consistently find that the white share of undergraduate enrollment at the flagship institution is the primary predictor of ban adoption.
I find that states in the same region as another state that has adopted a ban are associated with a 60% decrease in the odds of adopting a ban. As an example, this means that a state like Ohio was less likely to adopt a ban on affirmative action once Michigan adopted a ban. States may learn from their neighbors that there is a backlash when states adopt statewide affirmative action bans. Other scholars have found evidence of states choosing not to adopt a policy based on the decisions of their neighbors.
Implications of affirmative action bans
The current study demonstrates how the demographic composition of the state flagship institution and geographic neighbors’ policy decisions have both historically predicted affirmative action policy. Taken together, these findings are troubling. Prior research has shown that states with affirmative action bans have lower enrollment of underrepresented minority students, fewer opportunities for all students to participate in intergroup interactions, and may compromise the support needed to help students through persistence. Meanwhile, race-neutral alternatives do not appear able to replicate the outcomes of race-based affirmative action. Therefore, this policy adoption, which occurs concurrently with decreased shares of white student enrollment at the state flagship, has real, material costs for all students and underrepresented racial/ethnic minority students in particular.
The Brookings Institution is committed to quality, independence, and impact.
We are supported by a diverse array of funders. In line with our values and policies, each Brookings publication represents the sole views of its author(s).


Commentary
Why might states ban affirmative action?
April 12, 2019