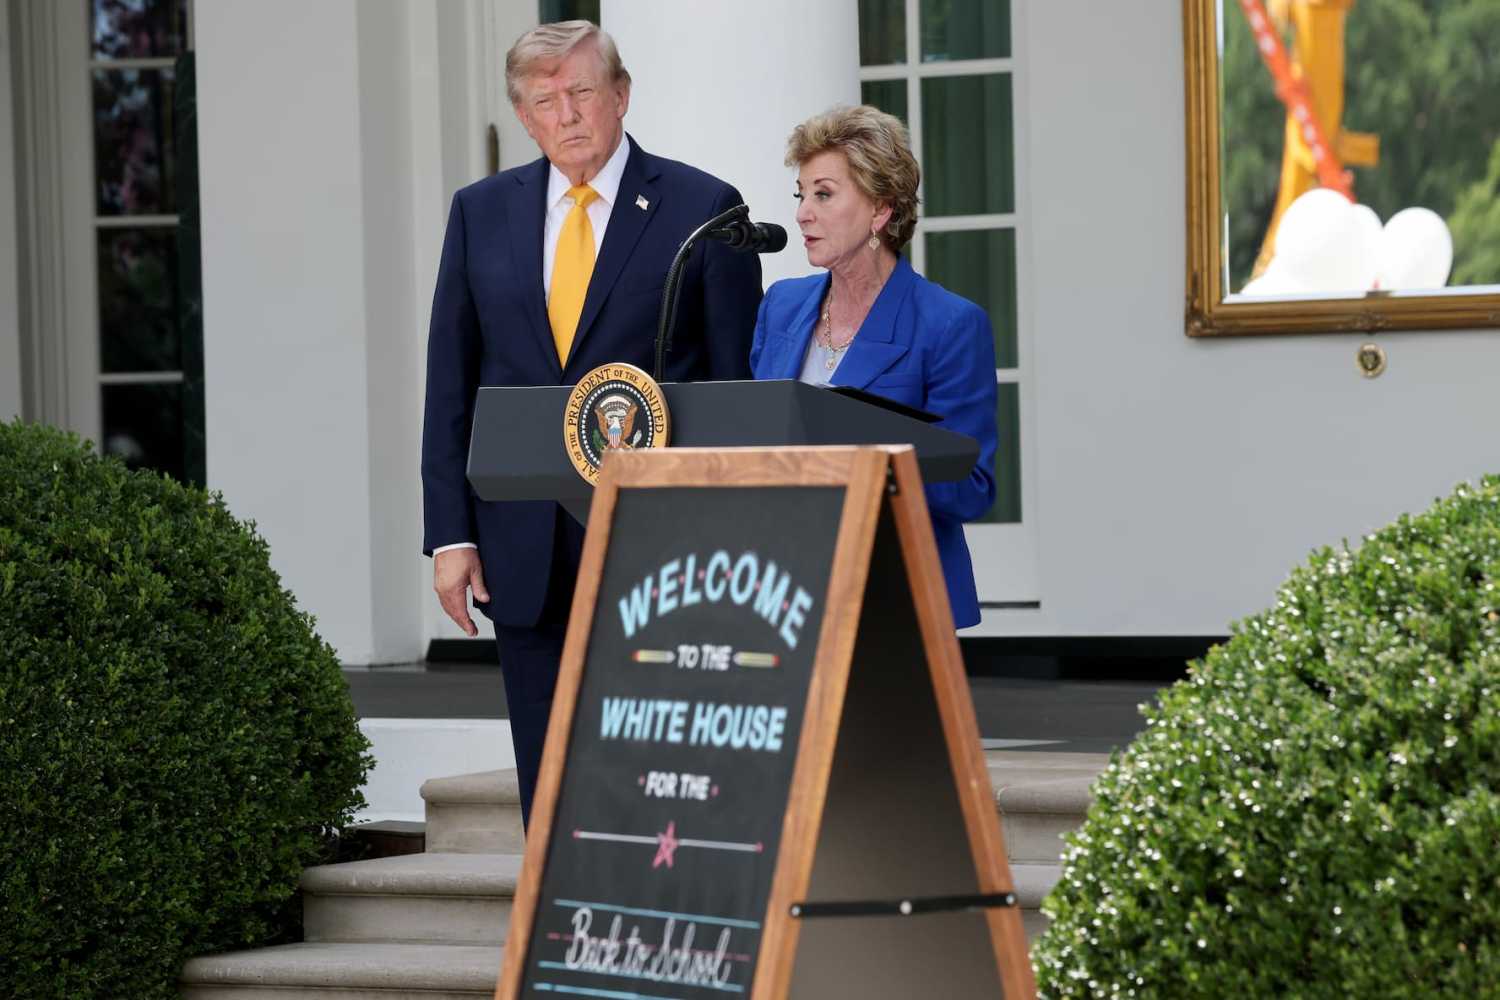
By Jan. 1, leaders of all 50 states and the District of Columbia must decide whether to opt into the Federal Scholarship Tax Credit (FSTC) for calendar year 2027.1 The FSTC is a new mechanism for providing families with scholarships (or vouchers) using diverted federal tax dollars. It works by allowing tax filers in participating states to donate up to $1,700 to a scholarship granting organization (SGO), which then distributes most of that money to families to pay for private school tuition or other eligible educational expenses. The filer gets a full, dollar-for-dollar tax credit—not just a deduction—for their donation.
The FSTC has become a hot-button issue in K-12 education policy and a dilemma for many Democratic governors. On the one hand, opting into the FSTC gives cash-strapped states access to funds that will be available to residents of many other states. On the other hand, there’s a lot to dislike about the FSTC. This includes potentially extreme waste, fraud, and abuse, virtually no emphasis on student outcomes, weak protections against discriminatory practices, and no assurance that funds will reach students in need.
Most Democratic governors seem to be waiting for detailed rules from the Treasury Department before announcing whether they will participate. Treasury could make the FSTC appealing to governors of essentially any state. It could give states discretion over which SGOs operate within their borders, allowing state leaders to—for example—prohibit discrimination based on LGBTQ+ or disability status and target funds to students in poverty. However, the Trump administration has signaled this is unlikely. This leaves Democratic governors to assess what might happen if they open their doors to the FSTC with little control over where funds go.
In this post, we consider who is likely to participate in this program. We argue that, based on the data available, it’s highly likely the donor tax credit will be claimed disproportionately by wealthy individuals in wealthy communities. Unless states can somehow prevent a scenario where most FSTC funds stay in the communities where their donors reside, the FSTC seems poised to become a sharply regressive source of education funding—even where those funds are raised for students in public schools.
Who can give and receive funds through the FSTC?
A few points about FSTC eligibility are important to highlight before we get to the analysis.
First, you must have federal income tax liability to claim a tax credit for making a donation. The FSTC is nonrefundable. This means that filers can’t receive a credit that exceeds what they owe in federal income taxes. If you owe more than $1,700 in federal income taxes, you can get a credit up to $1,700 for an SGO contribution. If you owe between $1 and $1,699, you can get a credit up to the amount you owe. And if you have no federal income tax liability—e.g., because your income is very low—you don’t qualify for a credit even if you donate to an SGO.
Second, the vast majority of students qualify for a scholarship. The FSTC has a means-tested component: It restricts scholarship eligibility to students whose households earn less than 300% of their area’s gross median income. However, that’s an extremely high and uneven bar. Over 90% of U.S. children are income-eligible. Furthermore, if you live in an area with a very high median income, you only need to be within three times that threshold. This means that some families earning more than a half-million dollars per year are eligible for scholarships (while some families earning much less than that, in lower-income areas, are ineligible).
Third, students in both private and public schools can obtain scholarship funds. Our expectation is that private school students will obtain a highly disproportionate share of FSTC funds. However, we are seeing more proposals for how the FSTC could become a mechanism for raising funds for public school districts. The most prominent public school proposal comes from Marguerite Roza’s Edunomics Lab team at Georgetown. They propose that a local school district could work with an affiliated SGO to raise funds to pay for a bundle of “enhanced” services like field trips and AP classes. The idea is that districts could find an enticing revenue stream if families donate to an SGO that supports their neighborhood’s public schools.
Our analysis is not a point-by-point critique of the FSTC or any specific proposal. However, it has implications for understanding how the FSTC could look in practice. Our contention is that state and local leaders should be realistic about who will donate to an SGO and attentive to the possibility that the FSTC will lead to funds moving heavily in the direction of the wealthiest families and districts.
Where is the (potential) money?
We don’t yet know who will benefit from the FSTC, because it won’t go into effect until 2027. However, by pulling together nationwide data on federal income tax filers and evidence from state-level programs, we can make some educated guesses.
We start by examining which communities have more potential local money available based on their residents’ federal income tax liability. To be clear, donors could direct their funds to communities other than their own. However, that would deviate from typical giving patterns. It also seems unlikely to arise from a district-based SGO model for public schools. (We consider the possibility of a state-based SGO model a little later.) Let’s say that you lead a school district in a high-poverty, rural area. If your local donor pool is limited, that may leave you to recruit residents of wealthier areas to donate to your district’s SGO instead of their own. How realistic is that at scale?
To analyze where the potential FSTC money lies, we used 2023 IRS data to identify the distribution of filers’ tax liability. Our estimates capped what any individual tax filer could potentially donate at $1,700 but allowed those with tax liabilities of $1 to $1,699 to donate up to that amount.2 For each county, we estimated the maximum amount of FSTC credits available. We then divided the potentially available funds by the number of school-age children (taken from ACS data). This gives a sense of the maximum pool of local resources per child. We looked at this across different types of counties.
Figure 1 shows what we found by county median income, poverty rate, and urbanicity.
Unsurprisingly, children in higher-income areas have more local FSTC money potentially available in their communities than children in lower-income areas. For example, children in counties that are in the top decile (10%) of median income have almost twice as much potential money available per pupil ($3,859) as children in counties that are in the bottom decile of median income ($2,233). This pattern is evident across different urbanicities, and we see similar patterns by county poverty levels.
These first charts show that wealthier (and nonrural) areas have more potential FSTC funds available locally. In considering potential funds, they reflect the implausible scenario that every filer maximizes their tax credit. Realistically, the true amount of funding will fall far short of the maximum possible funding amount, since most tax filers are unlikely to claim an FSTC tax credit. Additionally, we should be realistic about which tax filers are most likely to maximize their giving. Low-income filers might, understandably, be much less inclined to make a charitable donation and then wait for their tax credit.
To get a sense of how the actual giving patterns might look, we turn to a state-based, tax-credit scholarship program that is already up and running.
Who donates to tax-credit scholarship programs?
To reiterate, we don’t know who will ultimately donate to SGOs via the FSTC, and we can’t know that until the program is operational. However, we can look to existing state programs for hints. We surveyed the country’s tax-credit scholarship programs for one that shares key features with the new federal program and publicly reports data on tax credit recipients. That search led us to Ohio’s Scholarship Donation Credit.
This program, which launched in 2021, offers a dollar-for-dollar, nonrefundable tax credit of up to $750 for individual taxpayers and $1,500 for couples filing jointly who donate to certified SGOs. In the program’s first four years, about 65,000 filers claimed credits totaling nearly $75 million.3 Table 1 compares features of the Ohio program and the FSTC. They share many similarities and a few notable differences (e.g., that Ohio’s program restricts scholarships to students in private schools, with a few exceptions).4
So, who has been getting a tax credit for donating to Ohio’s program?
High-income filers are much more likely to claim this credit than low-income filers. This pattern appears in Figure 2. Even for the highest earners (over $500,000), only about 3.5% claim the tax credit, but that rate is many times larger than the corresponding rates for low- and middle-income filers.5
It’s not just that higher-income filers are more likely to claim this tax credit in Ohio. It’s also that high-income filers who claim this tax credit tend to claim larger credits (and presumably donate more money to SGOs). This is visible in Figure 3.
Now, maybe a lot of these high earners are donating to SGOs that serve low-income families. We haven’t seen any publicly available data that would let us check that. However, an analysis from Policy Matters Ohio notes that many SGOs specify a focus on their local areas and that hardly any of them are in rural communities. Again, we would need to see evidence that people tend to donate to communities other than their own to adjust our expectations for the FSTC.
Putting the pieces together to make some rough projections
In our first analysis (Figure 1), we used nationwide IRS data to show that relatively wealthy areas have more local money that could flow through the FSTC.
In our second analysis (Figure 2), we used data from Ohio to show that higher-income filers are more likely to claim a tax credit for an SGO donation.
We can put these pieces together to inform our projection of the likely profile of FSTC donors. Basically, we take the proportions of filers who claimed a credit in Ohio (by income level) and apply those to the nationwide IRS data. This moves us from an estimate of the total potential funding available by county to an estimate of the funding that might realistically be donated.6
Now, caveats abound. We’re extrapolating giving patterns from a single program in a single state, and we don’t mean to suggest these are precise predictions of how much money a child’s family can expect to receive. Also, there are big, unanswered questions about how the FSTC will look that could shape giving patterns and the overall size of the program. That includes whether advocates succeed in driving up donations by convincing employers or tax preparation companies to create easy ways to contribute to SGOs. Our projections below draw from Ohio’s giving rates, which would correspond to roughly a $1.5 billion total price tag on the FSTC. However, we are more focused on the relative contributions across different community types than the overall amount of money generated.
Figure 4 illustrates our projections by counties’ median income, poverty rate, and urbanicity.7
This suggests that SGO donations (as reflected in tax-credit claims) will skew heavily in the direction of wealthier counties. For example, we estimate that the wealthiest decile of counties will generate about three times as much FSTC money per pupil as the poorest decile of counties. If our estimate is even close, it would take an extraordinary amount of targeted giving to low-income families to keep this program from being highly regressive.
FSTC threatens to undermine progressivity of federal education funding
One lesson emerging from state-level school choice programs is that they steer disproportionate resources to the wealthiest communities unless they are explicitly designed to benefit families in need. The FSTC was not designed to benefit students in need, and this analysis provides more reason for concern about where its funds might go. This is true for potential public school recipients as well as private school recipients.
The possibility of the FSTC becoming a regressive stream of education funding is especially troubling when we consider the federal government’s historical role in education. For decades, the federal government has provided compensatory funding to students whose needs might not be met through local and state revenue streams. The federal government has been a reliably (if insufficiently) progressive funding source. If our predictions for the FSTC are accurate, and if the FSTC grows to a size that its advocates seek, it could turn the federal government from a progressive to regressive education funder. Proposed cuts to programs like Title I could expedite that transition. (We should note that, technically, these are federally subsidized donations, not federal funds. However, since they are federal tax revenues that are being diverted to the FSTC, that distinction seems more semantic than substantive.)
Now, is there a way for schools—and, especially, public schools—to access this new revenue stream without it becoming regressive? The clearest path would be for the Treasury Department to give states discretion over how SGOs operate within their borders. State leaders could use that discretion to ensure that funds are reaching the students who need them most (and to prevent some of the abuses and harms the FSTC is vulnerable to). Unfortunately, that doesn’t seem to be in the Trump administration’s plans.
Maybe state and local leaders will find another path. Maybe they could enact accompanying finance reforms that offset a regressive turn in federal funding. Or maybe, instead of a district-based model for raising funds for public school students, they could support the creation of a single, statewide SGO (or even a multistate SGO) to support public school students. The Edunomics team proposed an approach along these lines. It’s possible—though far from certain—that moving away from a district-based model could weaken the links between how much a community donates and how much it receives in scholarship money.
Of course, another option for state leaders is to spend the next year learning from the experiences of states that dive into this program in its first year. The FSTC comes with a great deal of risk and uncertainty, especially in its earliest days. State leaders who are now on the fence may find themselves with a much clearer sense of whether to opt into this program—and, if they do, how to minimize its harms and maximize its benefits—if they take the opportunity to learn from the states that dive right in.
Related Content

Authors


-
Footnotes
- The FSTC was created by the One Big Beautiful Bill Act of 2025. It is sometimes referred to as the Education Freedom Tax Credit (EFTC) (and, in a previous iteration, was known as the Educational Choice for Children Act).
- We calculated the average tax liability per filer within each of the eight adjusted gross income categories in each county. We then multiplied that average (or $1,700 if the average is larger than the maximum credit) by the number of filers within the county’s corresponding income bin. Then, we added that result across income bins to get the total amount of credit potentially claimed within a county. With this method, we estimate an overall potential nationwide pool of about $180 billion, which is similar to what the American Federation of Children recently estimated using a different approach. (Note that the program would only approach $180 billion if every tax filer donated the maximum amount, which isn’t plausible.) We use tax liabilities after credits (line 22 on Form 1040) for this analysis. We also ran this analysis with line 24 (total tax liability) and line 16 (income tax liability before credits), and the amounts, though larger, are similarly distributed across counties.
- We used Table Y-1 (individual income tax returns) and added the number of returns that claimed the Scholarship Donation Credit and the value of those credits (line 15) for 2021 to 2024.
- Three of Ohio’s 72 certified SGOs in 2025 provided scholarships for full-day kindergarten at public schools.
- We found another interesting hint about who might claim a federal tax credit via the FSTC. It’s highly unusual to have a full, dollar-for-dollar federal tax credit, and some have pointed to the Presidential Election Campaign Fund as one example. It’s been noted that the share of voters checking the campaign fund box has plummeted in recent decades. We noticed another pattern, which is that high-income filers have been more likely than low-income filers to check that box—even though checking the box doesn’t affect anyone’s returns. In 2004 (where we found data), filers earning more than $1 million were about twice as likely to check that box as filers earning less than $100k.
- We calculated the likelihood of claiming the Ohio tax credit for the adjusted gross income bands reported in the county-level national IRS data for filers that had state income tax liability after nonrefundable credits (line 10 of tax year 2024 form Ohio IT 1040). We then applied the corresponding likelihood of claiming the credit to filers within each income band in each county in the country.
- Note that these per-child estimates include all school-age children in the denominators even though many children are unlikely to obtain any scholarship funding at all (leaving more money per child for those who do).
The Brookings Institution is committed to quality, independence, and impact.
We are supported by a diverse array of funders. In line with our values and policies, each Brookings publication represents the sole views of its author(s).