On March 16, 2020, the Federal government issued new guidelines to help protect Americans during the coronavirus pandemic. Dubbed “15 days to slow the spread,” these guidelines urged Americans to avoid social gatherings, discretionary travel, shopping trips, and social visits. Since then, many states, at different times, also issued directives to promote social distancing.
What was the impact of these Federal and State declarations on reducing movement? To address this question, we analyze data from SafeGraph—a data company that aggregates anonymized location data from numerous applications.[1] We define commercial foot traffic as the total number of people going into commercial places in a State in any given week, and we plot this as a proportion of the State’s population.
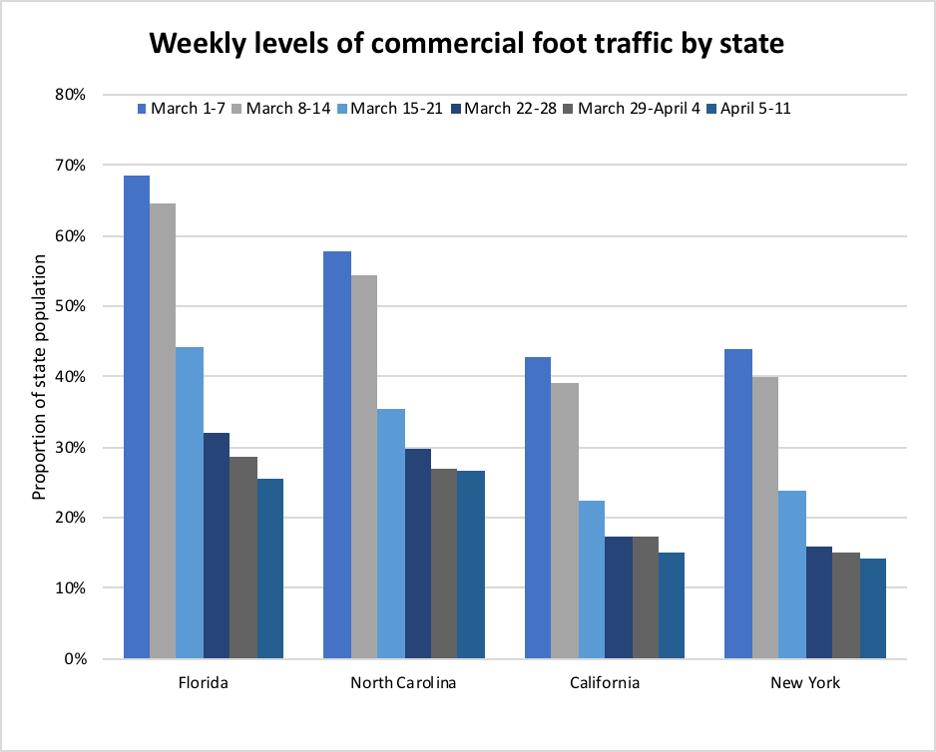
These data suggest a strong response to the March 16th national guidelines. Some states such as New York and California ordered closure of non-essential businesses around the same time, suggesting that people were responding to both national and state guidelines. However, States such as Florida and North Carolina did not mandate non-essential business closures until later, but there was a decline in commercial foot traffic following the national guidelines.
 Note: y-axis shows the proportion of the State’s population going into commercial places, x-axis shows time in weeks (week of March 1-7 to week of April 5-11). The highlighted column on the graphs shows that the largest decline in the level of commercial foot traffic occurred between the second and third week of March—the week immediately before federal guidelines were announced and the week when federal guidelines were announced respectively.
We illustrate this point further using data from four states: New York, California, Florida, and North Carolina. Although these states issued stay at home orders on different dates, the largest decline in commercial foot traffic for each of these states occurred in the third week of March.


The differing responses of U.S. states to the COVID-19 pandemic attracted a considerable amount of media attention – most vividly, perhaps, in coverage of Spring Break beach parties in Florida. Most recently, the white house announced a three-phase plan to help state and local officials “open up America again.” While some governors are already easing restrictions, others have no intention to “re-open” their states.
It is not possible to separate out the impact on movement of different directives issued at different times at different levels of government – counties, cities, states as well as at the Federal level. But the data we have analyzed here suggest that national messaging has a national impact, independent of state-level directives.
[1] To enhance privacy, SafeGraph excludes census block group information if fewer than five devices visited an establishment in a month from a given census block group.
Thanks to Katie Merris for her support with graphics.
Related Content


Authors


The Brookings Institution is committed to quality, independence, and impact.
We are supported by a diverse array of funders. In line with our values and policies, each Brookings publication represents the sole views of its author(s).


Commentary
White House or State House: Who do we listen to on social distancing?
April 27, 2020