This text is based on a keynote address given by Nellie Liang at the Volatility and Risk Institute’s sixth annual conference, “Nonbank Financial Intermediation and Financial Stability,” held April 25, 2025. Accompanying charts are available here.
Thank you for inviting me to speak at this Volatility and Risk Institute conference. I will discuss the efforts in recent years to strengthen Treasury market resilience and what’s still to come. Resilience has always been a high priority. I will make the case that it is ever more important now, as Treasury debt is projected to grow rapidly and chaotically, and uncertain policies will make shocks large.
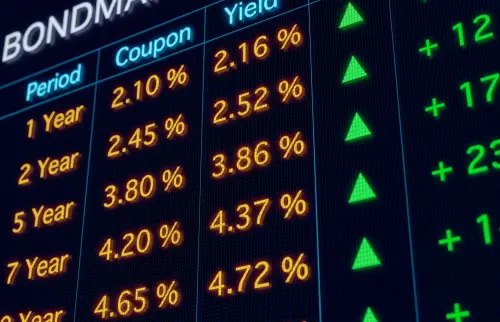
We all recognize that the Treasury market is a critical market. It is key for financing the U.S. government at the lowest cost to the taxpayer. It is an important channel for the Federal Reserve’s monetary policy. It provides the benchmark risk-free yield curve. And it is a safe asset and is used by many financial firms, both banks and nonbank financial firms, to meet liquidity needs and manage risks.
A few examples for nonbanks include stablecoins that hold Treasuries as a reserve asset to help maintain par; hedge funds that use Treasuries as collateral for good lending terms; open-end bond funds that use Treasuries to manage the mismatch between the liquidity of bonds and shareholder redemptions; and insurers and pension funds that use Treasuries to meet margin calls on derivative positions.
The Treasury market serves these critical functions because it is the deepest and most liquid market in the world. It has achieved this distinction because it is supported by a strong economy, founded on rule of law, protection of creditor rights, and rigorous institutional policy frameworks. It also relies on an efficient and stability-enhancing regulatory and market structure to help ensure that market liquidity is elastic and resilient—that is, investors can transact when needed at low cost without materially moving the price, under normal economic conditions but also during periods of uncertainty and stress.
In the past decade or so, we’ve seen a few cracks in market liquidity, and then significant dysfunction in the “dash for cash” in March 2020 at the onset of the COVID pandemic. In response to these events as well as ongoing changes in technology and trading practices, the IAWG undertook a comprehensive effort to strengthen the Treasury market.
I will mainly focus today on Treasury market liquidity. I’d like to give a shout out to the inter-agency working group (IAWG), which includes staff from the Treasury, the Fed (Board, New York, and Chicago), SEC, and CFTC, who have worked hard and pushed forward this agenda for the past few years. I’d also like to give a special thanks to Treasury’s debt management and fiscal teams, groups of very dedicated public servants, who track government receipts and expenditures to determine how much Treasury debt to issue, what kinds of securities to issue each quarter, and to keep financing regular and predictable so as to finance the government at least cost over time. They manage hundreds of auctions each year, and when I was there, also had to navigate two very perilous debt ceilings.
Let me turn first to current events. Policy uncertainty has become massive in recent weeks, and financial market volatility has shot up. The tariffs that President Trump announced on April 2 were bigger and broader than expected and set off a volatile period for financial markets. There have been detailed accounts of price moves as policy swung between temporary pauses in tariffs for some countries and escalation for others, and even threats to monetary policy independence. All told, however, the net effect is higher rates beyond the short-end of the yield curve. In particular, yields on 10-year and 30-year Treasury securities are up around 40 to 50 basis points from their recent lows in early April.
Generally, a higher interest rate on dollar investments should strengthen the dollar. But that has not been the case in recent weeks. As interest rates rose, the dollar fell, shown by the USD/Euro exchange rate [chart]. Some investors are attributing some of the rise in rates from increasing doubts about Treasury securities as the pre-eminent global safe-haven asset. Jiang, Krishnamurthy, et al (2025)1 have shown that the spread of a synthetic Treasury security constructed from German bunds hedged into dollars relative to the actual Treasury security has widened, consistent with Treasury securities having cheapened relative to other safe haven assets.
The correlation between interest rate and the dollar is not the only one to break down. The correlation between bonds and equities also did. Using this correlation, Acharya and Laarits (2025)2 show a reduction in the safe-asset hedging properties of longer-term Treasury securities. For shorter-term securities, the convenience yield has not declined, and rates have fallen as investors price the higher odds of a recession in the near term.
Investors also began questioning whether markets would become dysfunctional, as they did in March 2020. The 3-year auction on April 8 didn’t go well, and there were concerns that funding pressures would escalate because highly-leveraged hedge funds might have to unwind positions in swaps and cash-futures basis positions. But the worst fears about market functioning were not realized, though market participants believe conditions would have worsened materially if the tariffs had not been paused or the 10-year auction went badly.
Actual measures of market liquidity available to the public are limited. I show one here on market depth—the sum of three bids and offers by queue position in the mornings for 2-year, 5-year, 10-year, and 30-year Treasury securities—courtesy of J.P. Morgan based on Brokertec data. This measure of market depth fell sharply on the recent news, but not to levels as low as in March 2020 or March 2023. I plotted this measure of market depth against the MOVE index, a measure of interest rate volatility. As you can see, there is a strong correlation—as interest rate volatility increases, market depth decreases, not unexpectedly as market participants pull back from risk-taking as volatility and uncertainty increase.
As shown in the chart, the most extreme observations are for March 2020, shown by the dark blue dots in the lower left, where market depth is well below what might be expected given the volatility. Those blue dots illustrate the conditions when the Fed announced that it would purchase securities “in amounts necessary to ensure market functioning.” The gold dots represent March 2023 when banks with large interest rate risk exposures came under pressure and two failed dramatically. In that episode, interest rate volatility was exceptionally high and market depth unusually low, but market participants at the time reported that markets were functioning albeit not as smoothly as in normal times. The current episode is shown by the red dots. Interest rate volatility is at the high end, and while market depth has fallen, it is well within—maybe even at the upper end of—the cloud of dots. Of course, market depth is just one measure on market liquidity, and we would also like to be able to see measures of price impact, bid-ask, one-the-run, and off-the-run spreads. But this graph captures what many market participants have said and also is consistent with the very high daily trading volumes in April.
What these metrics illustrate is that the markets continued to function in recent weeks. This is not a repeat of March 2020. Treasury prices are falling, yields are rising, but not because market participants cannot transact. A second point to make, however, is that market dysfunction is hard to predict. Some of the blue dots for the week of March 8, 2020, when COVID risk were becoming apparent and volatility was high, were well above the cloud of dots, and that was just two weeks before the Fed began purchasing Treasury securities.
I testified to Congress recently on Treasury market resilience work and had emphasized the importance of the work following March 2020. The Fed intervened by purchasing Treasury securities after first trying repo operations to restore market functioning. Fortunately, at that time, the Fed’s objectives for market functioning were aligned with its monetary policy objectives for price stability and full employment. But we should anticipate a time when policy objectives aren’t aligned—that is, when markets aren’t functioning but inflation is above desired targets. Such a scenario seems more possible now. This scenario makes it all the more important to strengthen Treasury market resilience.
Treasury market resilience and recent reforms
Let me turn now to reform efforts, as outlined in the IAWG report in 2021.
The starting point for this work acknowledged significant changes in past decades. Electronic trading has increased, and principal trading firms now represent most of the trading in electronic inter-dealer markets. Traditional securities dealers have pulled back from market-making after capital standards and risk management practices were strengthened after the Global Financial Crisis (GFC). In addition, as shown in the chart, Treasury debt has continued to grow rapidly, reaching nearly 100% of GDP. And the investor base is becoming more price sensitive, as the share held by foreign investors, depository institutions, and the Fed, who are less price-sensitive, has fallen, from more than 70% in 2015 to 50% in 2024.
There have been some significant accomplishments. I will not go through each of the five workstreams, but will highlight a few that might be of particular interest to this audience.
A first priority is to improve data quality and transparency. Much more data on Treasury securities transactions now are being disclosed to the public. Trading volumes on a daily basis started to be provided to the public since February 2023. From these data, we could see that in recent weeks, daily trading volumes surged to almost twice normal volumes. Also, price and quantity data for on-the-run securities transactions now are being made available. These transactions represent about one-half of overall daily trading and about 75% of the daily activity in nominal coupon securities.
In addition, Treasury’s Office of Financial Research (OFR) started a new data collection for non-centrally cleared bilateral repo, which closes a large important data gap in the repo market. This collection will, for the first time, provide authorities data to monitor a segment of the market that has been opaque since before the GFC, and is where significant risks materialized in March 2020. The new data covers more than $2 trillion, about 45% percent of the repo market. The collection started formally in December 2024 and represents a multi-year effort built on data pilot exercises in 2013 and 2022.
On hedge funds, the SEC began collecting more information from Form PF, including separate reporting of Treasury cash and derivatives. In addition, OFR created an interactive monitor with aggregated data on hedge funds from Form PF and other sources. You can use this new Hedge Fund Monitor to monitor aggregate trends. For example, both repo (mostly Treasury) and prime brokerage borrowing have risen significantly in the past two years, though both turned down in 2024:Q4. It also shows that, despite this growth, leverage of the 10 largest HFs did not rise on net over this period.
A second priority is to improve the resilience of market intermediation.
The SEC’s rule for central clearing of Treasury securities is potentially the most significant and transformational to the Treasury market. Central clearing is used for other assets—including equities and exchange-traded derivatives. It can reduce risk by standardizing risk management requirements, and it can increase intermediation capacity of bank-affiliated dealers because bank capital and leverage requirements recognize the risk-reducing effects of multilateral netting of centrally cleared trades. The centralization of transactions also provides greater visibility into market conditions.
The new mandate will lead to a significant increase in the volume of transactions to be centrally cleared. Treasury clearing activity is expected to increase by more than $4 trillion each day, and at least 7,000 new relationships between direct and indirect participants are expected to be needed in advance of the deadlines.3
A key issue related to the additional significant volume is that currently there is only one CCP for U.S. Treasuries. But CME and ICE are also preparing to enter. Entry could lead to greater competition and innovation and bring with it different clearing offerings and pricing, and from a macro perspective, there are gains to operational resilience from multiple CPPs. These are significant benefits even as there are some open questions about a loss in netting benefits and fragmentation of liquidity pools when there is more than one CCP.
There are many complicated operational, regulatory, and accounting issues to resolve in moving to central clearing and some concerns about potentially higher transactions costs from higher risk management practices. But there is general recognition by the industry groups of the benefits, and they have been engaged actively and are committed to the next steps. As the issues are discussed, it will be important to stay focused on achieving the goals of expanded intermediation capacity and managing leverage and pro-cyclicality in the system.
These objectives are also affected by bank capital regulations. Changes should be considered to the supplementary leverage ratio (SLR) put in place following the GFC. The SLR requires banking firms to hold the same amount of capital for riskless reserves at the central bank as they would for risky assets. To the extent this ratio is binding and not functioning as a backstop, it should be adjusted.
One change could be to exclude central bank reserves and perhaps Treasury securities in the trading book, but not all Treasuries. That is because Treasury securities have interest rate risk, as we saw in the bank stresses in March 2023. There are some concerns that the simple adjustment to exclude reserves could reduce rather than expand intermediation capacity in stress because putting Treasuries on the balance sheet would make the SLR more binding. So that leads to some more complicated options to consider: The Fed and OCC have discussed calibrating the SLR to half the GSIB surcharge. Another option would be to make the enhanced-SLR buffer countercyclical, where the buffer could be released in periods of market-wide stress, based on triggers that are defined ex ante so that banks could plan for a release. On the flip side, the buffer would need to be rebuilt after stresses had eased so that it would be available to be released were market-wide stresses to escalate again. To emphasize again, any changes to the SLR should avoid reducing total bank capital, especially at this time, when Treasury debt is rising, interest rates are higher, and policy uncertainty is high.
A next step for the resilience work is to better understand the potential interactions of the various reforms on intermediation capacity and on leverage in Treasury markets. In particular, expanded central clearing and SLR reform are complementary and interconnected, and more work on the interactions is needed as “how” central clearing will be implemented is progressing. In addition, there are two changes by the official sector that impact intermediation capacity. The Fed put in place a standing facility to finance Treasury repo with pre-authorized dealers and banks, which could encourage dealers to invest in market-making capacity and support liquidity in times of market stress. In addition, Treasury initiated a limited buyback program to allow dealers to sell off-the-run securities on a predictable basis to help free up their balance sheets.
Conclusion
I will finish with three summary points:
Treasury markets have been working. Treasury prices have been falling, but not because of lack of market liquidity. Recent moves reflect breakdowns in traditional correlations between Treasury securities and the U.S. dollar and with equities, consistent with investors reassessing Treasury securities as a global safe-haven asset.
Resilience in market liquidity is ever more important now. First, the Federal Reserve may have less ability to respond to market dysfunction by purchasing Treasury securities when inflation is above its target. Second, if chaos and uncertainty are the dominant investment themes and shocks likely to remain large, interest rates will be higher. With Treasury debt projected to continue to grow and interest rates higher (without also higher growth), the risks to fiscal sustainability are increasing because it raises the risk of a self-reinforcing cycle of higher rates and higher debt.
Third, in light of these developments, while the SLR should be adjusted to function as a backstop, now is not a good time to reduce the total amount of bank capital.
Author

Related Content
-
Footnotes
- Jiang, Z., A. Krishnamurthy., H. Lustig, R. Richmond, C. Xu (2025), “Dollar Upheaval: This Time is Different.”
- Acharya, V and T. Laarits (2025), “Tariff War Shock and the Convenience Yield of U.S. Treasuries–A Hedging Perspective.”
- Treasury Clearing Mandate Survey White Paper | DTCC and U.S. Treasury Central Clearing.
The Brookings Institution is committed to quality, independence, and impact.
We are supported by a diverse array of funders. In line with our values and policies, each Brookings publication represents the sole views of its author(s).


Commentary
Treasury market resilience—ever more important
April 30, 2025