Key Trends Affecting Taiwan’s Overall Foreign Trade
The development success story of Taiwan, which is not endowed with abundant natural resources, has drawn substantially increased attention in recent years. Undoubtedly, the island’s economic success is linked to the development policies it followed. Recognizing the importance of promoting exports in the early stages of development, Taiwan switched from import substitution strategies to export-oriented strategies in the late 1950s, which have been a driving force for expansion in the decades since.
However, for both exports or imports, Taiwan’s relative importance within global trade has fallen steadily since 2000. As presented in Table 1, whereas in 2000 Taiwan ranked 14th in the world in terms of exports, accounting for 2.3 percent of total world exports, by 2015 its ranking had fallen to 17th and its share of total exports to 1.7 percent. A similar decline can be seen in imports, where Taiwan’s global ranking has fallen by three places since 2000 and its share of world imports dropped from 2.1 percent in 2000 to 1.4 percent in 2015. There are several reasons behind this decline, but the key factors can be summarized as follows:
- Since 2000, the global economy has experienced several pronounced downturns. As a trade-oriented economy with a relatively small domestic market, Taiwan was particularly affected by these declines;
- By comparison with other countries, Taiwan has had few opportunities to negotiate free trade agreements (FTAs), putting Taiwan in a disadvantageous situation when it comes to foreign trade;
- Taiwan mainly exports semi-finished products, while finished products account for only a relatively small share of Taiwan’s total exports. Additionally, Taiwan lacks strong brands that have high name recognition in international markets. Over the long term, this has affected Taiwan’s export performance.
| 2000 | 2005 | 2010 | 2015 | |
|
Taiwan’s exports (US$ billions) |
148 | 198 | 275 | 285 |
|
Taiwan’s share of total global exports (%) |
2.3 | 1.9 | 1.8 | 1.7 |
| Taiwan’s export ranking | 14 | 16 | 16 | 17 |
|
Taiwan’s imports (US$ billions) |
140 | 183 | 251 | 238 |
|
Taiwan’s share of total global imports |
2.1 | 1.7 | 1.6 | 1.4 |
| Taiwan’s import ranking | 15 | 16 | 17 | 18 |
Source: World Trade Organization, International Trade Statistics, 2000, 2005, 2010 and 2015 issues, (https://www.wto.org/english/res_e/statis_e/its_e.htm).
The Change in the Bilateral Trading Relationship between Taiwan and the United States
The United States is an important trading partner for Taiwan, and is one of Taiwan’s main export markets. However, as can be seen from Table 2, both Taiwan’s exports to and imports from the United States have been falling. In 1990, the United States was Taiwan’s largest export market and its second-largest source of imports. At that time, annual Taiwan exports totaled US$21.8 billion, representing 32.30 percent of Taiwan’s total exports, while U.S. imports amounted to US$12.6 billion, accounting for 23.06 percent of Taiwan’s total imports. In that year, Taiwan posted a trade surplus of US$9.1 billion with respect to the United States, which accounted for 72.31 percent of Taiwan’s overall trade surplus.
By 2015, Taiwan’s exports to and imports from the United States had risen to US$34.2 billion and US$26.4 billion respectively, but the share of Taiwan’s total U.S.-bound exports had fallen from 23.42 percent in 2000 to just 12.21 percent in 2015, and the share of Taiwan’s total U.S. imports had fallen from 17.96 in 2000 to 11.54 percent. The share of Taiwan’s overall trade surplus held by its trade surplus with respect to the United States also declined, from 72.31 percent in 1990 to 15.22 percent in 2015. There has thus been a dramatic weakening of the bilateral trade relationship; overall, the United States has fallen to the fourth largest trading partner for Taiwan.
| Year | Taiwan’s Exports to the U.S.A. | Taiwan’s Imports from the U.S.A. | Taiwan’s Trade Surplus With Respect to the U.S.A. | |||||
| Ranking |
Value (US$ millions) |
Percent share | Ranking |
Value (US$ millions) |
Percent share |
Value (US$ millions) |
Percent share | |
| 1990 | 1 | 21,778.47 | 32.30 | 2 | 12,633.68 | 23.06 | 9,144.80 | 72.31 |
| 1995 | 1 | 26,903.79 | 23.74 | 2 | 20,902.79 | 20.10 | 6,001.00 | 64.32 |
| 2000 | 1 | 35,588.35 | 23.42 | 2 | 25,269.68 | 17.96 | 10,318.67 | 91.99 |
| 2005 | 3 | 29,113.72 | 14.67 | 2 | 21,170.68 | 11.59 | 7,943.03 | 50.21 |
| 2010 | 4 | 31,468.66 | 11.46 | 4 | 25,379.14 | 10.10 | 6,089.52 | 26.22 |
| 2015 | 4 | 34,256.64 | 12.21 | 4 | 26,410.67 | 11.54 | 7,845.97 | 15.22 |
Source: Taiwan: Customs, Trade Regulations and Procedures Handbook – Strategic Practical Information and Regulations (International Business Promotion, Inc.: 2016)
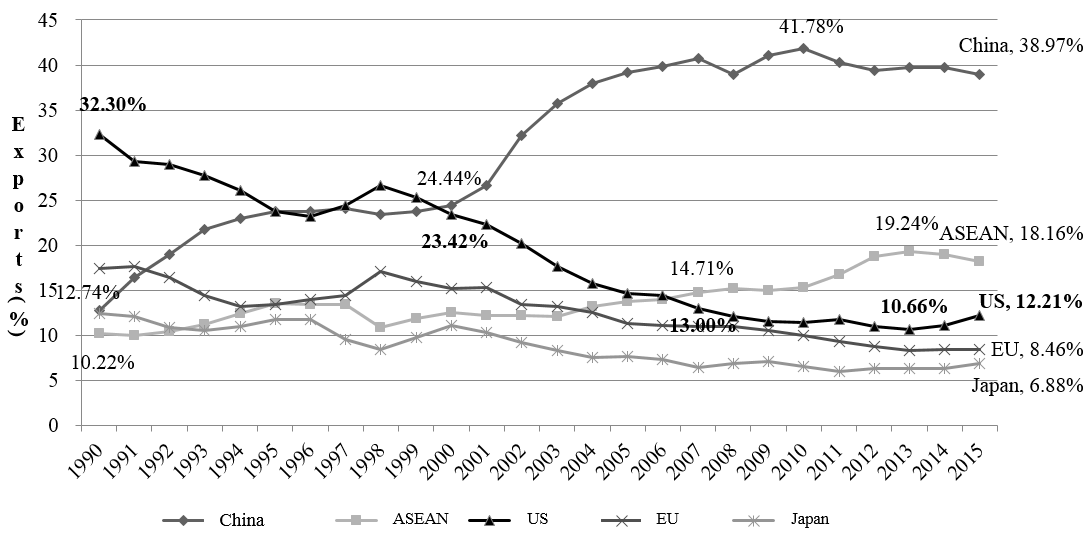
Asia’s emerging economies, including China and ASEAN member nations, have been able to leverage their advantages (including cheap labor and large domestic markets) to attract foreign investment from all over the world (including from Taiwan), which is probably the major factor behind the weakening of the Taiwan-U.S. trading relationship. In regards to exports, many Taiwanese manufacturers have relocated their production lines from Taiwan to China or Southeast Asia, with finished products being exported from these overseas production locations to Europe and North America. Consequently, for many product categories, direct exportation from Taiwan to Europe and North America has been replaced by a “triangular trade” model in which materials are shipped from Taiwan to China or Southeast Asia for processing, and finished products are then shipped to Europe and North America from China or Southeast Asia. Figure 1 shows the change over time in the share of Taiwan’s total exports going to key export markets. It can be seen from this figure that there has been a steady rise in the share of Taiwan’s total exports held by exports to China (including Hong Kong) and to ASEAN. The share of Taiwan’s total exports going to China (including Hong Kong) rose from 12.74 percent in 1990 to 41.78 percent in 2010, an increase of 29.05 percentage points. From 2010 onwards, the increase in the share of total exports going to China became less pronounced, mainly because Taiwanese manufacturers of LCD panel and related products faced increasingly intense competition from South Korean and Chinese manufacturers. Since 2010, the share of total Taiwanese exports going to China has either risen only very slowly, or in some years actually fallen (as in 2015). The share of total Taiwanese exports going to the ASEAN member states rose from 10.22 percent in 1990 to 19.24 percent in 2013, an increase of 9.02 percentage points; however, since 2013 there has been a slight decline, mainly caused by a fall in exports of refined petroleum products from Taiwan to Southeast Asia due to decreased international oil prices.
Related Books
The fall in the share of Taiwan’s total exports held by exports to the United States, European Union and Japan has been significant, with the decline most pronounced for U.S. exports. In 2000, the United States was overtaken by China as a market for Taiwan’s exports and then by ASEAN in 2007. By 2013 the share of total Taiwanese U.S.-bound exports had dropped to 10.66 percent. Since 2013, there has been a slight increase, possibly related to U.S. efforts to revitalize its manufacturing sector (sometimes referred to as the “reindustrialization” policy), which has boosted American domestic demand. Therefore, the share of overall Taiwanese exports increased to 12.21 percent in 2015.
Figure 1: The change in the share of Taiwan’s total exports going to selected key export markets, 1990 – 2015
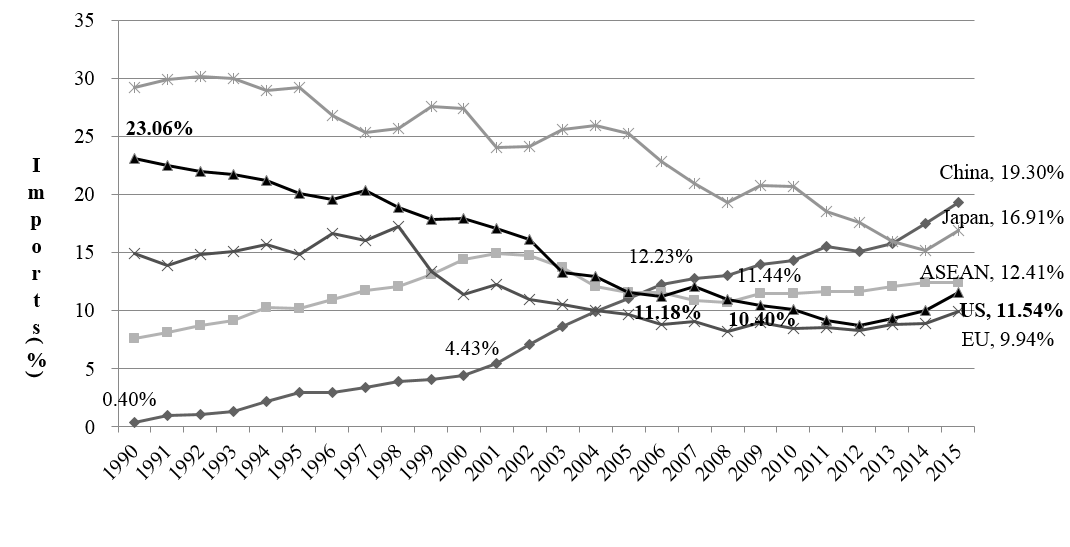
In terms of imports, Figure 2 shows the changes in Taiwan’s total imports held by imports from specific key sources. The graphs make apparent that China has become a steadily more important source of imports for Taiwan in recent years, with the share of Taiwan’s total imports deriving from China rising from 0.40 percent in 1990 to 19.30 percent in 2015. China has been able to secure the capital and technology from all over the world by offering cheap land (for factory construction) and cheap labor, while extensive government support has also helped Chinese industry to grow rapidly. With the range of Chinese export products growing wider, and with these products generally being characterized by low prices, markets such as Taiwan’s have been overrun by Chinese imports. By 2014, China had become Taiwan’s single largest source of imports. Additionally, by 2014 there were 14 other countries, besides Taiwan, where China was the largest source of imports, including large economies such as Japan, Australia, the United States, Russia, and South Korea.
The share of Taiwan’s imports deriving from ASEAN member states has risen steadily, except for two temporary dips in 2001 and 2008. The shares of total imports held by imports from the United States, Japan and the European Union fell steadily for some time, before starting to pick up again recently. In all three cases, the share of Taiwan’s total imports started to rise again around 2012. The share of total imports deriving from the United States rose from 8.72 percent in 2012 to 11.54 percent in 2015, while Japan’s share increased from 15.98 percent to 16.91 percent over the same period, and the European Union’s share increased from 8.31 percent in 2011 to 9.94 percent in 2015. This trend is mainly attributable to the fall in international oil prices in recent years, which has resulted in a decline in the value of Taiwan’s petroleum imports from oil exporters like Saudi Arabia and Kuwait.
Figure 2: The change in the share of Taiwan’s total imports deriving from selected key countries, 1990 – 2015
We could further break up U.S. and Taiwan’s exports into various value-added components by country. As different stages of production are regularly taking place in different countries, intermediate inputs cross borders multiple times. As a result, traditional trade statistics cannot reflect the value contributed by any specific country. Table 3 and Table 4 trace value added of U.S. and Taiwan exports by country and could help us to measure vertical specialization in trade. As we can see from the tables, the valued-added of U.S. exports in the United States has declined since 1995, but increased slightly from 2005 to 2011. Taiwan only contributed a tiny share of U.S. exports in value added. As for Taiwan’s exports, the value added in Taiwan has declined significantly since 1995. The United States contribution to Taiwan’s export also decreased from 4.27 percent in 1995 to 2.60 percent in 2011.
| Year | U.S. | Taiwan | China | Korea | Japan | EU | Other |
| 1995 | 81.75% | 0.34% | 0.30% | 0.41% | 2.22% | 2.25% | 12.73% |
| 2000 | 77.75% | 0.35% | 0.49% | 0.39% | 1.67% | 2.30% | 17.05% |
| 2005 | 78.94% | 0.21% | 0.91% | 0.31% | 1.05% | 2.53% | 16.05% |
| 2008 | 77.85% | 0.17% | 1.37% | 0.28% | 0.95% | 2.67% | 16.71% |
| 2009 | 82.52% | 0.15% | 1.17% | 0.25% | 0.71% | 2.19% | 13.01% |
| 2010 | 80.25% | 0.17% | 1.33% | 0.29% | 0.83% | 2.19% | 14.94% |
| 2011 | 78.95% | 0.16% | 1.48% | 0.30% | 0.80% | 2.31% | 16.00% |
| 1995-2005 difference | -2.81% | -0.13% | 0.61% | -0.1% | -1.17% | 0.28% | – |
| 2005-2011 difference | 0.01% | -0.05% | 0.57% | -0.01% | -0.25% | -0.22% | – |
Source: Calculated from “OECD Inter-Country Input-Output (ICIO) Tables, edition 2015,” (http://www.oecd.org/sti/ind/input-outputtablesedition2015accesstodata.htm).
| Year | Taiwan | US | China | Korea | Japan | EU | Other |
| 1995 | 68.54% | 4.27% | 0.75% | 1.26% | 8.38% | 3.96% | 5.22% |
| 2000 | 66.43% | 4.33% | 1.02% | 1.57% | 7.55% | 3.35% | 5.23% |
| 2005 | 60.90% | 2.86% | 2.34% | 1.57% | 5.99% | 3.10% | 8.45% |
| 2008 | 53.96% | 2.68% | 3.46% | 1.16% | 4.88% | 2.93% | 12.68% |
| 2009 | 60.52% | 2.43% | 3.28% | 1.19% | 4.82% | 2.67% | 9.76% |
| 2010 | 56.34% | 2.68% | 3.46% | 1.38% | 5.34% | 2.78% | 10.45% |
| 2011 | 54.55% | 2.60% | 3.91% | 1.31% | 4.94% | 2.87% | 11.61% |
| 1995-2005 difference | -7.64% | -1.41% | 1.59% | 0.31% | -2.39% | -0.86% | 3.23% |
| 2005-2011 difference | -6.35% | -0.26% | 1.57% | -0.26% | -1.05% | -0.23% | 3.16% |
Source: Calculated from “OECD Inter-Country Input-Output (ICIO) Tables, edition 2015,” (http://www.oecd.org/sti/ind/input-outputtablesedition2015accesstodata.htm).
The Outlook for the Future
With the global trend in recent years moving towards regional economic integration, countries have been competing to negotiate FTAs. The changes in global trade relationships and the restructuring of the global economy that have resulted from this trend have had far-reaching consequences. In Asia, the pace of regional integration has been very rapid, and the impact on Taiwan – which is heavily dependent on trade with other parts of the East Asia region – has been significant. In the past, China’s opposition and obstructionism has prevented Taiwan from participating fully in the process of regional economic integration, which has had a severe impact on Taiwan’s economic development. Although the Taiwanese government has positioned membership in the Trans-Pacific Partnership (TPP) and the Regional Comprehensive Economic Partnership (RCEP) as key priorities, there has been little in the way of substantial progress for either agreement. The RCEP trade negotiations are scheduled for completion in 2016–2017, while the TPP agreement was signed on February 4, 2016, but its future is still in question as key signatories, i.e. the United States, have yet to ratify.
In the case of the TPP agreement, while on the face of it Taiwan’s total exports appear to amount to only a relatively small share (around 2–3 percent) of the total exports of the twelve existing TPP member economies, in reality Taiwan plays a very important role as a supplier of intermediate goods and components within the Asia-Pacific region. And, in many industries Taiwan has a close trading relationship with TPP member economies, making it a key partner within the TPP members’ production networks. For example, for many product categories in the fabricated metal products, textile, automotive, machinery, iron and steel, and electromechanical machinery industries, 10 percent or more of the intermediate goods needed by U.S. manufacturers are imported from Taiwan. Further, the industrial relationship between Taiwan and the United States is thus still a very close one. If Taiwan finds itself excluded from the TPP, not only will this have a negative impact on U.S.-Taiwan trade relations, it will also affect Taiwan’s overall foreign trade as the restructuring of international supply chains could have serious negative consequences for Taiwan.
In light of the above, Taiwan is faced with the question of how it can maintain growth, both in its trade with the United States and in its overall foreign trade. Besides working to enhance the quality and competitiveness of Taiwan products, securing membership of large-scale FTAs is also a key issue. Given the broad scope of areas addressed by the TPP, Taiwan will need to be prepared to make adjustments in terms of market openness, legal and regulatory transparency, and systemic reform.
A particularly important point is that, when applying to secure membership of the TPP or other regional trade agreements in the future, Taiwan will need to engage in bilateral trade talks with member economies and meet the conditions set by these members. And, Taiwan will only be able to secure their support if it is willing to resolve existing trade disputes. Taking the United States as an example, Taiwan has yet to develop a concrete solution to the issue of market opening in the agricultural sector. Whether Taiwan is willing to open up its market to imports of U.S. pork and beef products will have a particularly pronounced impact on the success or failure of Taiwan’s negotiations with the United States regarding accession to the future trade agreements. For example, the TPP agreement requires a high level of transparency in sanitary and phytosanitary standards (SPS) and in technical barriers to trade (TBT); there must be no discrimination, and inspection and quarantine measures must be based on sound scientific reasoning. In the case of U.S. beef and pork, however, Taiwan has always insisted that they be subject to separate treatment, failed to offer adequate scientific grounds for this separate treatment, and been unable to offer a roadmap towards market opening that is acceptable to the U.S. government.
The cross-Strait relationship between Taiwan and China will also affect Taiwan’s efforts to secure membership of the TPP. Although China is not itself a member of the TPP, out of the 12 TPP member economies, Brunei is the only economy that does not have China as either its largest or second-largest trading partner. It can therefore safely be assumed that China will be able to exert considerable influence over whether Taiwan is granted membership. To secure membership of a potential TPP, Taiwan will need to successfully complete bilateral trade talks with each individual member. Given that all of the existing TPP members have formal diplomatic relations with China (which they do not have with Taiwan), when faced with Taiwan’s application, they are bound to consider not only whether Taiwan is really ready for TPP membership, and the attitude taken by the United States towards Taiwan’s application, but also whether China is opposed to Taiwan membership. Given the deterioration in relations between Taiwan and China since the new administration took office in Taiwan in May 2016, managing relations with China will be a key challenge for Taiwan in regard to its efforts to secure accession to the TPP and other regional trade agreements.
Conclusion
Taiwan’s trading relationship with the United States has had its ups and downs, mainly due to external factors. Nevertheless, United States has continued to be an important trading partner for Taiwan. This relationship is especially important with respect to Taiwan’s efforts to secure greater participation in global and regional economic integration, particularly Taiwan’s attempts to achieve membership of the TPP. Taiwan still has many bilateral trade issues that will need to be resolved if it is to secure accession to the TPP or negotiate other regional or bilateral agreements; the successful resolution of these issues is also key to the continued growth of trade between Taiwan and the United States, and to Taiwan’s maintenance of an important position within global supply chains.
Related Content


The Brookings Institution is committed to quality, independence, and impact.
We are supported by a diverse array of funders. In line with our values and policies, each Brookings publication represents the sole views of its author(s).


Commentary
Op-edThe trading relationship between Taiwan and the United States: Current trends and the outlook for the future
November 2016