The original commentary was first published by World Data Lab on January 20, 2026, and is posted here with permission. A German-language version appeared on Der Standard. Separate editorial contentsubsequentlyappeared inThe Economist’s“Graphic Detail” feature on February 3, 2026.
Now that the 2026 World Economic Forum Annual Meeting in Davos has concluded, the topic of inequality remains at the center of global policy conversations. A tiny group of half a million ultra-high net worth individuals—those with more than $30 million in assets, many of whom were in attendance at Davos—now manages $60 trillion of wealth. The last few years have been particularly kind to this group, and they dominate holdings of the AI businesses that are driving global economic growth. A key question emerging from Davos is whether there will be enough demand for goods and services in a global economy where wealth is so concentrated.
The World Data Lab has compiled a global database of 194 countries and economies to look into this question. The database draws on income and consumption distribution data from every country in the world, with modeled distribution used where national statistical offices’ surveys are unavailable. Compiling and harmonizing this information across diverse contexts is a complex undertaking. Others, notably the World Inequality Report prepared by Thomas Piketty and colleagues, do the same. For all these exercises, judgments need to be made on the indicator of interest (consumption or income, before tax or after, non-income variables), on how to compare across countries and over time, adjust for price differentials, and on how to fill in missing data. Also, there are many indicators of inequality from which to choose: the Gini coefficient, the Theil index, or a modified Palma ratio, to name a few commonly used by economists.
When comparing the various options, a striking pattern emerges. Although one might bemoan the level of inequality (and it is hard to benchmark what an appropriate level might be), the main trend is a sharp decline in global inequality in the twenty-first century. This is particularly clear for inequality of consumption—a preferred measure—as consumption can be observed more reliably than income in low-income economies, and it is consumption that shapes the policy question of the adequacy of consumer demand in the global economy. In 2000, the average consumption of the top 10% of the world population was around 40 times that of the bottom 50%. Twenty years later, in 2020, this ratio had fallen to roughly 20 times, and it declined further to 18 times in 2025. Projections suggest the declining trend of global inequality will continue. The new millennium has, therefore, been characterized by a substantial reduction in global inequality, although disparities within and across countries persist.
Figure 1. Global spending inequality has been declining sharply
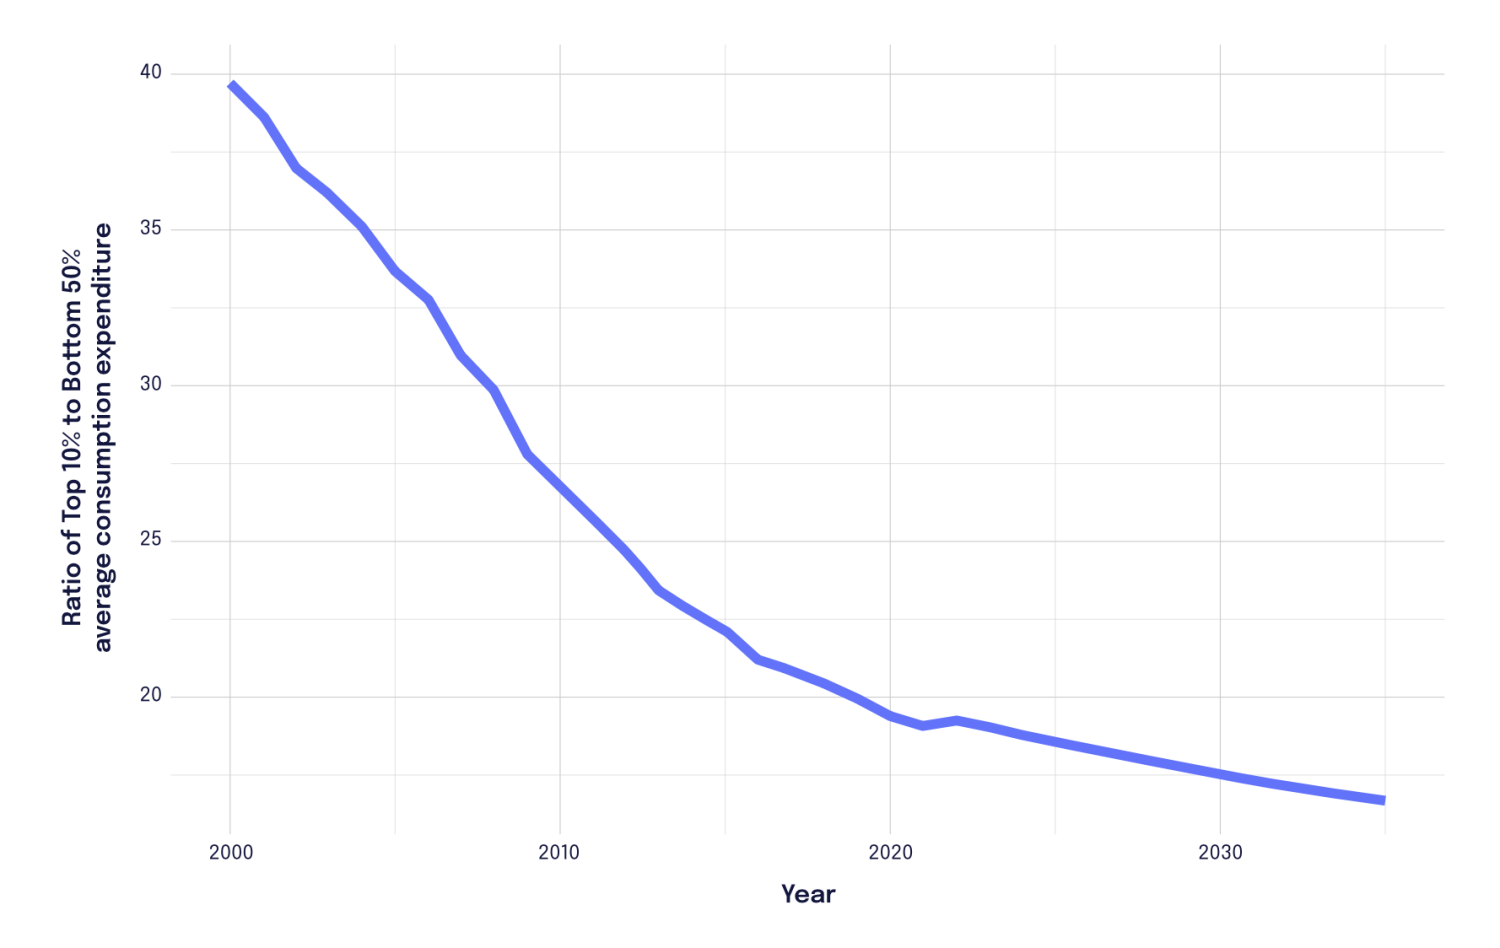
Note: Top 10% bottom 50% consumption expenditure ratio, 2000 to 2035, projections from 2025; Source: World Data Lab
This finding results from the interaction between the two forces that shape changes in the worldwide distribution of income and consumption: convergence of average incomes between countries and changes in the distribution of income within nations.
The first force, the change in incomes between countries, has been an equalizing force. First China, and now India, have seen far more rapid growth this century than the growth rate in advanced economies. The same applies to large parts of South East Asia and Eastern Europe. Together, almost half the world has benefited from rapid economic growth and lives in countries where living standards are converging with those in the United States and other advanced economies. To give one example, average consumption in India in 2000 was roughly sixteen times lower than in the United States. Today, it is only eight times lower.
The second major force is the change in inequality within countries. Here, the pattern is mixed. In some countries, inequality has worsened, while in others it has improved. For example, the share of the top 10% earners in total consumption expenditures fell from about 40% to 35% in India between 2000 and today, while in the United States it rose from 31% to 33% over the same period. Averaged across the world, the within-country component of global inequality has remained approximately constant since 2000.
Some measures of inequality permit an exact mathematical decomposition into the between-country and within-country components. In 2000, differences in average incomes across countries accounted for approximately 70% of global inequality. Since then, convergence in living standards between countries has steadily reduced this component of consumption inequality, and our current projections indicate that this reduction will continue in the coming decade. At the same time, inequality within countries has become relatively more important and is projected to account for more than half of global inequality by the mid-2030s.
Figure 2. Within country spending inequality now accounts for more than 50% of global inequality
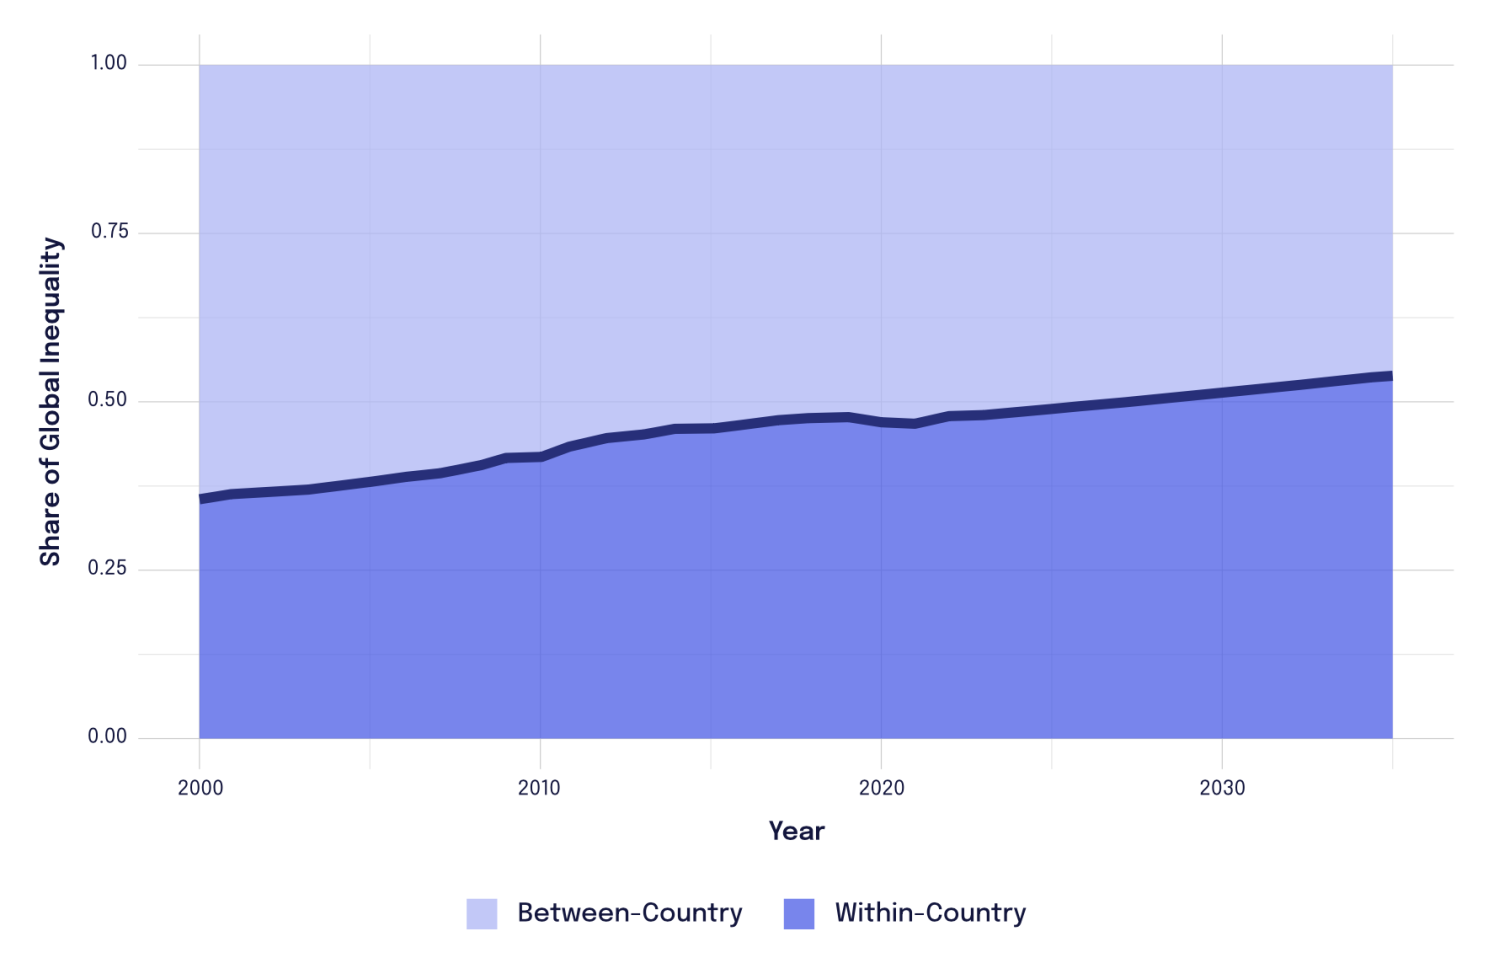
Note: Global inequality, decomposition to between-country and within-country; Source: World Data Lab
The good news is that lower global inequality means that global growth is increasingly benefiting the poorest people on the planet. The share of global consumption expenditure of the world’s poorest 50% increased from a meager 7% in 2000 to a still-low 12% in 2025. And despite the rise in wealth, the share of global consumption expenditure of the top 1% has steadily fallen over this same period. As a result, while just a few years ago the share of global consumption enjoyed by the top 1% was about equal to the share for the bottom 50%, there is now a distinct and growing gap between the two.
This aggregate trend conceals some significant differences in lived experiences across the world. The bottom 50% numbers over 4 billion today, and not everyone has benefited to the same degree. In some of the poorest countries in Africa, Afghanistan, Yemen, Venezuela, Iran, Haiti, and North Korea, poor people have not seen any significant trickle-down. According to the World Bank, about 10% of the world’s population is still living in extreme poverty1, with daily per capita consumption of less than $3. And tragically, the rate of decline of global poverty, one of the great success stories of globalization over the last 35 years, has come to a halt. However, in most of the countries where poverty persists, problems stem from too little economic growth rather than the worsening of inequality, although the elites there often take the lion’s share of whatever wealth is generated in the economy.
Figure 3. The spending of the bottom 50% has overtaken the spending of the richest 1%
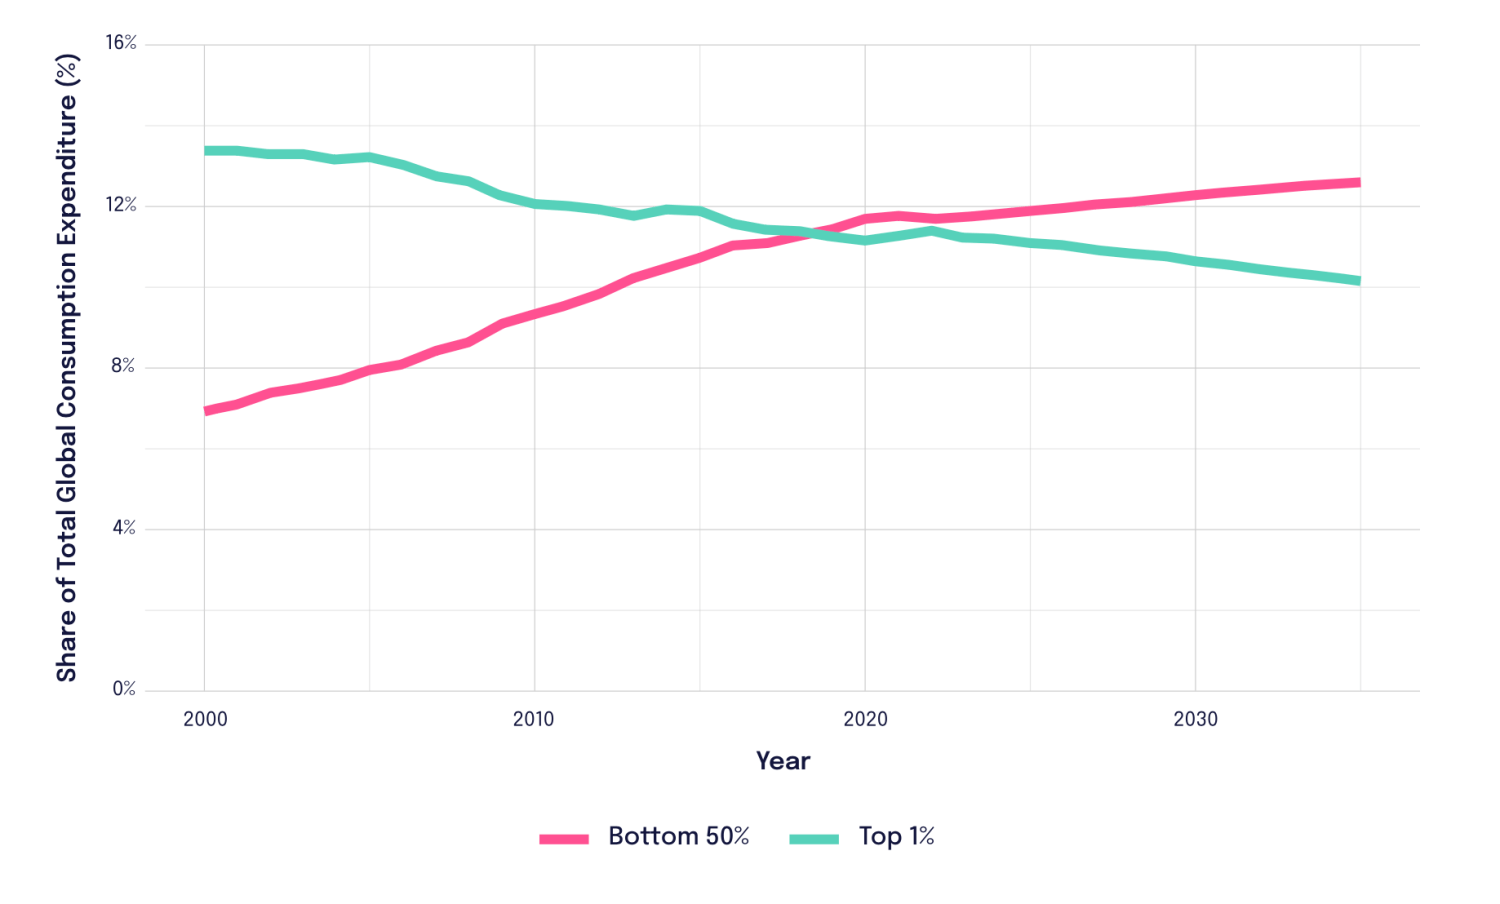
Note: Share of global consumption, bottom 50% and top 1%; Source: World Data Lab
The biggest risk factor for global inequality, then, is whether an increasingly fragmented global economy could weaken the reduction in between-country inequality that has been the major driver of improvement in this century. Current geopolitical tensions directly affect the very channels that have been central to convergence over recent decades, including trade integration, investment flows, and technology transfer. All of these mechanisms are currently under strain, dangerously raising the risk that the recent trend toward equalization in living standards may come to an abrupt end.
If that happens, it will be the global middle class that will lose the most. The middle class, that is, the 40% of the global population that is not in the top 10% or the bottom 50%, is now, for the first time in history, the group that consumes the most. Business leaders at Davos, worried about where demand will come from in a world where billionaires are getting richer and richer, should worry about trends in the middle class. The middle class will only keep growing if globalization facilitates the forces of convergence. That would be good for economic growth and would simultaneously reduce the inequality in global consumption.
Figure 4. The middle class has also been gaining
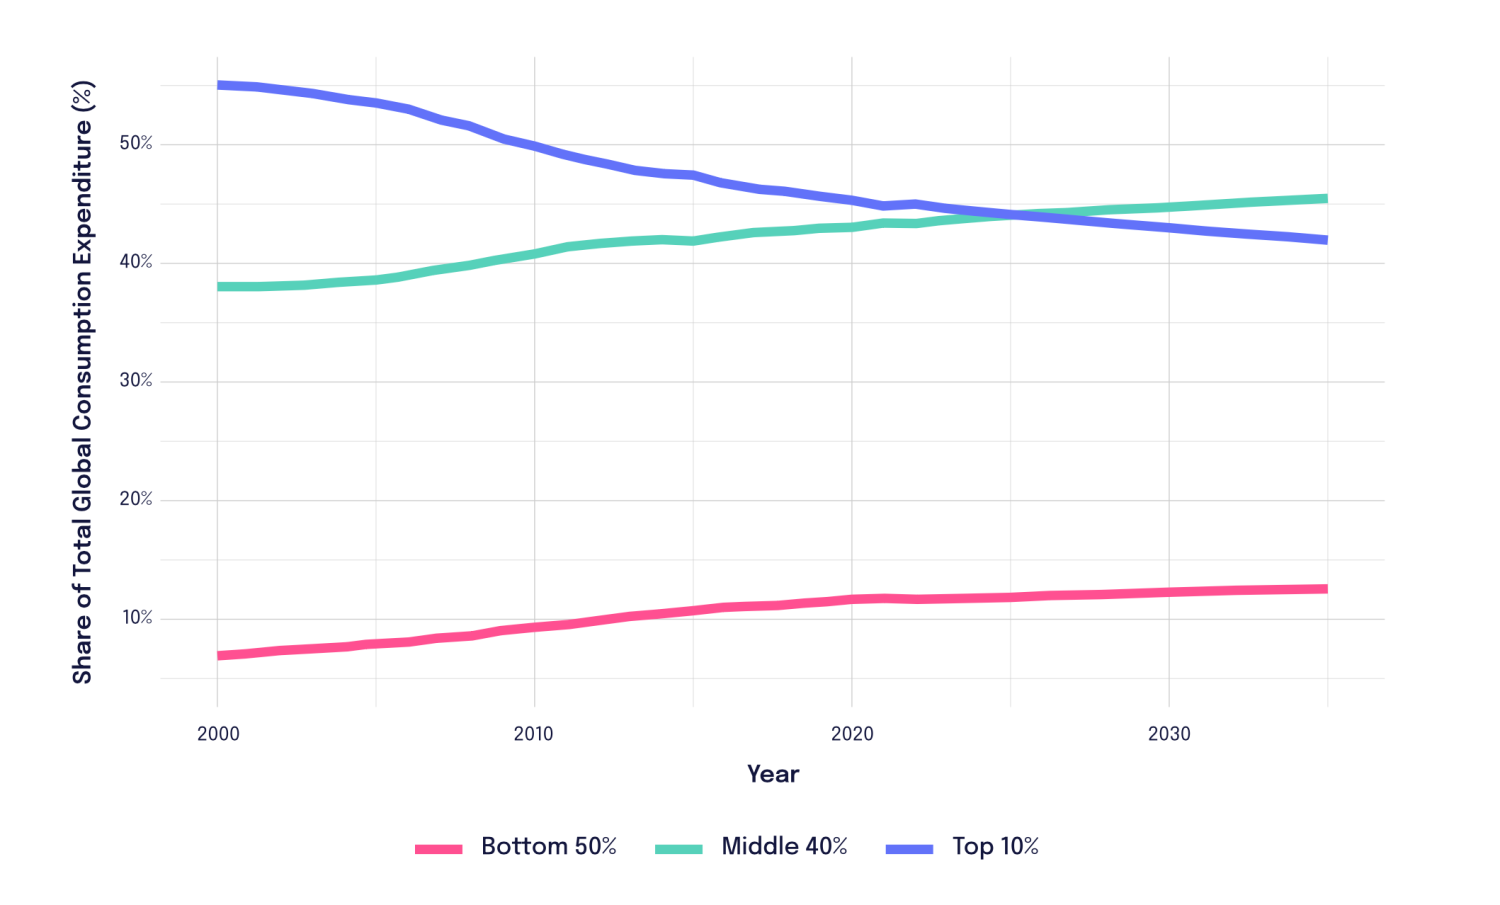
Note: Share of total world consumption, bottom 50%, middle 40% and top 10%; Source: World Data Lab
Authors


-
Acknowledgements and disclosures
The version published here has been lightly edited for style to align with Brookings editorial standards.
Authors of this commentary provide academic expertise through World Data Lab, including its non-profit division. Data from the World Data Lab mentioned in this post are all publicly available to other researchers. For questions on the data, please contact Sourav Suman at [email protected].
-
Footnotes
- Poverty and Inequality Platform, World Bank: https://pip.worldbank.org/poverty-calculator
The Brookings Institution is committed to quality, independence, and impact.
We are supported by a diverse array of funders. In line with our values and policies, each Brookings publication represents the sole views of its author(s).


Commentary
The present and future of global inequality
February 11, 2026