Scientists and engineers are critical for technological leadership, and therefore essential for U.S. economic strength, national defense, and quality of life. Congressional policy makers are concerned whether the number of science and engineering (S&E) professionals in the U.S. workforce are sufficient to meet the demands of the market. In February 2014, the Congressional Research Service (CRS) published a report, “The U.S. Science and Engineering Workforce: Recent, Current, and Projected Employment, Wages, and Unemployment,” which offers statistics that illustrate the state of the S&E workforce.
The CRS uses key indicators like employment growth, wage growth, and unemployment rates to gauge workforce shortages. The latest Occupational Employment Statistics available are from 2012.
Science and Engineering Workforce in 2012
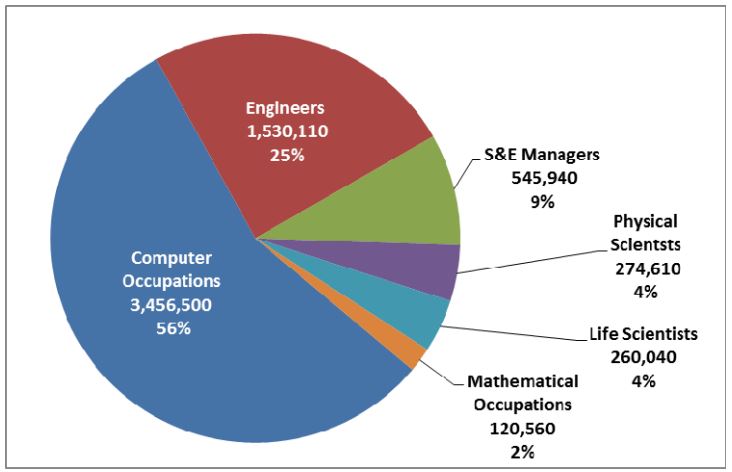
In 2012, there were 6.2 million scientists and engineers. The two most popular occupations among S&E are computer workers and engineers. See below for more details.
Compilation of S&E Occupational Employment, 2012
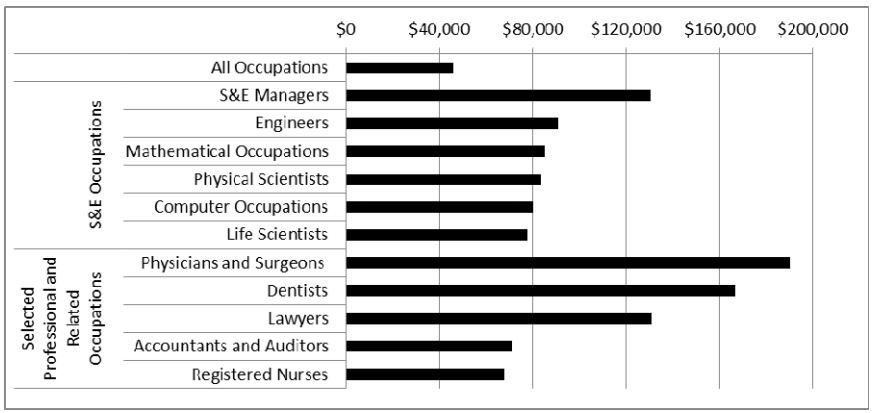
As shown below, those in S&E fields have a higher mean annual wage than those in all other occupations. The median annual wage for all scientists and engineers was $87,330 and the median income for all other occupations was $45,790.
Mean Annual Wages of S&E Occupational Groups and Other Professional Occupations, 2012
Science and Engineering Workforce change from 2008-2012
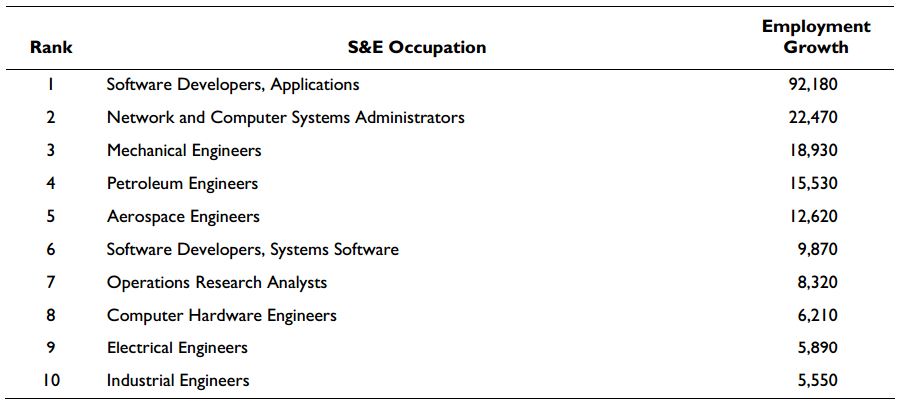
From 2008 to 2012, aggregate S&E employment rose from 5.8 million to 6.2 million. Despite the Great Recession, S&E employment increased while the overall US employment decreased.
S&E Occupations with the Largest Employment Growth, 2008-2012
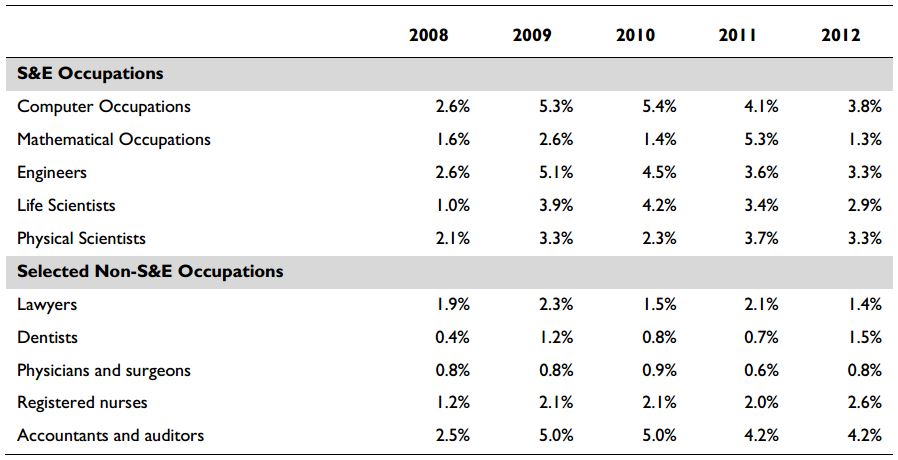
Historically, the professional workforce (including S&E occupations) has experienced lower unemployment rates compared to the overall workforce. Below are the unemployment rates for all workers (16 years and older) in addition to select professional occupations from 2008-2012.
Unemployment Rates for S&E Groups, the Overall Workforce, and Other Selected Professional and Related Occupations, 2008-2012
Future of Science and Engineering Workforce
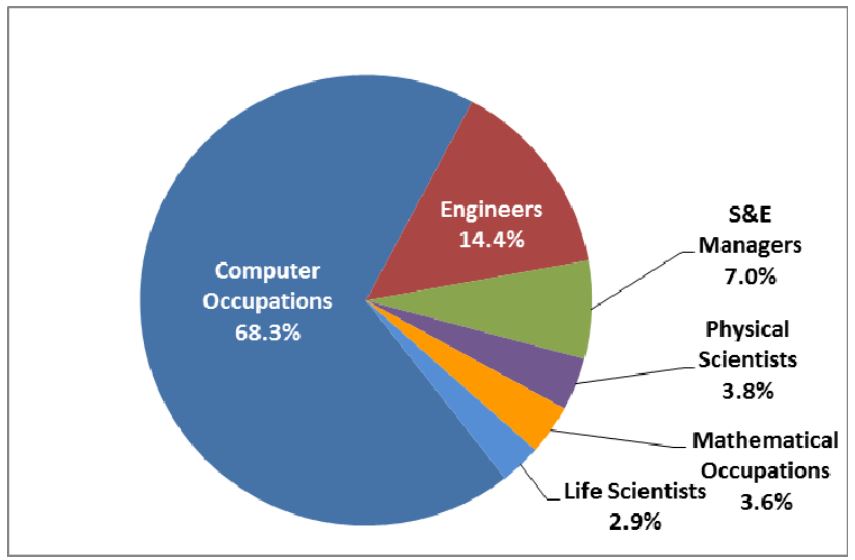
The Bureau of Labor Statistics (BLS) projects that the number of S&E jobs will grow by 953,200 between 2012 and 2022.
Share of Total Projected S&E Occupational Job Growth, 2012-2022 by S&E Occupational Group
There is still debate as to whether there is a shortage of S&E professionals or if there is inefficiency in job placement- mismatched skills and needs. Regardless of if there is a shortage or not, the United States needs to do more to develop the S&E workforce.
CRS proposes several ways Congress can strengthen the S&E Workplace:
- increasing the number of students pursing S&E degrees;
- increasing the number of foreign scientists and engineers admitted to the U.S.
- increasing the number of underrepresented minorities and women in S&E
- improving K-12 STEM education; and
- improving career information and counseling for high school students.
Source: John F. Sargent Jr.“The U.S. Science and Engineering Workforce: Recent, Current, and Projected Employment, Wages, and Unemployment.” Congressional Research Service. Read the full report here.
To learn more about unemployment, check out Darrell West’s paper, “The Paradox of Worker Shortages at a Time of High Unemployment” where he explores worker shortages in the agriculture, health care, manufacturing, and technology fields.
The Brookings Institution is committed to quality, independence, and impact.
We are supported by a diverse array of funders. In line with our values and policies, each Brookings publication represents the sole views of its author(s).


Commentary
The Importance of the Science and Engineering Workforce for Future Growth
April 23, 2014