

This post updates with complete year-end 2024 data the External Wealth of Nations database [Excel download], which assembles data on external claims and liabilities of economies around the world. The database is described in more detail in a series of papers (Lane and Milesi-Ferretti 2001, 2007, 2018), and in a companion post. The data are annual for the period 1970-2024 and cover 212 countries and territories, plus the euro area and the Eastern Caribbean Currency Union (ECCU). The updated dataset also includes an estimate of gold holdings held as foreign reserves.
Global net creditor and debtor positions widened further in 2024 as a share of global GDP (Figure 1).
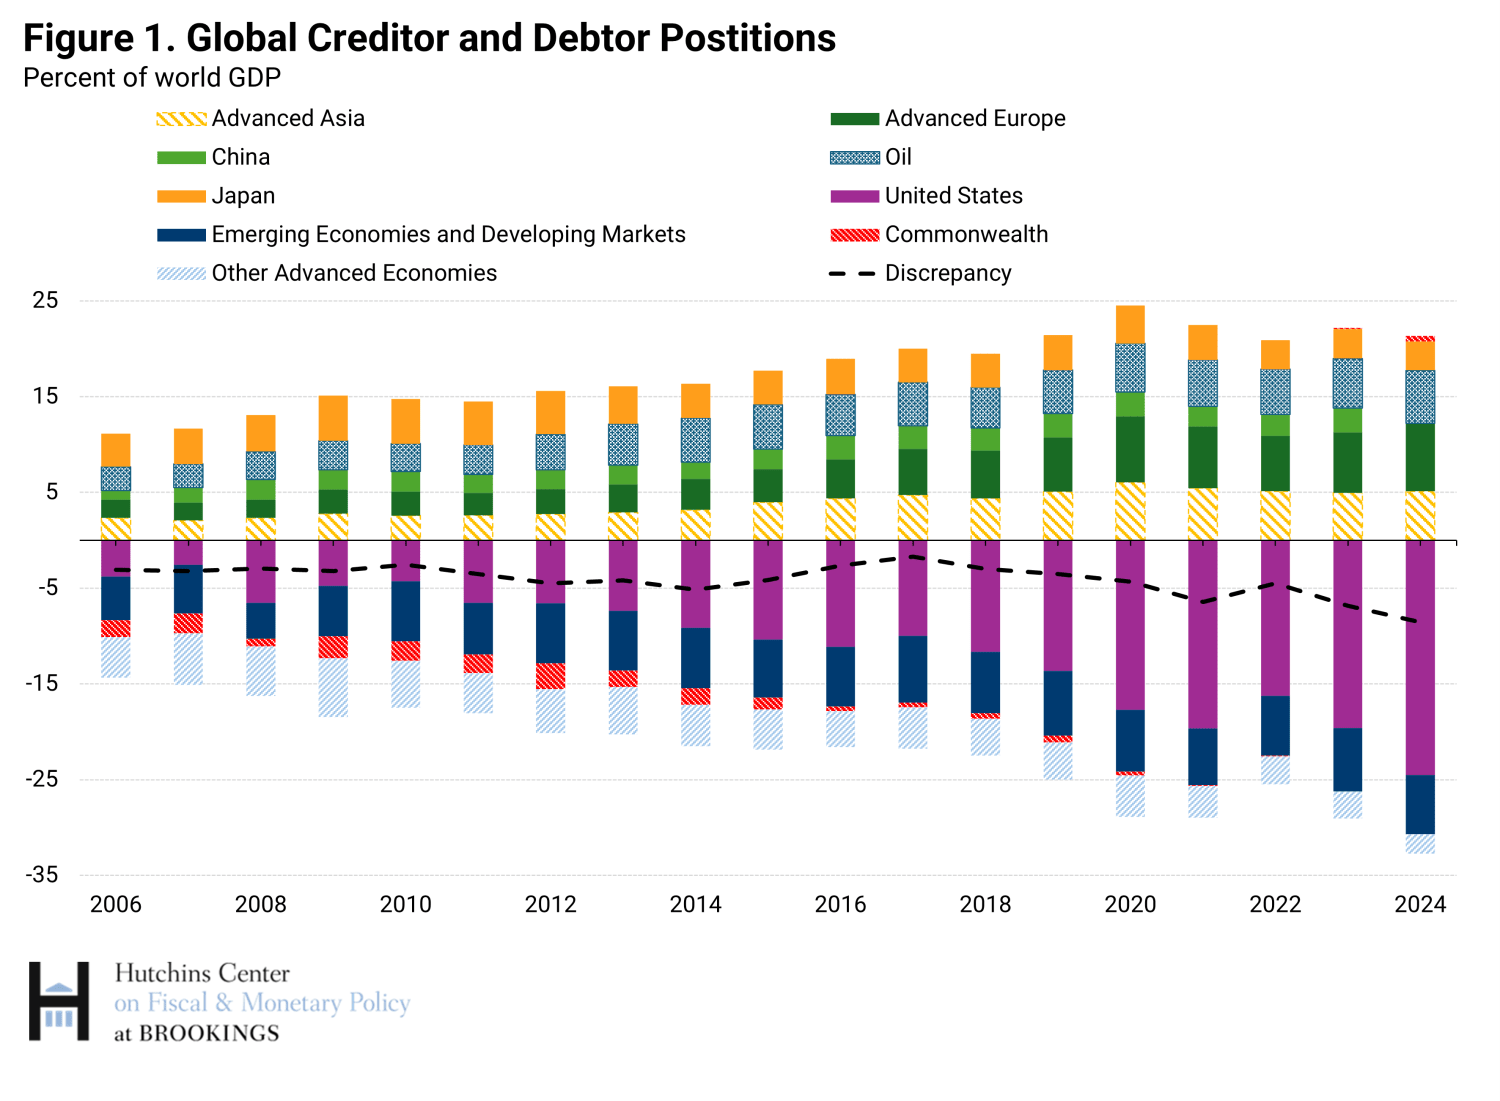
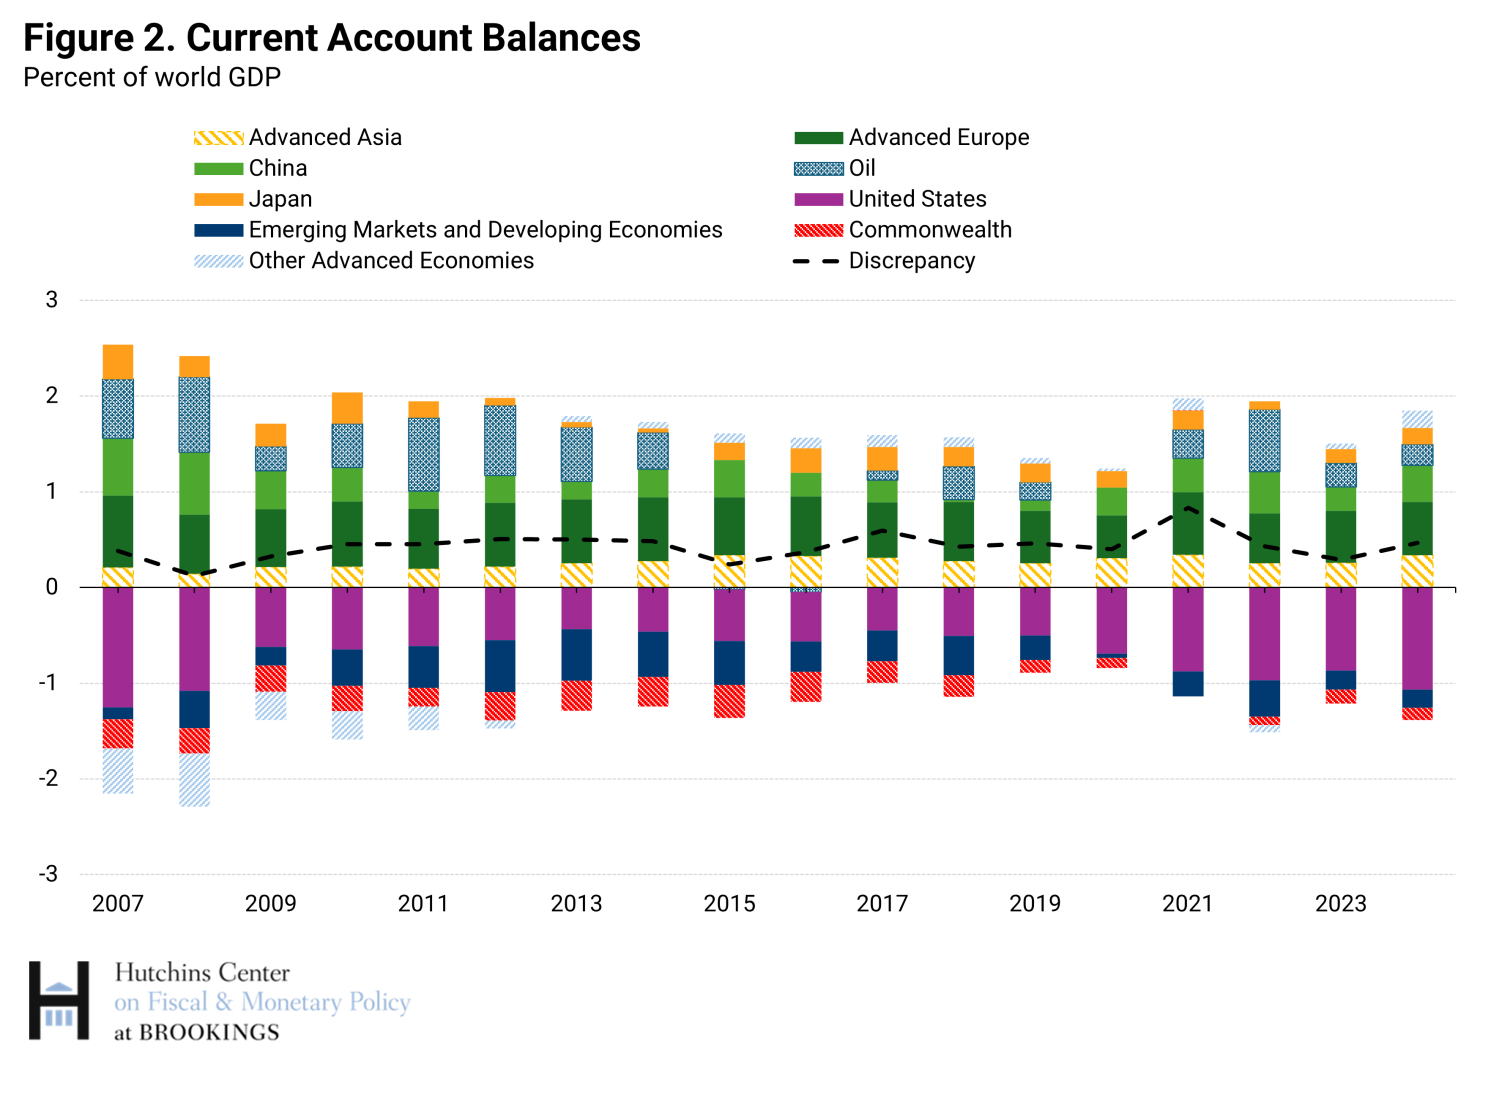
An increase in net borrowing and lending across the main countries and regions contributed to this widening (Figure 2), but the main factors at play were changes in valuation of external assets and liabilities.
These changes were triggered by higher global stock prices and exchange rate changes. Higher global stock prices increase the net creditor position of countries that hold large positions in foreign equities (for instance, countries with sizable sovereign wealth funds or institutional investors such as pension funds), and conversely worsen the external position of countries that are important destinations for foreign equity investment and experienced large gains in domestic stock prices. As for exchange rate changes, most large creditors and debtors have a net creditor position in foreign currency instruments and a net liability position in domestic currency instruments (most assets are denominated in foreign currency, and most liabilities in domestic currency). Hence an appreciation reduces the domestic-currency value of foreign assets and worsens the external position.
The United States is a good example. Its net external debtor position estimated at market value, excluding gold, widened by about $6 trillion (17.5% of GDP) between the end of 2023 and the end of 2024 to $27.2 trillion. Three factors are responsible. One, net borrowing from abroad (financing the current account deficit) was around $1.1 trillion. Two, appreciation of the dollar reduced the dollar value of its foreign-currency assets by about $1 trillion. And three, U.S. stock prices rose by close to 20% while foreign stock prices increased by about 6% (with much of that gain for U.S. investors offset by dollar appreciation). The lion’s share of the deterioration in the net external position (close to $4 trillion of the $6 trillion) indeed reflects changes in asset prices.
Table 1 provides a snapshot of large changes in external positions in 2024 across selected countries and regions.
In absolute terms, the euro area had the largest improvement in the net external position: the euro depreciated by 6% against the dollar between end-2023 and end-2024, and U.S. stock prices rose substantially more than euro area stock prices during the same period. The behavior of stock prices also helps explain the increase in net creditor positions in advanced Europe and Middle East oil exporters. Some individual country details are also interesting. Norway benefited from rising equity values in its very large sovereign wealth fund, whose assets were over $1.7 trillion at end-2024. In Denmark, a 14% decline in its stock prices in U.S. dollars contributed to a sizable reduction in its portfolio equity liabilities. The decline in prices of its pharmaceutical company Novo Nordisk, by far the largest Danish company, played an important role.
Canada is also interesting. Despite running a current account deficit in 2024, it saw a large increase in its net assets. The lion’s share of Canada’s assets is in U.S. dollars and invested in the United States, while many of its liabilities are denominated in Canadian dollars. The 8% depreciation of the Canadian dollar relative to the U.S. dollar, coupled with large stock price increases in the U.S., explain its large valuation gains.
Among countries experiencing valuation losses, an interesting case is Taiwan, where again stock prices played a key role. Despite running a 14% current account surplus, Taiwan experienced a decline in its net external assets exceeding 20% of GDP. The main reason was the almost doubling of the stock market price of TSMC, its gigantic producer of semiconductor chips, implying an increase in TSMC’s market capitalization of almost $500 billion. This caused a large increase in the value of foreign holdings of Taiwan stocks, given the importance of international investors among TSMC’s shareholders.
When assessing these changes, keep in mind that net external claims are only part of a country’s national wealth. A stock market boom raises domestic wealth, even though some of the gains accrue to foreign investors, and vice versa for a crash.
Finally, a note of caution on U.S. figures. The headline estimates by the U.S. Bureau of Economic Analysis (BEA) of U.S. external assets and liabilities include a valuation of foreign direct investment in the U.S. tied to U.S. stock prices. But rising U.S. stock prices over the past decade were primarily driven by tech companies, while foreign direct investment is more important in sectors such as auto, chemicals, and finance. Hence these valuations likely overstate U.S. FDI liabilities. An alternative valuation of FDI claims and liabilities based on the current cost of affiliates (with no stock price adjustment) also published by the BEA would reduce the deterioration in the U.S. position in 2024 to about $4 trillion, more in line with the improvement in creditor positions elsewhere shown in Table 1.
Finally, how are things likely to have evolved in 2025? As of end-September, the U.S. net external position has worsened by another $1.1 trillion relative to end-2024, roughly the amount of net borrowing during the first 3 quarters of the year.1 While asset prices and exchange rates moved favorably for the U.S. external position—equity prices rose more outside the U.S. than in the U.S., and the U.S. dollar weakened—the much larger size of external liabilities relative to assets implied that, in absolute terms, valuation effects canceled out. Creditor positions in countries with large net equity claims have also risen further, while countries with an appreciating currency and/or a large negative portfolio equity position will have seen a worsening of their position.
International financial integration
With rising geopolitical tensions, there is growing interest in their repercussions for international financial flows and investment patterns (see, for instance, the 2025 Geneva Report). The database also allows us to examine the global evolution of gross cross-border positions over time. As shown in Figure 3, global liabilities have risen slightly between the end of 2023 and the end of 2024 as a share of global GDP.
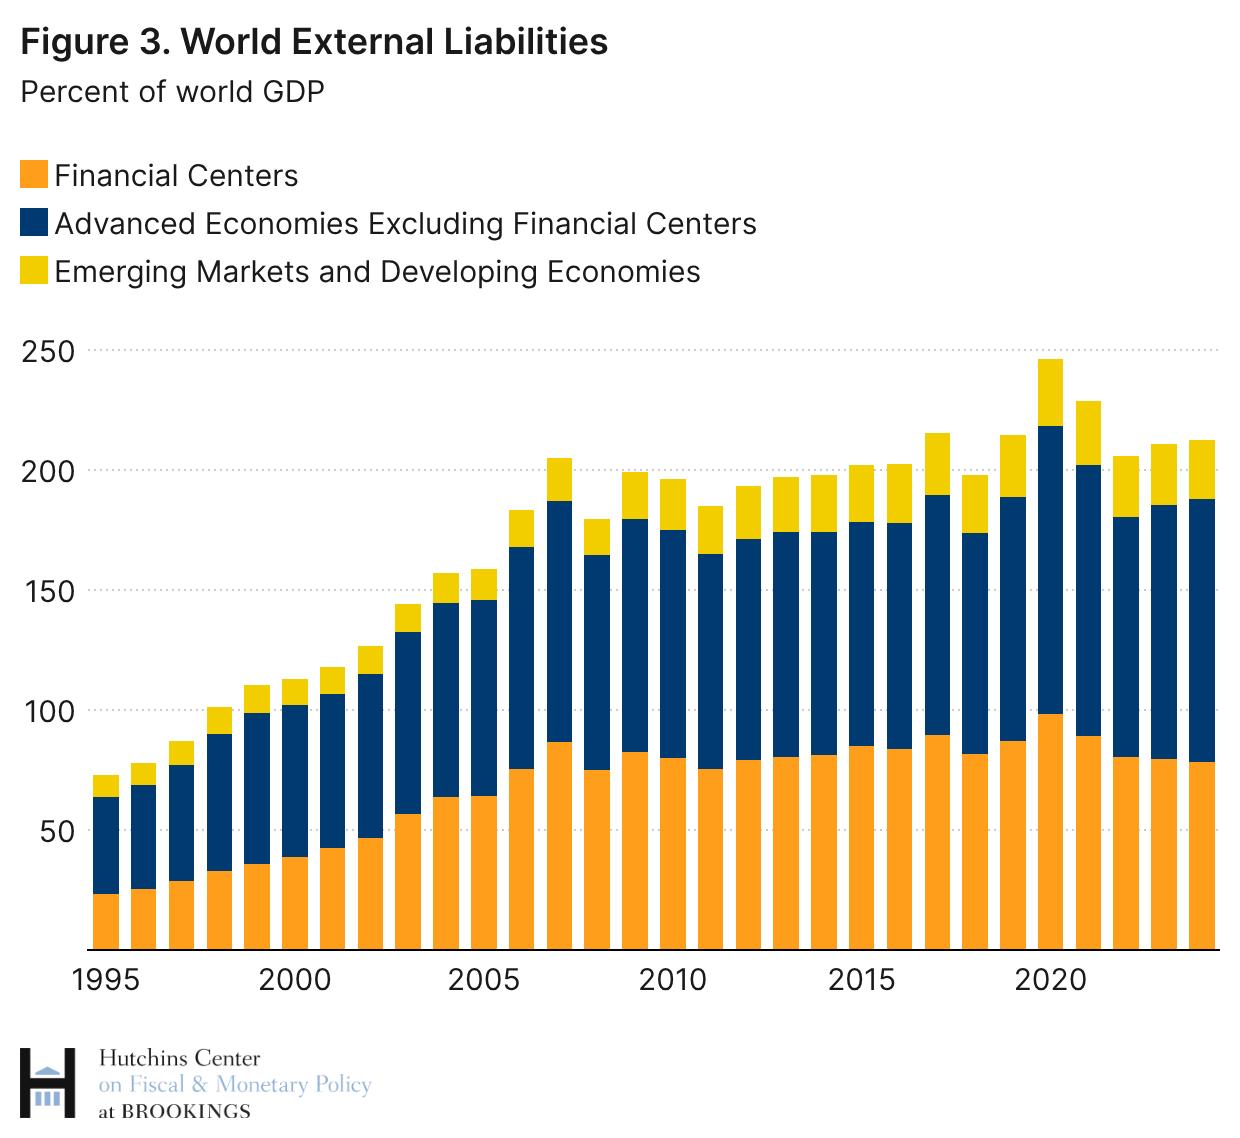
In that figure, countries are divided into three groups: financial centers, advanced economies, and emerging and developing economies.2 The increase reflects both cross-border flows during 2024 and the increase in the valuation of equity positions around the world. At the same time, global FDI flows remain subdued and global FDI positions are lower as a share of world GDP than they were in 2017. While flows to China have declined substantially, most of the change seems driven by an unwinding of special-purpose entities in financial centers, triggered by the U.S. tax reform of 2017.3 Indeed, the decline in the role of financial centers in recent years visible in Figure 3 (orange bars) is entirely driven by reduced FDI positions.
In the aggregate there are no clear signs of a decline in international financial integration (the spike in 2020 was driven by the COVID-induced fall in global GDP and the decline since the 2021 peak by the inflation episode of 2022-23). However, signs of fragmentation are more visible in bilateral data, as discussed in the Geneva Report.
In sum: 2024 saw a further widening of net creditor and debtor positions, driven primarily by valuation changes, as equity prices rose sharply again during that year, while gross positions have remained relatively stable as a share of global GDP.
Author
Related Content


-
Acknowledgements and disclosures
The author thanks Tristan Loa for excellent research assistance and Andrew Rosin for thorough fact-checking.
-
Footnotes
- U.S. International Investment Position, 3rd Quarter 2025 | U.S. Bureau of Economic Analysis (BEA).
- Financial centers are economies for which international financial intermediation (as opposed to end-use of funds) is the main cross-border financial activity. They include the United Kingdom, the Netherlands, Switzerland, and Ireland, as well as smaller financial centers such as Luxembourg, Bermuda, and the Cayman Islands.
- These are financial entities with virtually no employees used by multinational corporations primarily for tax purposes.
The Brookings Institution is committed to quality, independence, and impact.
We are supported by a diverse array of funders. In line with our values and policies, each Brookings publication represents the sole views of its author(s).