The U.S. dollar has risen moderately in the weeks since Donald Trump won the presidential election, in an almost exact repeat of price action after the 2016 election. The dollar rise reflects primarily expectations for fiscal easing and higher growth and still has room to run, based on how modestly interest differentials have moved compared to 2016. A second, much larger phase of dollar strength is likely to come if the U.S. imposes tariffs on China. The lesson from similar tariffs in 2018 is that China allows the yuan to fall as an almost one-for-one offset to the hit to competitiveness. Such a fall is likely to put severe depreciation pressure on the rest of emerging markets, in addition to pulling down commodity prices. Such a tightening in global financial conditions raises the risk of negative spillback to the U.S., which—from China’s perspective—is probably not unwelcome.
Global markets after the US election
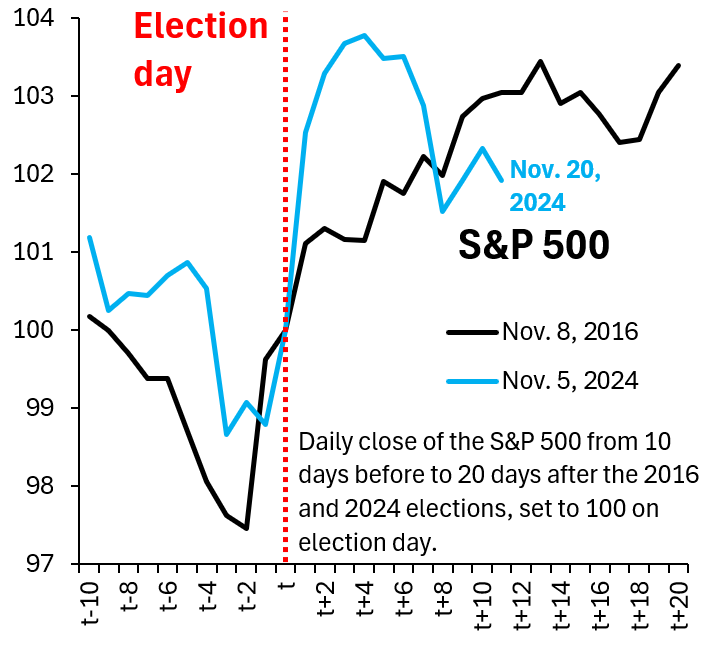
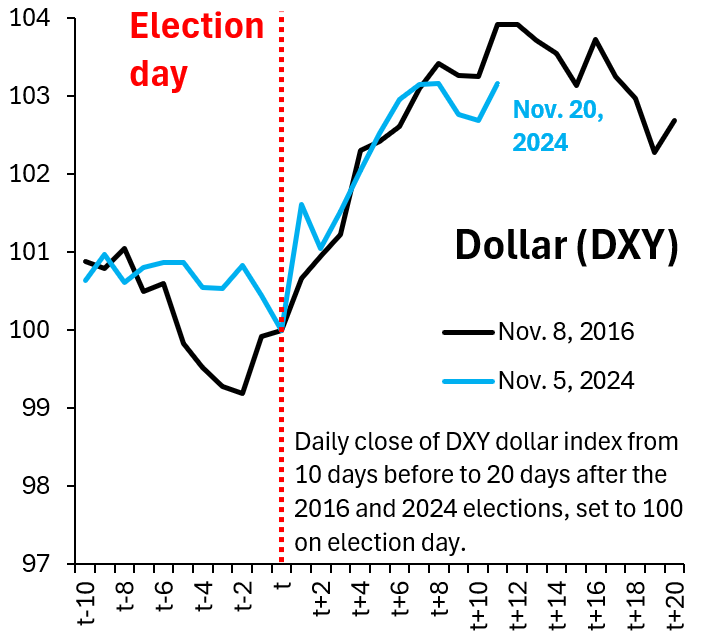
In the days following the election, U.S. equities rose very sharply. We compare the rise in the S&P 500 in the days following November 5 to what happened in 2016 (Figure 1). Stocks rose much more sharply than back then, potentially on expectations of deregulation, but—as time passed—the dollar began to outperform (Figure 2), perhaps a sign markets are starting to assign some odds to U.S. tariffs (which could be growth negative—thereby weighing on the S&P 500—but lift the dollar).
Figure 1. Daily close of the S&P 500 from 10 days before to 20 days after the 2016 and 2024 elections, set to 100 on election day
Figure 2. Daily close of the DXY dollar index from 10 days before to 20 days after the 2016 and 2024 elections, set to 100 on election day
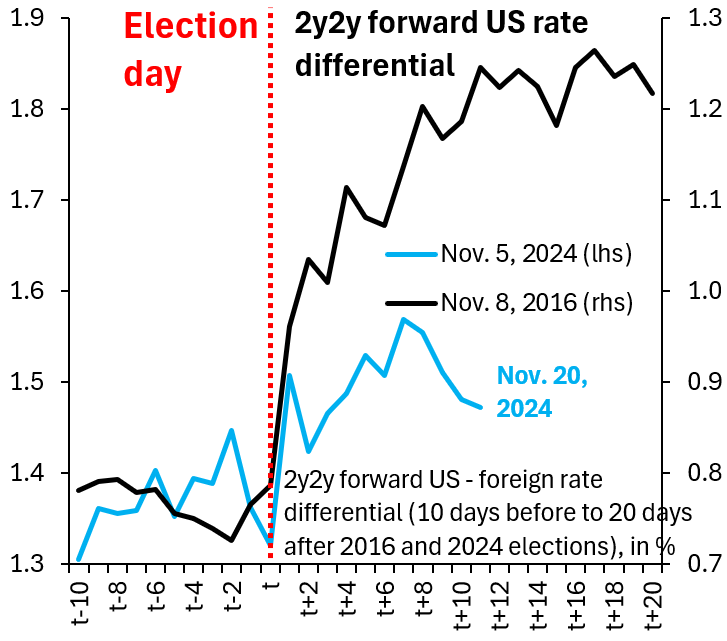
Interest rate differentials of the U.S. vis-à-vis other advanced economies are one way to benchmark the dollar rise. Now as in 2016, expectations of fiscal easing and higher growth are lifting U.S. interest rates versus elsewhere. We compare the move in the 2y2y (Figure 3) and 5y5y (Figure 4) forward rate differential since November 5 (blue) versus what happened in 2016 (black). So far, markets have only lifted the U.S. rate differential around half of what they did in 2016, which means that this source of dollar strength probably still has more room to run.
Figure 3. 2y2y forward US-foreign rate differential, 10 days before to 20 days after 2016 and 2024 elections, in %
Figure 4. 5y5y forward US-foreign rate differential, 10 days before to 20 days after 2016 and 2024 elections, in %
The impact of tariffs on global markets
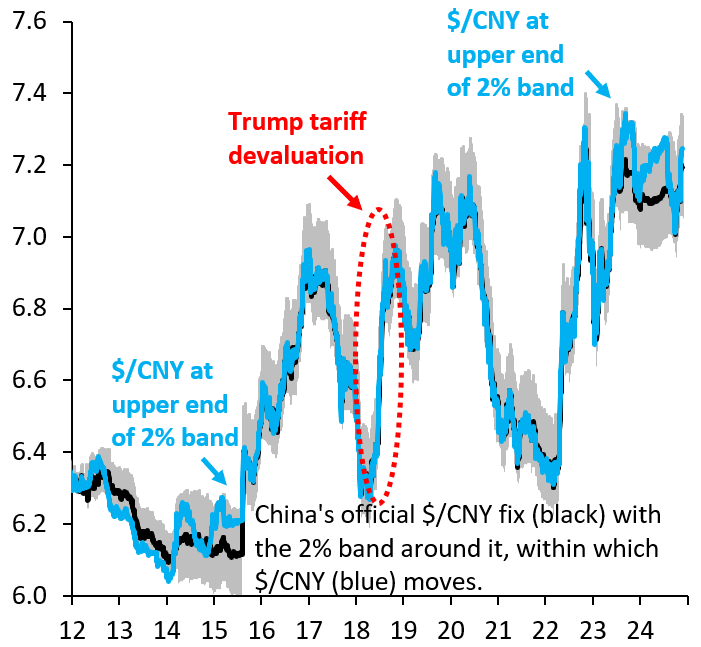
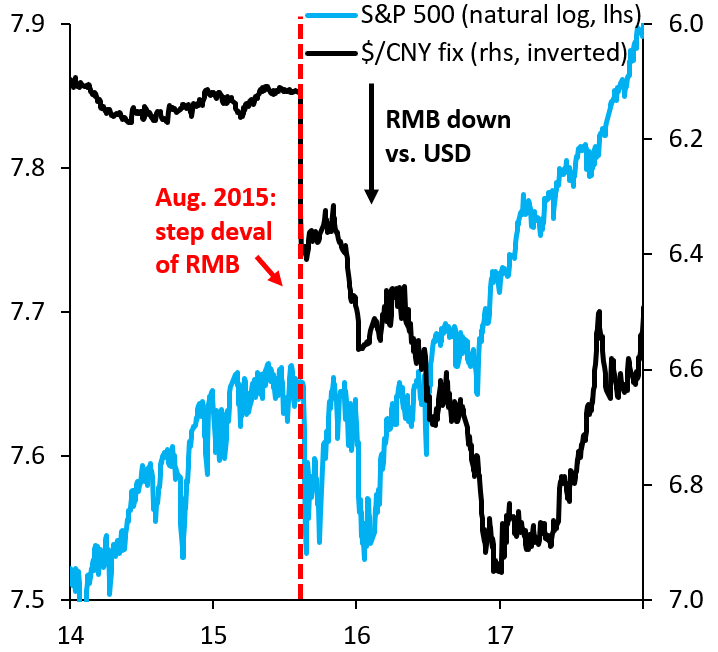
You can think of the current rise in the dollar—predicated primarily on expectations of fiscal easing—as the first phase of dollar strength after the election. A second, perhaps much larger phase may come if the Trump administration imposes tariffs on China. The 2018 experience is instructive in this regard. Back then, the U.S. tariffed half of all imports from China at a 25% rate for an average tariff rate of 12.5%. The yuan fell around 10% against the dollar around then (Figure 5), in what was an almost one-for-one offset for the hit to competitiveness. An across-the-board 60% tariff could necessitate a much larger fall in the yuan if China wants to protect the market share of its export sector in the U.S. Such a fall could put severe depreciation pressure on the rest of emerging markets and cause commodity prices to fall. This global tightening in financial conditions could then spill back to the U.S. and weigh on the S&P 500, which is what happened during the renminbi devaluation scare in 2015 and 2016 (Figure 6). From China’s perspective, such a spillback might not be entirely unwelcome. After all, the president-elect is often thought to see the S&P 500 as one gauge of his success, so persistent weakness like in 2015/6 could make the incoming administration less enthusiastic about tariffs.
Figure 5. China’s official $/CNY fix (black) with the 2% band around it, within which $/CNY (blue) moves
Figure 6. $/CNY fix (black) and S&P 500 (blue)
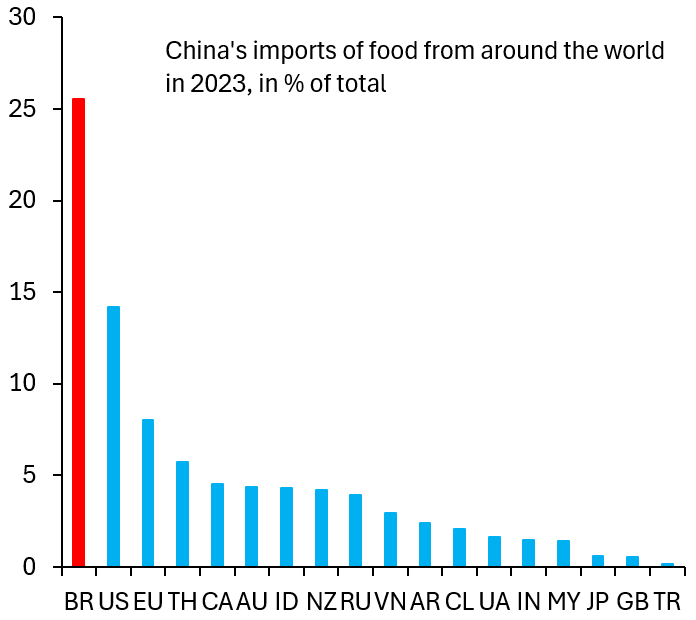
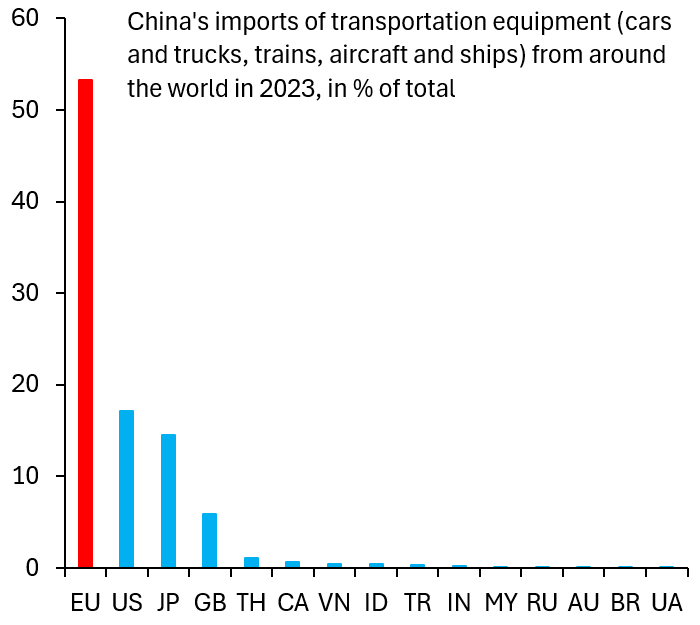
Even in the run-up to tariffs—before they are even implemented—there could be adverse fallout for global markets. Currently, Brazil is the largest food exporter to China by a substantial margin (Figure 7). If China decides to try to head off tariffs by buying more agricultural products from the U.S., this could amount to a negative shock for Brazil as it scrambles to place its products elsewhere. The same is true for the European Union where transportation equipment is concerned. The EU is currently by far the largest exporter of motor vehicles, aircraft, trains, and ships to China (Figure 8). This could turn into a liability if China starts ordering more Boeing aircraft instead of Airbus, for example. In short, a second, more pronounced phase of dollar strength may start once the president-elect is in office and the likelihood of tariffs rises.
Figure 7. China’s imports of food from around the world in 2023, in % total
Figure 8. China’s imports of transportation equipment (cars, trucks, trains, ships) from around the world in 2023, in % of total
The Brookings Institution is committed to quality, independence, and impact.
We are supported by a diverse array of funders. In line with our values and policies, each Brookings publication represents the sole views of its author(s).




Commentary
The dollar and global markets after the US election
November 21, 2024