Candidates in the 2024 Republican primary have echoed decades–long calls to substantially scale back or even eliminate the Department of Education. What candidates mean by “shutting down” is vague. It could indicate a type of restructuring that folds federal programs into block grants or combines the Department of Education with the Department of Labor. Regardless, their message seems clear: Federal spending in education—like the federal role in education—is bloated and should be cut. Considering the upcoming election, this rhetoric raises a question: If the president wants to cut federal spending in education, would he or she realistically be able to do it? How successful have presidential budget requests for ED been over time? Before investigating the prospect of cuts and their feasibility, let’s step back to think about federal funding in education. Each year, schools rely on billions of dollars provided by the federal government to supplement their operating costs. In school year 2019-20—before pandemic-related programs changed spending patterns—federal sources accounted for around eight percent of all public K-12 revenue. Many districts, including a disproportionate number in conservative states, depend on federal funds for an even greater portion of their budget. Reducing or losing this revenue could be extremely consequential and jeopardize funding streams created to support low-income and historically marginalized students. With that in mind, this piece examines the relationship between which party controls Congress, which party controls the White House, and funding levels for elementary and secondary programs channeled through the U.S. Department of Education (the focus on K-12 is for simplicity, as the higher education budget numbers are much harder to pin down). We walk through trends in total K-12 funding, and the differences between the president’s budget and what is appropriated, over several decades. To make funding comparable across time, we use inflation-adjusted dollars, using September 2023 as our benchmark.
U.S. government 101: The appropriations process
An appropriation is a statutory provision that enables a federal agency to obligate the Treasury to fund it. Appropriations are how federal K-12 funding streams channeled through the U.S. Department of Education are created. Below, Figure 1 provides an overview of the budget and appropriation process:
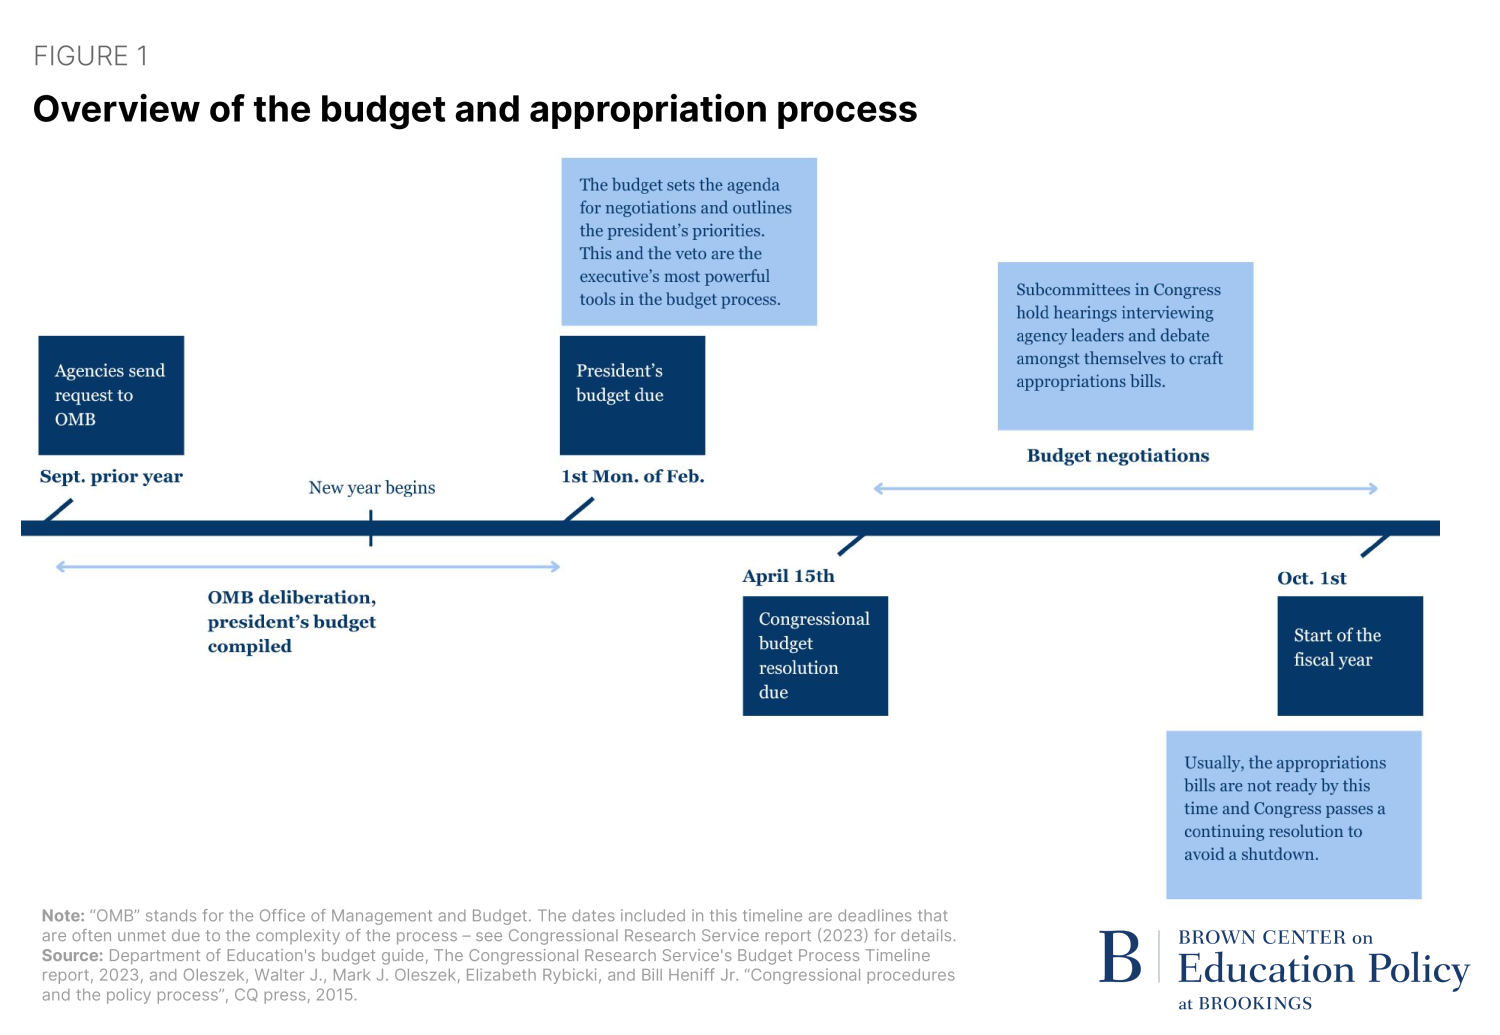
In the September before the president’s budget comes out, federal agencies begin the process by making budget requests for their institutions to the Office of Management and Budget (OMB). This is the base from which the president develops his or her budget (due on the first Monday of February), which then goes to Congress for consideration and approval. Appropriations subcommittees work in Congress to develop bills that draw funding from the Treasury. Once Congress passes these bills—ideally, but rarely, by October 1st—the president must sign them into law for them to go into effect.
In other words, the president has an important voice in this process, but it is certainly not the only voice.
Interbranch disagreements over funding levels
Let’s look to the historical record and see how this budgeting process involving the president and Congress has played out. As we look at these data, we should note that an almost infinite array of inputs determine what is proposed and appropriated to fund the Department of Education. This post only seeks to present this information in a novel and (we think) interesting way and provide some simplified historical context for the figures.
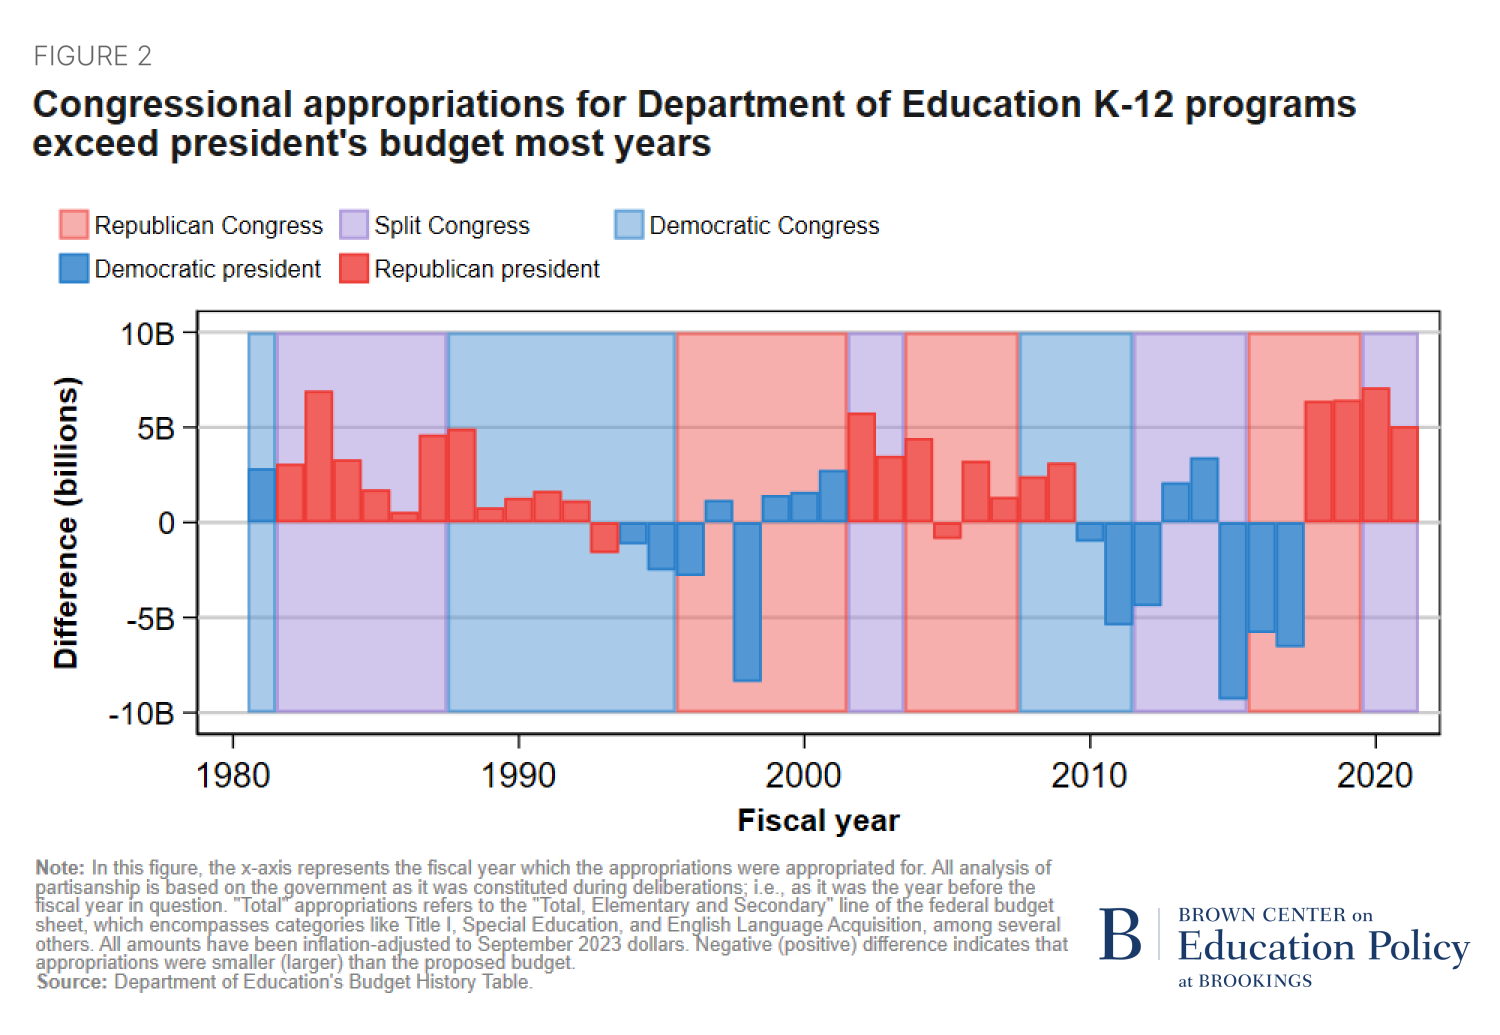
Since the inception of the U.S. Department of Education, the president and Congress have disagreed, to varying extents, on the appropriate amount of federal K-12 funding each year. Historically, Congress has resisted cuts proposed in the president’s budget. From FY 1981 to FY 2021, Congress’s appropriation was larger than what the president’s budget recommended around 71% of the time (for 29 of 41 budgets).1
Figure 2 illustrates this tendency and, to a certain extent, shows how gaps between the appropriations by Congress and presidents’ proposed budgets have increased in recent years (positive values indicate that congressional appropriations are beyond the president’s budget). Note how the last seven years meet or exceed a difference of more than $5 billion, negative and positive, which was a relatively rare occurrence during the prior 30-year period. These large differences occur despite “trifectas” of both Democrats (blue bars and blue field, FY 2011) and Republicans (red bars and red field, FYs 2018 and 2019) where one party controls the White House, Senate, and House of Representatives.
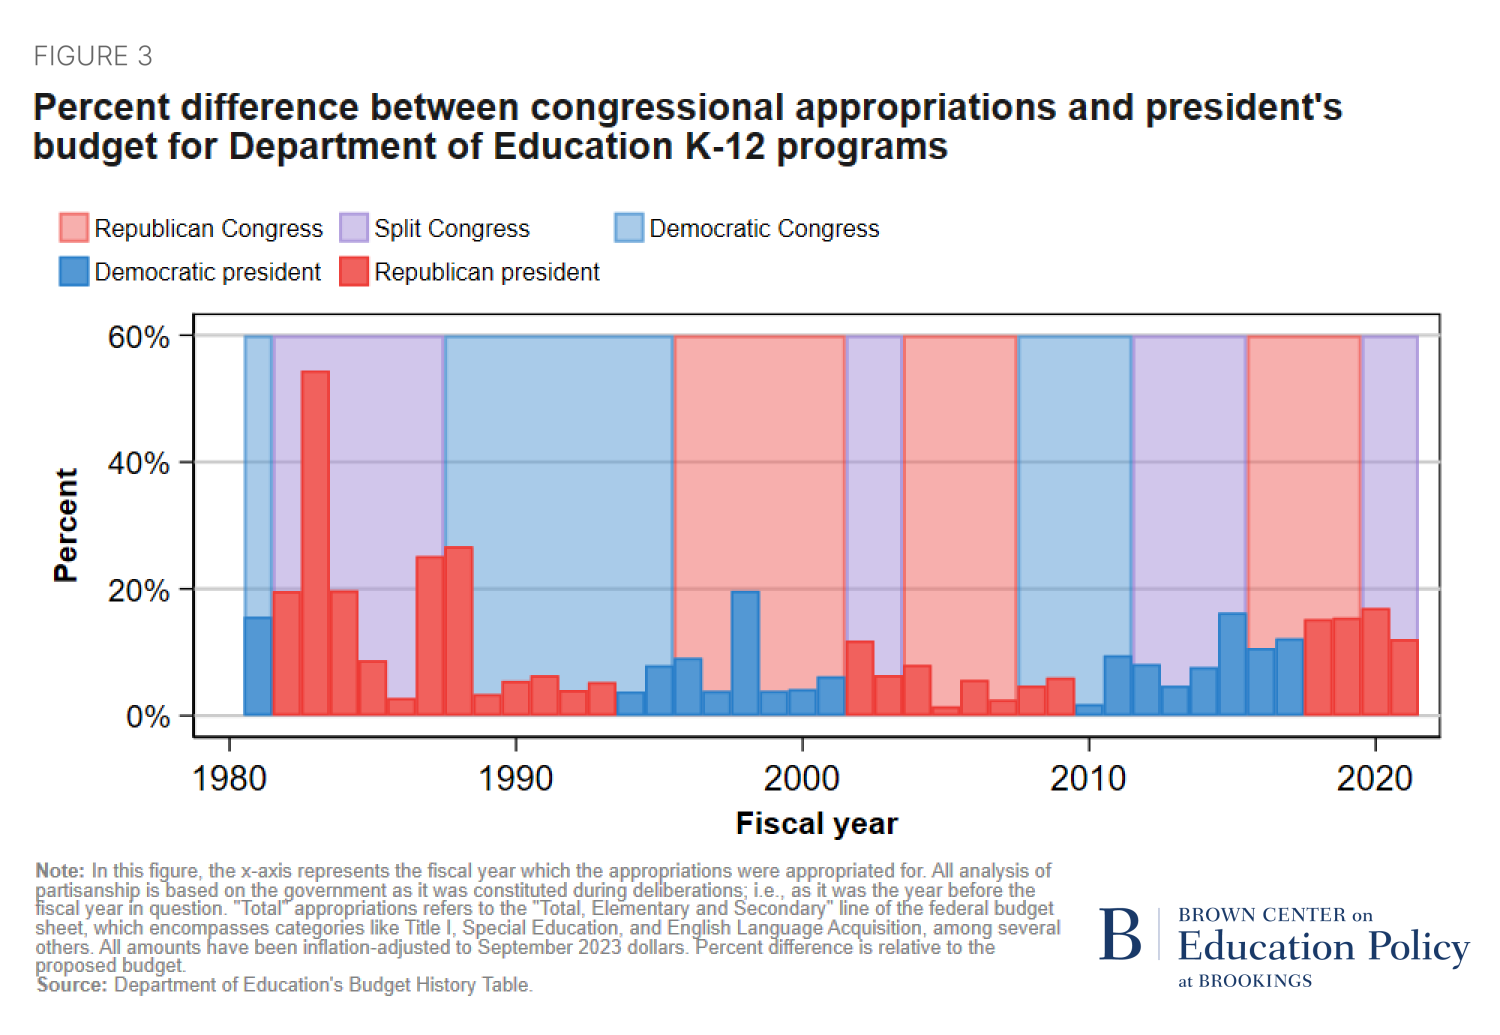
A drawback of looking at the difference between the president’s budget and what congress appropriates in dollar terms is that the portion of the total budget these numbers represent is unclear (a difference of $5 billion of a $20 billion budget is qualitatively different to a $5 billion difference of a $50 billion budget). Figure 3 presents this difference in absolute percentage terms – higher values mean greater discrepancies between the branches. When we look at the difference between presidential requests and final appropriations in this way, we find that the largest differences are at the beginning and end of the period. The largest values are pre-1990, right after the Department’s inception (notice the large spike in 1983 when the country responded to A Nation at Risk). Differences have also risen in recent years; on average, presidential budgets between 2000 and 2009 were 5.7% different relative to what was appropriated while between 2010 and 2020 presidential budgets had an average difference of 10.8% (and the last four differences all exceeded 15%).
K-12 appropriations and partisan control
Figure 4 shows total K-12 appropriations for the U.S. Department of Education over time. It also highlights partisan control of the presidency and Congress. Here, too, we report in real dollars, so a change in funding over time reflects an actual, inflation-adjusted change.
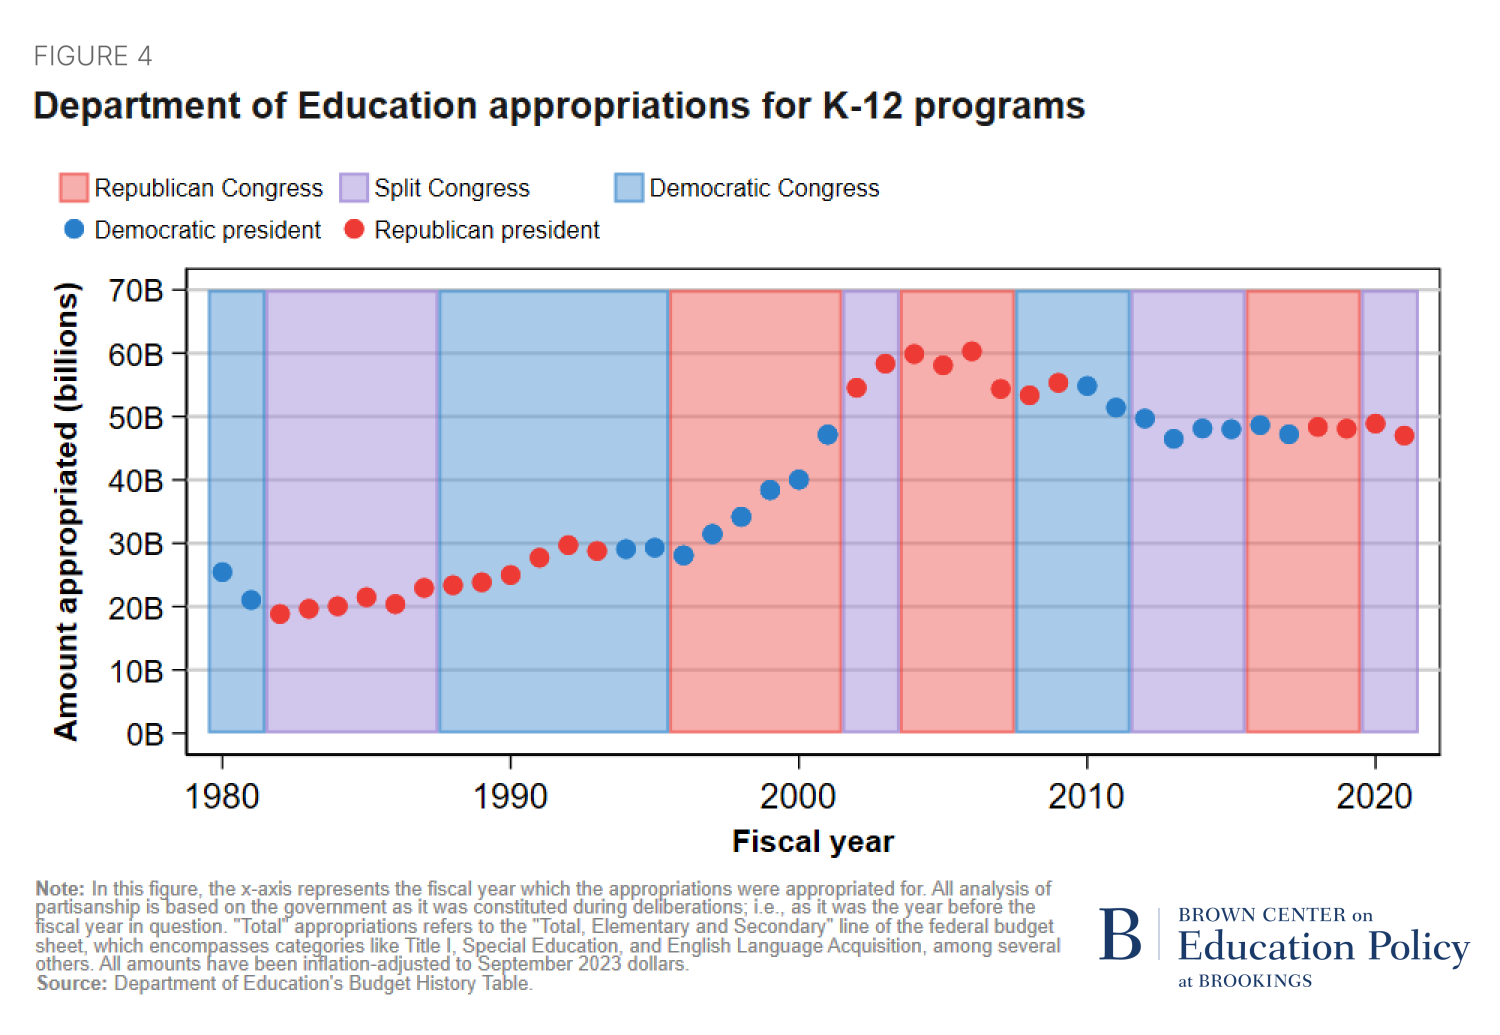
Looking at this chart, appropriations can be roughly categorized into four periods: 1) moderate expansion (inception to 1996), 2) rapid expansion (1996 to 2005), 3) decline (2006-2012), and 4) status quo (2012 to 2021).
Following the Department’s first appropriations during Jimmy Carter’s presidency, it experienced moderate expansion under the presidencies of Ronald Reagan and George H.W. Bush. After this came a period of rapid expansion from 1996 to 2005 (most of Bill Clinton’s presidency and the first half of George W. Bush’s), which persisted through several partisan arrangements in Congress.
The substantial (64%) growth in K-12 funding that occurred under Clinton was due to the continued expansion of existing programs (such as vocational training and in-school drug intervention) and the introduction of new programs like 21st Century Community Learning Centers (for out-of-school programming), as well as support for bringing technology into the classroom. During the Clinton years, the president’s request and congressional appropriation differed by a mean of seven percent.
During George W. Bush’s tenure, K-12 appropriations peaked at $60.3 billion real dollars in FY 2006 during a Republican trifecta.2 This can be attributed to No Child Left Behind (NCLB) and the addition of its accompanying funding into the federal budget, including teacher incentive funds, STEM professional development, and the Reading First program. Immediately after its peak, however, K-12 funding dropped by 10% for FY 2007. The brunt of the cuts were borne by the recently introduced Bush-led programs.
This era of funding cuts extended to 2012, which encompassed the Great Recession of 2008 and 2009. During Obama’s first term, the budget declined by four percent each year on average, in real dollars, cumulatively amounting to a 23% decline from its FY 2006 peak in the FY 2013 budget. These cuts seeped into the Department’s evergreen programs. For example, Title I and special education funding dropped by $1.2 billion and $2 billion in real dollars, respectively, during this time.
The beginning of the status quo era began during Obama’s second term. Absolute percent change from year to year declined to two percent (as opposed to Clinton’s average of eight percent). This was not for lack of Obama’s effort – in 2015, 2016, and 2017, he proposed K-12 budgets that were 19%, 13%, and 11% higher than the previous year’s appropriation, respectively. A similar-but-reversed phenomenon is visible during the Trump presidency. The average percent change in congressional allocations was once again two percent, despite Trump consistently requesting budgets that were between 11% and 14% lower than the prior year’s appropriation (including funding requested for his K-12 block grant).
We should also note the data used in this piece haven’t been updated yet to reflect total elementary and secondary funding under President Biden. Individual program information is available but, given that it fails to encompass the full picture of federal funding (particularly with COVID-19 relief funding), a complete analysis is not yet possible with the data available.
Looking forward
As national attention continues to focus on the 2024 presidential race, it’s important to remember that presidents are important actors in setting the federal budget, but they are far from being unilateral actors. If history is any indication, a president who enters the Oval Office in 2024 with the intention of slashing the U.S. Department of Education budget may find their impact limited.
Related Content


Authors


-
Footnotes
- All data referenced in this blog post (except for that regarding Biden and introduced toward the end) is retrieved from the Department of Education’s Budget History Table and has been adjusted to real dollars as of September 2023 using CPI information retrieved from the U.S. Bureau of Labor Statistics U.S. City Average Consumer Price Indexes. Donald Trump’s proposed block grant is also adjusted for inflation and included as part of his budget proposal for FY 2021. This number is not found on the U.S. Department of Education’s budget history sheet, but we feel excluding it creates a less full picture of proposals over time.
- It’s important to make clear that this was respective of money appropriated for Hurricane Katrina relief, which was channeled through the “Hurricane Education Recovery Act” and the “Emergency Supplemental Appropriations Act for Defense, The Global War on Terror and Hurricane Recovery” bills, neither of which were encompassed in the formal, yearly appropriations process addressed here.
The Brookings Institution is committed to quality, independence, and impact.
We are supported by a diverse array of funders. In line with our values and policies, each Brookings publication represents the sole views of its author(s).