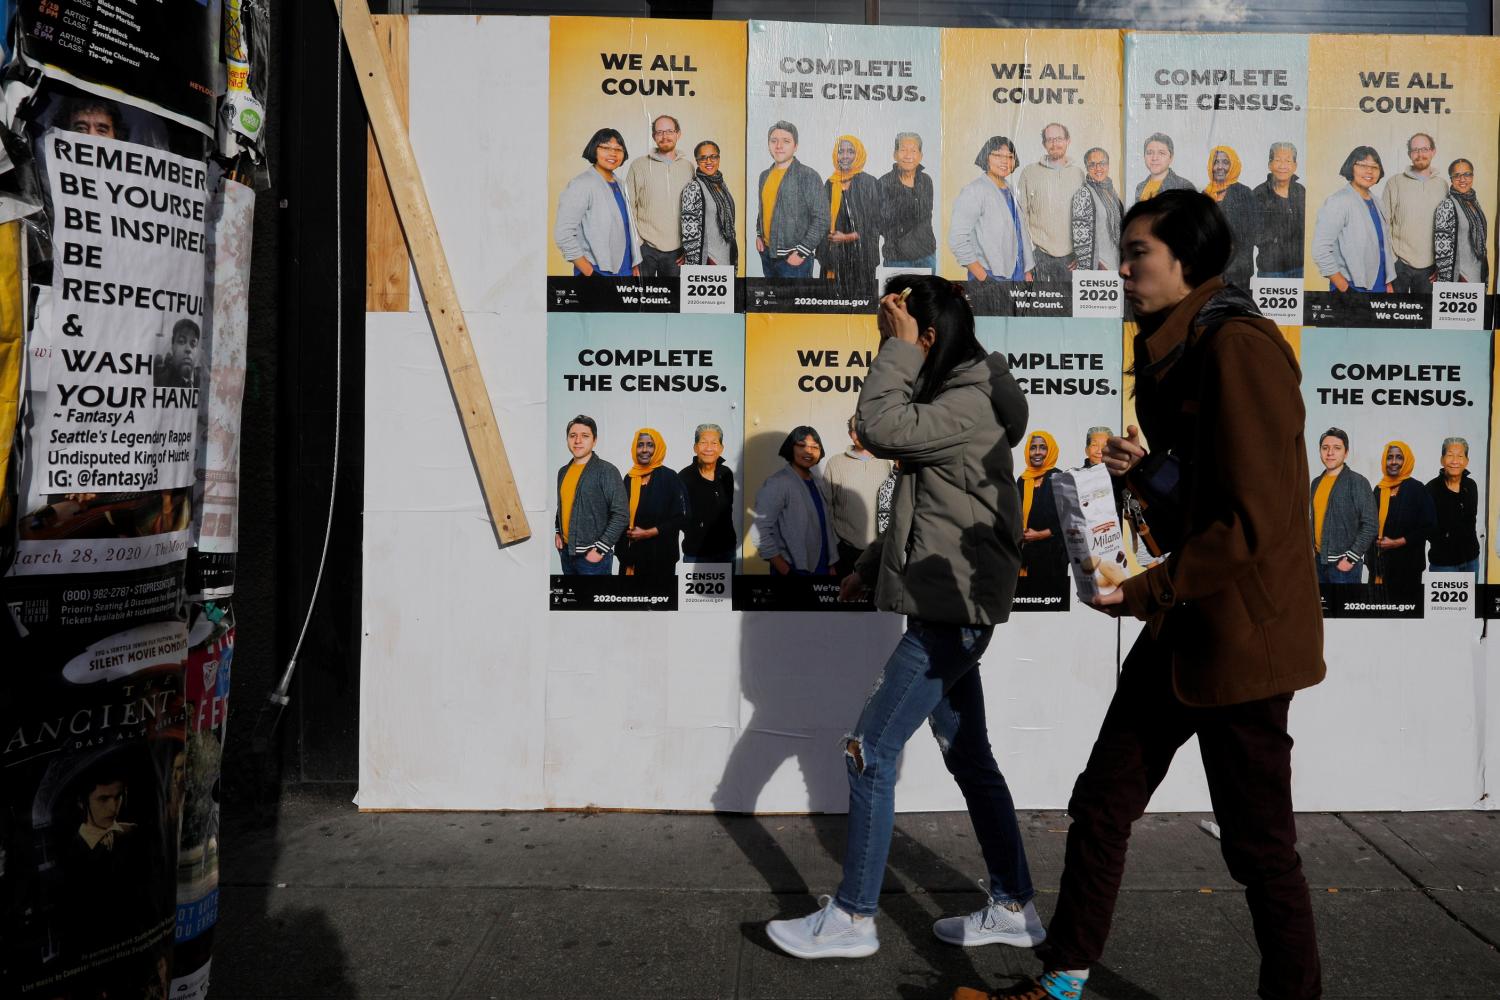
Once every decade, April 1 transforms into a little-known, if pivotal, holiday: Census Day, the official reporting date of the decennial U.S. census. Millions of Americans, many sequestered at home, are now completing their 2020 census information online, by phone, or by mail. In doing so, they are fulfilling an important civic duty, as mandated by the Constitution.
Although the COVID-19 pandemic has required the Census Bureau to revise some of its schedule, the fruits of this mammoth survey will be rich and detailed information about the demographic state of our nation which will roll out over the course of next year. After, we should have the complete, precise picture of America’s population that only comes every ten years.
While we do not have the specific details of this picture yet, it is possible to make some educated predictions about what the 2020 census will tell us. Two decades into the 21st century, we are a country whose growth, spatial distribution, age structure, racial and ethnic diversity, and congressional apportionment will look much different than what is commonly perceived. Drawing from recent population estimates, surveys, and projections conducted by the Census Bureau and others, here are some headlines we can expect to find once the 2020 census is complete.
America’s population growth will hit an all-time low
For much of the recent past, the U.S. has been one of the most rapidly growing countries in the industrialized world. This was especially true in the last half of the 20th century due to the post-World War II baby boom, and rising immigration in the 1980s and 1990s. But the 2020 census will likely show the smallest decade-long growth rate in America’s history.

Late last year, the Census Bureau projected the U.S. population to be 330.2 million on January 1, 2020. When prorated to Census Day, this would put the decade’s growth rate at 7.1%, the lowest since the first census was taken in 1790. It would be smaller than the 7.3% growth rate during the Great Depression, and far lower than the growth rate of 13.2% during the 1990s, a decade of increased immigration and millennial births.
This low growth rate reflects uneven immigration flows (especially in recent years) and child-bearing delays by millennials. And Census Bureau projections suggest future growth may not pick up much at all, and likely decline further due to the continued aging of the U.S. population, with more deaths and only modest changes in fertility rates. Much will depend on future immigration.
States in the Mountain West plus Texas and Florida will grow the fastest
Despite the national slowdown in growth, some parts of the country fared pretty well over the 2010 to 2020 decade, especially the Mountain West states of Utah, Idaho, Nevada, Colorado, and Arizona, as well as Texas and Florida, according to projections.
Granted, even these states did not grow as rapidly as in the recent past, a result of reduced Sun Belt growth early in the decade in the Great Recession’s aftermath. Still, each state shows growth rates more than twice that of the nation.
…
Map 1: Projected State Population Growth, Census 2010 to Census 2020
…
Source: William H Frey projections based on 2010 US Census and 2018 and 2019 census estimates released Dec 30, 2019
Meanwhile, a large swath of states—mostly in the middle of the country—are projected to grow slower than the nation as a whole, including four which should register absolute population losses: Connecticut, Illinois, Vermont, and West Virginia. Not since the 1980s have four states lost population between censuses.
The 55-and-older population will grow many times faster than younger generations
The 2020 census will highlight the sharp growth divide between the old and the young in America. Between 2010 and 2020, the number of people over age 55 should grow by 28.8%, which is 37 times larger than the growth rate of the collective population under 55 (0.8%). The largest driver of this divide is the baby boomer generation, who passed the age of 65 during the past decade, increasing the size of the 65- to 74-year-old age group by more than half.

Among the younger generations, millennials helped to power the modest growth of the 25- to 34-year-old population, though the smaller generations following them tamp this growth rate down to close to zero.
We can expect all states, metro areas, and most counties to show gains in their 55-and-older populations. Even in demographically stagnating areas, the “aging in place” of the baby boomer generation within them will lead to population growth for seniors.
Map 2: Growth and decline in under age 18 populations, US States, 2010-2019
…
Source: William H Frey analysis of 2010 and 2019 census estimates released December 30, 2019
The story is much different for the younger population. With a national growth rate of nearly zero, migration—either in or out—will determine if an area registers a gain or loss of young people. This is reflected in Census Bureau estimates for 2010 to 2019 state changes in under-18 populations. Fully 30 states register losses in their youth population in these estimates, including large swaths of the Northeast, Midwest, and interior South.
In contrast, 20 states and Washington, D.C. show population gains, largely due to the in-migration (from outside the country and from other states) of young people and families with children. While the nation as a whole is facing heightened age dependency—the increased ratio of senior retirees to the working young—these states may be in a better position to bolster their future young labor forces.
America’s diversity expands, with young whites in a minority
America’s “diversity explosion” was already apparent from the 2010 census. The 2020 results will show an amplification of this trend.
Over the 2010 to 2020 decade, the growth rate of persons identifying as white is projected to grow by a modest 0.6%, smaller than any other race-ethnic group. In contrast is the rapid growth of persons identifying as two or more races, Asian Americans, and Latinos and Hispanics. The 2020 census is projected to show that persons identifying as a nonwhite racial or ethnic minority will comprise more than 40% of the U.S. population.


The slow growth rate of white Americans is attributable to an aging population with proportionately fewer white women in their child-bearing ages. Other racial and ethnic groups are younger and contribute more to the nation’s births—thus, racial and ethnic diversity is most prominent among America’s youth. The 2020 census should show that, for the first time, persons identifying with a nonwhite race or ethnic group will comprise more than 50% of people under age 18.
Map 3: Where race-ethnic minority groups are highly represented, by county
…
Source: William H. Frey analysis of US Census population estimates, 2018
A group is highly represented if its share of the area population is larger than its share of the national population for Hispanics (18.3%), blacks (12.5%), and Asians, Native Hawaiians and Other Pacific Islanders (5.9%) and at least 4% for American Indians/Alaska Natives, or persons identifying as multiracial
*Non Hispanic members of group
**Two or more minority groups are highly represented or persons identified as multiracial are highly represented
Diversity is spreading across the country in different forms depending on the region, according to a mapping of 2018 census estimates. Latino or Hispanic residents are highly represented in a swath of counties from California to Texas, but also in Florida and select other parts of the country. Concentrations of Black Americans are dominant in much of the South.
In fast-growing parts of the country, two or more nonwhite racial and ethnic groups are highly represented. And in some urban counties such as Queens, N.Y., Harris, Texas, Gwinnett, N.Y., and Solano, Calif., three or more nonwhite groups are strongly represented.
Although many of the nation’s interior counties do not yet show a large representation of these groups, whites declined as a share of the population in 96% of all U.S. counties between 2010 and 2018.
Big cities will register a growth comeback
The 2020 census will reveal a decade-long population boom for America’s largest cities that counters their more modest experience in the prior decade. The 2000 to 2010 growth rates for cities were hampered by population dispersion to suburbs and smaller metropolitan areas, associated with an overheated mid-decade housing market and economic draws to less-populous places.
In contrast, the 2010s began with a “return to the city” movement partly motivated by a down suburban housing market and the decision of young adult millennials to locate in cities rather than suburbs. While the latter factor seems to be changing in recent years, the 2010 to 2018 period showed big city and suburban growth rates to be at similar levels, in contrast to the 2000s, when suburban growth dwarfed city growth.

In fact, 29 of the nation’s 47 biggest cities (with populations exceeding 400,000) already achieved more growth over the 2010 to 2018 period than in the entire 2000 to 2010 decade. These include rapidly growing places such as Denver, which saw its growth more than double from 8% in the 2000s to 19% from 2010 to 2018. Other cities had more modest gains, including Kansas City, Mo., where growth rose from 4% to 7%.
While it is already clear that the surge in urban populations is dissipating, the 2020 census results will show that the 2010s were good to big cities.
For the first time in its history, California will likely lose a congressional seat
The reason why a decennial census is mandated by the Constitution is to reapportion the number of members each state sends to the House of Representatives. Since the 1950 census, three Sun Belt states—California, Florida, and Texas—have gained the most new members: 23, 19, and 14, respectively.
But California’s large, 53-seat congressional delegation did not increase after the 2010 census, and new projections suggest that the nation’s most populous state will lose a seat for the first time in its history. Meanwhile, both Texas and Florida are projected to gain multiple seats.
Map 4: Projected Change in Congressional Representation, 2010-2020
…
Source: William H Frey projections based on 2010 US Census and 2018 and 2019 census estimates released Dec 30, 2019
California, while still growing, saw some of its population shift outward, especially to faster-growing western states such as Arizona, Oregon, Colorado, and Montana, each of which are projected to gain a seat (along with North Carolina). While several northern, midwestern, and interior-southern states are also projected to lose congressional seats as a result of the 2020 census, California’s long upward trajectory appears to have come to an end.
A new decade of stagnation, aging, and diversity
As we observe Census Day, these predictions point to a country with slower overall growth, rapid aging, and increased racial and ethnic diversity, especially among its younger population. Beyond confronting the current national crisis, the next decade will bring with it new challenges and opportunities in dealing with greater age dependency, increasing racial and ethnic harmony, and resolving spatial disparities—all in the context of a less demographically dynamic nation.
The 2020 census results—which will provide updated portraits of communities of all sizes across the far reaches of America—will be crucial in planning for the considerable changes that lie ahead.
The Brookings Institution is committed to quality, independence, and impact.
We are supported by a diverse array of funders. In line with our values and policies, each Brookings publication represents the sole views of its author(s).


