
The notion of equal pay for equal work resonates strongly in the teaching profession. Fixed salary schedules determine how the vast majority of public school teachers are paid. Yet, an inherent, often overlooked tension is this: Though salary schedules were designed to avoid wage inequalities on some dimensions, they institutionalized inequalities on others—namely, experience and credentials.
This paper examines inequalities in public school teacher compensation and explores its relationships to inequalities in both school funding and teacher pensions. We discuss prior research on the topic and present empirical evidence of salary inequalities based on nationally representative data from the American Community Survey. We then combine these measures with state-level data on school funding and teacher pensions from other published sources.
Our analysis here is motivated by a simple observation: Prominent debates about inequalities in both school finance and teacher pension systems share similar origins in teacher salaries. Moreover, scholars have long criticized how teachers are compensated, providing monetary rewards on seemingly unproductive dimensions and creating their own types of inequalities.1 We hypothesize these inequalities in teacher compensation are correlated with inequality measures in finance and pensions.
In summary of our results, we find the level of overall salary inequality among public teachers is low in comparison to other occupations. In addition, teacher salaries show very little evidence of inequalities based on either race/ethnicity or gender dimensions, but show relatively high levels of wage inequality based on age (our proxy for experience), education, and geography. We find wage inequalities for teachers also vary considerably across states, and those with high wage inequality tend to be those with both higher levels of school funding inequalities and pension inequalities.
The evidence presented here demonstrates a strong association between inequalities across teacher compensation, school funding, and pension benefits that we believe warrants greater attention. In light of an aging workforce creating a growing number of teacher vacancies, and a new generation of increasingly mobile millennial teachers, these findings have important implications about how public resources are allocated across teachers and students.
Salary schedules and teacher compensation
Teachers fill critical roles in our public education system, with far-reaching effects on the lives of the students they teach.2 Over the past 10 years, research and policy have both prioritized efforts to attract, develop, and retain highly effective teachers in the classroom. How salaries are distributed across teachers is relevant to these discussions, and decisions to pay some teachers less and others more may at times come into conflict with politics, economics, or other desired policy objectives.3
Public school teachers are overwhelmingly compensated using salary schedules, in which states or districts set salary levels for teachers, with adjustments made depending on teachers’ years of experience (often referred to as “steps”) and education credentials (“lanes”).4 Salary schedules have evolved as the industry norm over time, largely as a mechanism to control inequalities in compensation. Historically, teacher salaries were determined based on local budgets and could vary greatly across positions, though this resulted in secondary teachers and white males often securing the highest-paid positions.5 Under legal, social, and economic pressures, these former systems evolved in the early to mid-20th century into salary schedules that standardize teacher compensation.6 In the 2011-12 school year (the most current year in which data are available), an estimated 89 percent of public school districts7 paid teachers according to salary schedules.8
In addition to reducing racial and gender inequalities, salary schedules that compensate according to inputs of human capital (rather than outputs) can arguably be the most efficient method to compensate workers in this type of complex occupation. Teachers are responsible for multiple tasks and have a multidimensional impact on students, with outcomes spanning academic learning, socio-emotional skills, and character values. These outputs are measured with varying degrees of difficulty, and making wages contingent on some or all of those outputs could result in adverse consequences for schools or students as teachers respond to incentives.9 Indeed, researchers have previously documented empirical evidence of a range of detrimental behaviors in contexts where teachers face some form of high-stakes accountability pressure, from strategic grade retention among students to cheating.10 Avoiding adverse responses in complex tasks is likely a major reason why the majority of workers in the public sector are compensated according to these schedules.11
Scholars have levied varied critiques against the use of salary schedules, but for this report we focus on three: the misalignment between what is rewarded on the salary schedule and teacher productivity, school funding inequalities that are indirectly tied to salary schedule differences, and the contribution of back-loaded salary schedules to escalating pension liabilities. We discuss each of these separately in the three sections that follow.
Schedule misaligned with factors of production
Salary schedules reward teachers differently according to educational attainment and experience. We consider the evidence on each dimension in turn, particularly as they relate to teacher productivity (i.e., that measured by student achievement based on standardized tests).
Research evidence shows earning higher degrees predict little of the observed differences in performance across teachers. Master’s degrees in large school districts are rewarded with an 11 percent salary bump on average,12 though many studies show no relationship to student achievement as measured by standardized test scores (in most circumstances),13 or sometimes even show a negative relationship.14 Even if we expand the definition of productivity to encompass other outcomes like student absence, we still do not see evidence of more teacher credentials making any difference for students.15
Gains in productivity, conversely, are associated with increased teaching experience, though the shape of the productivity gains over time do not match the shape of rewards to teaching experience. Studies on the topic show teacher productivity increases steeply in the first 3-5 years in the classroom and generally taper off thereafter.16 Though statistically significant gains in productivity have been observed later in a teacher’s career,17 these gains are relatively modest in comparison to the earliest years in the profession. Salary schedules, on the other hand, typically increase linearly over time, or perhaps even offer relatively larger increases (based on dollar values) late in teachers’ careers.
To evidence the misalignment between what is rewarded on the salary schedule and teacher productivity, an analysis by Vigdor juxtaposes the diminishing marginal productivity of teachers with experience against the wage profile commonly used in schools, showing teachers’ salaries are considerably back-loaded late into a teacher’s career.18 Relatedly, other studies highlight the common, yet counterproductive, practice of cost-of-living adjustments to salary schedules that apply a uniform percentage increase to all teachers;19 implicitly this gives the largest bonuses to the most experienced, compounding the misalignment already baked into most salary schedules. Back-loaded salary schedules that offer the highest salaries late into a worker’s career appears to be unique to the teaching profession.20
Interestingly, closely tying salaries to education and experience appears to legitimize these factors while delegitimizing others. For example, districts and unions have resisted differentiating salaries for teachers in hard-to-staff schools or subjects.21 Dee and Goldhaber present evidence that the large majority of teacher vacancies in the U.S. occur in particular hard-to-staff subjects or schools, and differentiating salary along these dimensions would go a long way to alleviating staffing pressures.22 Similarly, differential salaries or retention bonuses for effective teaching tend to meet political blowback among teachers.23
Evidence of wage inequalities
To explore income inequality in the teaching workforce, we make use of the 2015 American Community Survey (ACS) five-year estimates sample. This nationally representative survey, administered by the U.S. Census Bureau,24 provides information on education, income, occupation, labor force participation, and socio-demographic characteristics. We define public school teachers as teachers (preschool, kindergarten, elementary, secondary, special education, and other teachers) working in elementary or secondary schools who are employed by federal, state, or local governments.25
We calculate wage inequalities using the Theil index, a common measure of the overall inequality in a society. Rather than estimating society-level inequality, though, we use the Theil index to calculate inequalities among discrete populations within society (i.e., members of a particular profession). The Theil index takes on values between 0 and 1. Values closer to 1 mean that the income distribution among individuals is highly unequal, where a large proportion of the total income of the population belongs to a small percentage of its members. Small index values close to 0 signify show income is evenly distributed among individuals.
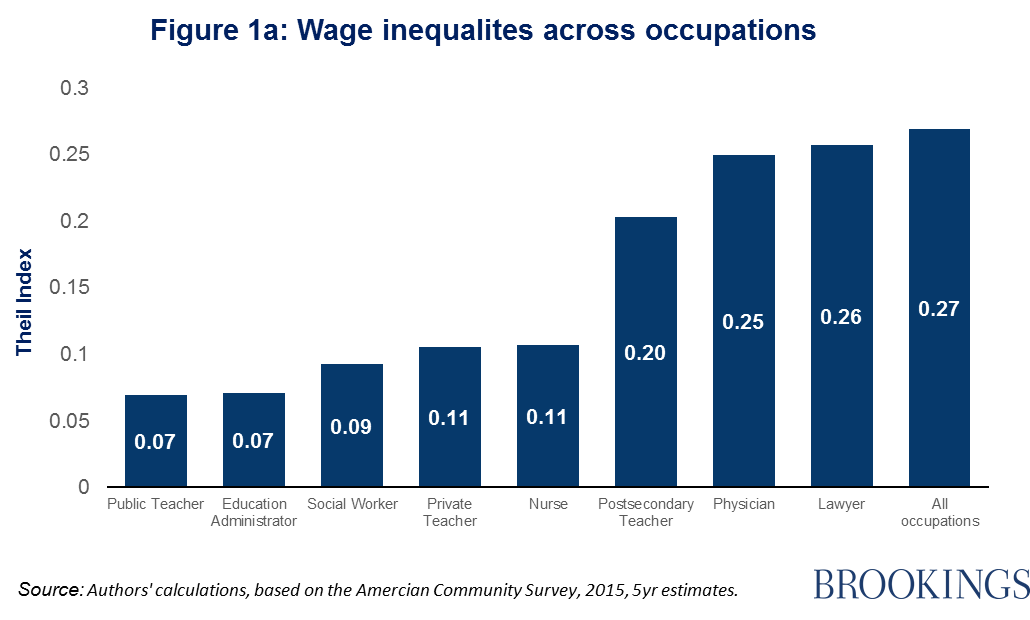
In addition, we calculate the Theil index among seven other occupations for comparison against public teachers.26 Three professions are chosen as plausible outside opportunities for teachers, if they were to leave the classroom (private school teachers, postsecondary teachers, and education administrators).27 Two professions are chosen because they are dominated by women and have similar educational and licensure requirements (social workers and hospital nurses). The final two professions, physicians and lawyers, although they have different entry requirements than teachers, are occasionally used as benchmarks in the teacher compensation research literature as they represent other large occupational workforces, with a substantive share employed by governments.
Figure 1a shows how the Theil index compares across these seven occupations (occupations are ordered corresponding to increasing Theil values). In the final column, we present the average Theil index observed across all full-time workers in the U.S. holding at least a bachelor’s degree. The Theil index of 0.07 for public school teachers signifies a high level of equality in wages across teachers, and is slightly lower than that of education administrators, social workers, private school teachers, and nurses. Theil index values among post-secondary teachers, lawyers, and physicians are markedly larger than that of public teachers, much closer in magnitude to the level of wage inequality observed across all occupations. The low Theil index for public school teachers underscores the ethos of equal pay for equal work in the profession.
Next, we wish to probe into these Theil indices further to understand what factors drive salary differences across these professions. The Theil index can be decomposed into two components: the between-group component and the within-group component. The between-group component measures the extent of inequalities across observable groupings in the data; for example, inequalities between males and females, or between black and white individuals. The within-group component measures the extent of intragroup inequalities, e.g., inequalities occurring among females or among males separately.
We examine inequalities among professionals in each of the occupations above by decomposing the Theil index according to groupings defined by state, locale (urban metro area versus non-metro area), sex, race/ethnicity, education, and age. Note that because experience in the occupation is not captured in the ACS data, we must use age as a proxy.
Figure 1b presents the results of this exercise. The y-axis of the figure represents the share of overall wage inequality accounted for by between-group inequalities for each of the professions. The stacked bars correspond to the six different characteristics considered. Note that all of the bars for each occupation fall below 50 percent; unobservable salary differences (for example, due to firm- or individual-level differences) account for the majority of the wage inequalities observed across all professions. Also, keep in mind that the seven occupation-specific bars represent percentages of the overall inequalities within each profession, and not absolute measures of inequality (e.g., relatively small-factor inequalities in high-inequality jobs like lawyers may actually be larger than that of the same factor in small-inequality jobs in absolute terms).
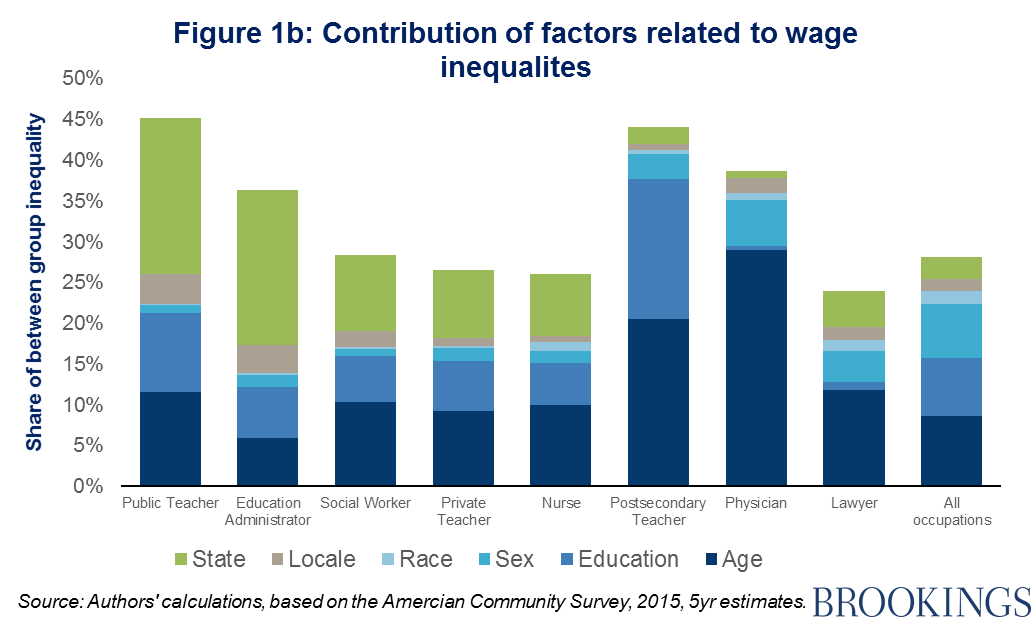
Three findings from this figure are noteworthy. First, wage inequalities based on sex and race/ethnicity are notably low among public school teachers (less than 1 percent). Though inequality on these dimensions are generally small across most of these professions we consider—particularly the ones with Theil values roughly comparable to teachers—public teachers still show the least inequality. Presumably, these low levels of inequality for public school teachers are due in no small part to salary schedules’ prescriptive nature, which mitigates opportunity for differential pay for similar work.
Second, age and education account for over 20 percent of the wage inequality observed across public school teachers.28 Reflecting the salary schedule’s design, inequalities based on age and education are expected; yet it appears that public teachers’ wages are more dependent on these factors in comparison to other professions, particularly those with similar Theil values. Though the share of overall inequality accounted for by age is only slightly larger among public teachers than it is among private school teachers, social workers, and nurses, education’s share of inequality is notably larger in comparison to these other professions. Interestingly, only postsecondary teachers exhibit higher levels of inequality based on both of these dimensions, though this may be due to the wide range of employers and career tracks included within that occupation (ranging from tenured faculty at research universities to instructors at vocational schools).
Finally, geographical factors—notably state and, to a lesser extent, locale—are far more important in determining wage inequalities among public teachers than the other comparison occupations. (Education administrator is the only comparable profession on these dimensions.) This finding is perhaps not entirely surprising, given that public teachers and education administrators are government employees and operate in localized labor markets; thus, wage opportunities in a different part of the state or country likely exert relatively little pressure on wages in a given district. Also, the large between-state share of inequality points to the fact that some states pay systematically more for teachers than other states.
Why do these comparisons of compensation factors across occupations matter? Outside wage pressures from other occupations could theoretically be driving differences in salaries for experience and education, even if these factors are only weakly related to teacher productivity. This could explain why so many states and districts continue to reward teachers according to these dimensions and not others. Yet, the evidence presented in Figure 1b suggests that teacher compensation is somewhat unusual, and does not directly correspond to the level of rewards in other occupations.
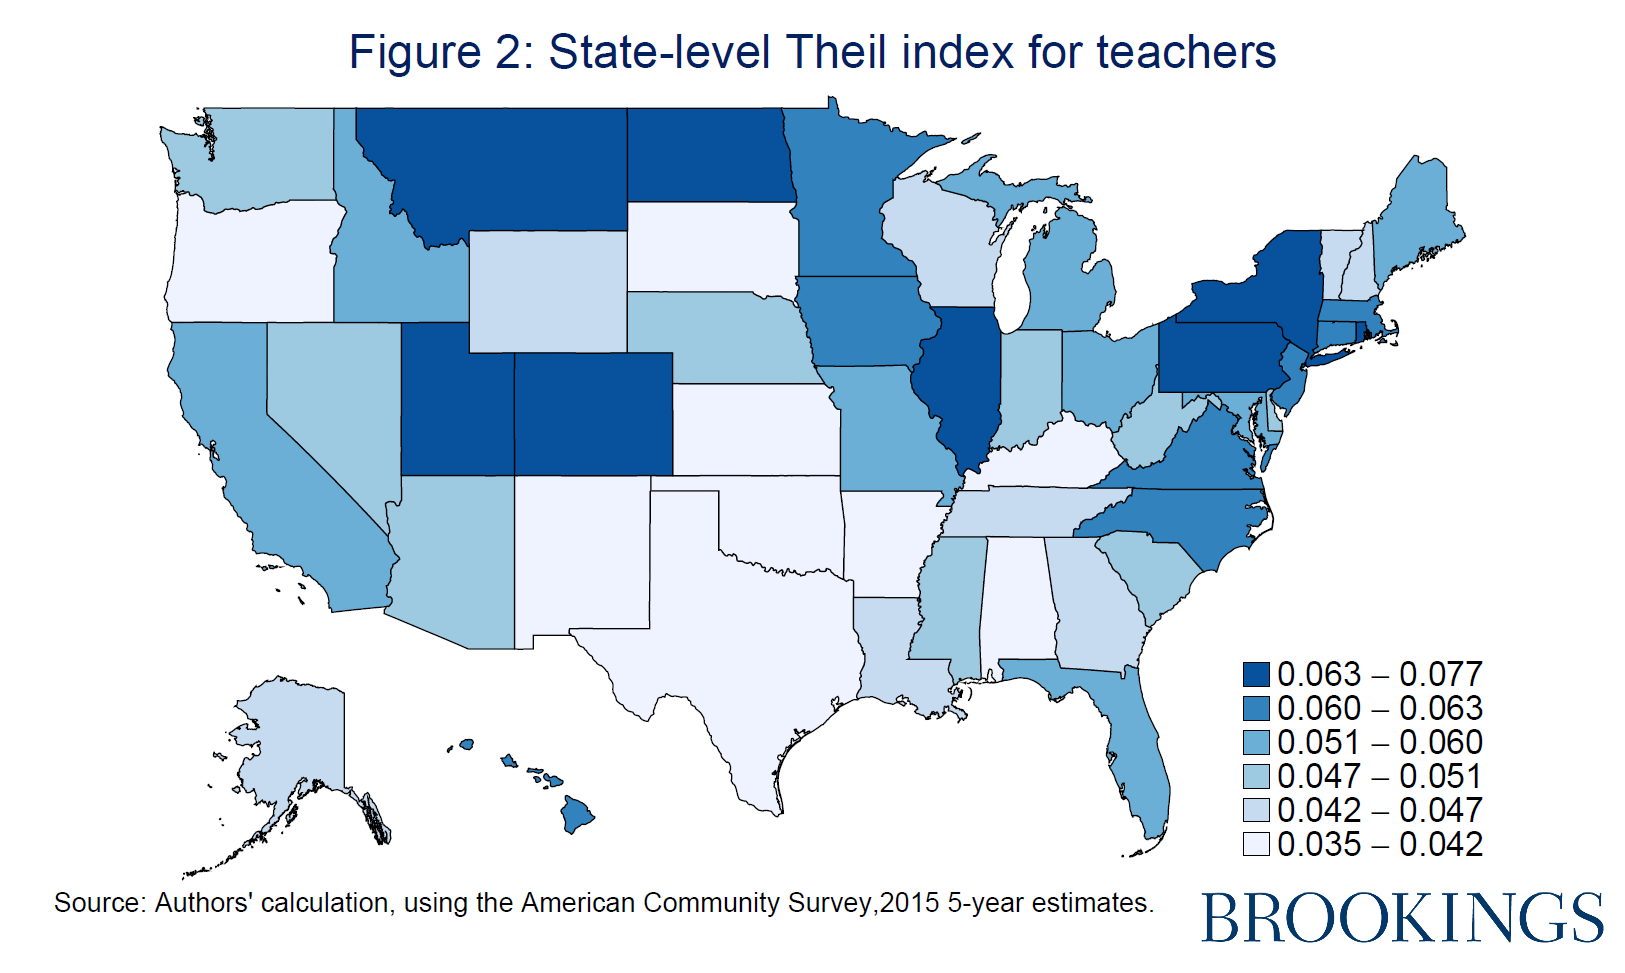
In light of the relatively large share of inequality we find due to states, it is informative to explore how inequalities vary across states. Figure 2 presents a map of state-level Theil index values for teachers. Interestingly, wage inequalities do not systematically differ in familiar ways. For example, some states with high levels of wage inequality are associated with industrial strength and union influence (states in the Northeast and Illinois) while others are far less populous without such influences (states like Utah and Montana). While the South is commonly associated with historical racial inequalities, these states show some of the lowest levels of wage inequalities among public school teachers.29
The two next sections of this report transition to now link these state-level measures of wage inequalities among teachers, presented above, with school funding and teachers pensions. By doing this, we attempt to explore the connection, often overlooked, between the salary schedule and other aspects of school funding.
Salary schedule and school funding inequalities
The salary schedule is mechanically related to school funding inequalities within districts. Schools employing more experienced teachers, holding staffing ratios and the salary schedule constant, will spend somewhat more on salaries than schools employing more junior teachers. Research has long documented novice teachers are more likely to teach in schools with greater concentrations of low-income and minority students.30 Combining the uneven distribution of teachers with a prescribed salary schedule means schools with a larger share of low-income students (and a high number of novice teachers) spend less money on teacher salaries than schools with more affluent students (and more veteran teachers).31 This fact played a central role in the debate behind the U.S. Department of Education’s proposed 2016 rule to the supplement-not-supplant provisions of Title I of the Every Student Succeeds Act.32
School funding also varies considerably across districts. Historically, funding for public schools has come primarily from state and local revenues. Because local dollars are derived mainly from property taxes, inequalities in school funding began to appear as regional inequalities emerged, and white families moved into suburbs where property values were higher, while black families remained in the cities.33 As property wealth continues to be unequally distributed among school districts within a state, local funding remains uneven. For instance, in Connecticut, per-student local revenues are more than $3,000 lower in school districts serving poor students than in school districts serving students that are more affluent.34
To counteract regressive local funding, 35 states have enacted policies that increase the resources available to districts serving more low-income students.35 However, the progressivity of state funding has not been enough to mitigate inequalities among school districts. Nationwide, the highest poverty districts receive 10 percent less per student in state and local sources than the lowest-poverty districts. Some scholars argue that this difference rises to 18 percent when funding is adjusted to account for the additional needs that low-income students have.36
Looking beneath the national figures to examine state-level spending, roughly half of all states distribute relatively less local and state funding to the poorest districts than they do to districts that are more affluent.37 Looking at the two extremes, four states (Maryland, South Dakota, Ohio, and Delaware) provide 5 percent or more dollars per pupil to the highest poverty districts, while five states (Michigan, New York, Texas, Pennsylvania, and Illinois) result in 15 percent more spending per pupil in the wealthiest districts.38
Federal contributions, which accounts for 9 percent of total school funding, provides extra support to school districts serving students in high concentrations of poverty through the Title I program and has further contributed to reduce local funding disparities. When federal dollars are included, just three states (Illinois, Wyoming, and Nevada) spend less money per student in their poorest districts than in their most affluent districts.39
Evidence on wage inequalities and school funding
We hypothesize wage inequalities among teachers are associated with school funding inequalities in the state (excluding federal contributions). Because more than 50 percent of total education spending nationwide goes to instructional costs (primarily teacher salaries),40 we posit that excess state and local revenues distributed to relatively affluent districts would enable teacher salary schedules in those districts to be more generous, and this provides an opportunity for wage inequality to manifest.
Before examining that relationship directly, though, it is relevant to consider how our measure of wage inequalities across states compares with teachers’ average salaries. To this point, we have considered inequalities in how salaries are distributed across teachers, though we have not commented on the overall level of teacher pay. Using salary schedules does not guarantee teachers are paid fairly in comparison to other professionals. Indeed, there is considerable evidence that teachers are relatively undercompensated, considering their level of education and professional responsibilities; moreover, recent analysis suggests the wage penalty for teaching has increased in recent years.41
Yet, average teacher salaries vary considerably across states and examining how that variation interacts with salary inequalities is illuminating. There is no direct relationship between average salaries and the distribution of those salaries across teachers, though we suspect a relationship may exist if unions advocate at the behest of median members, who tend to be relatively more experienced and educated than non-members.42 Indeed, we find state-level wage inequalities across teachers and state-level average teacher salaries are positively correlated (correlation coefficient: 0.43).43
Having established this positive relationship, we now move to directly examine the relationship between teacher salary inequalities and school funding inequalities. Our measure of school funding inequalities follows that presented in a recent Education Trust report, calculated the following way:44

This ratio represents the percentage gap in state and local revenues per student between school districts serving the most and the fewest students in poverty. A negative value implies that the highest poverty districts receive less in state and local funds per student than the lowest poverty districts (i.e., high inequality). We correlate this measure against the Theil index on teacher wage inequality in each state, and present our results in Figure 3.
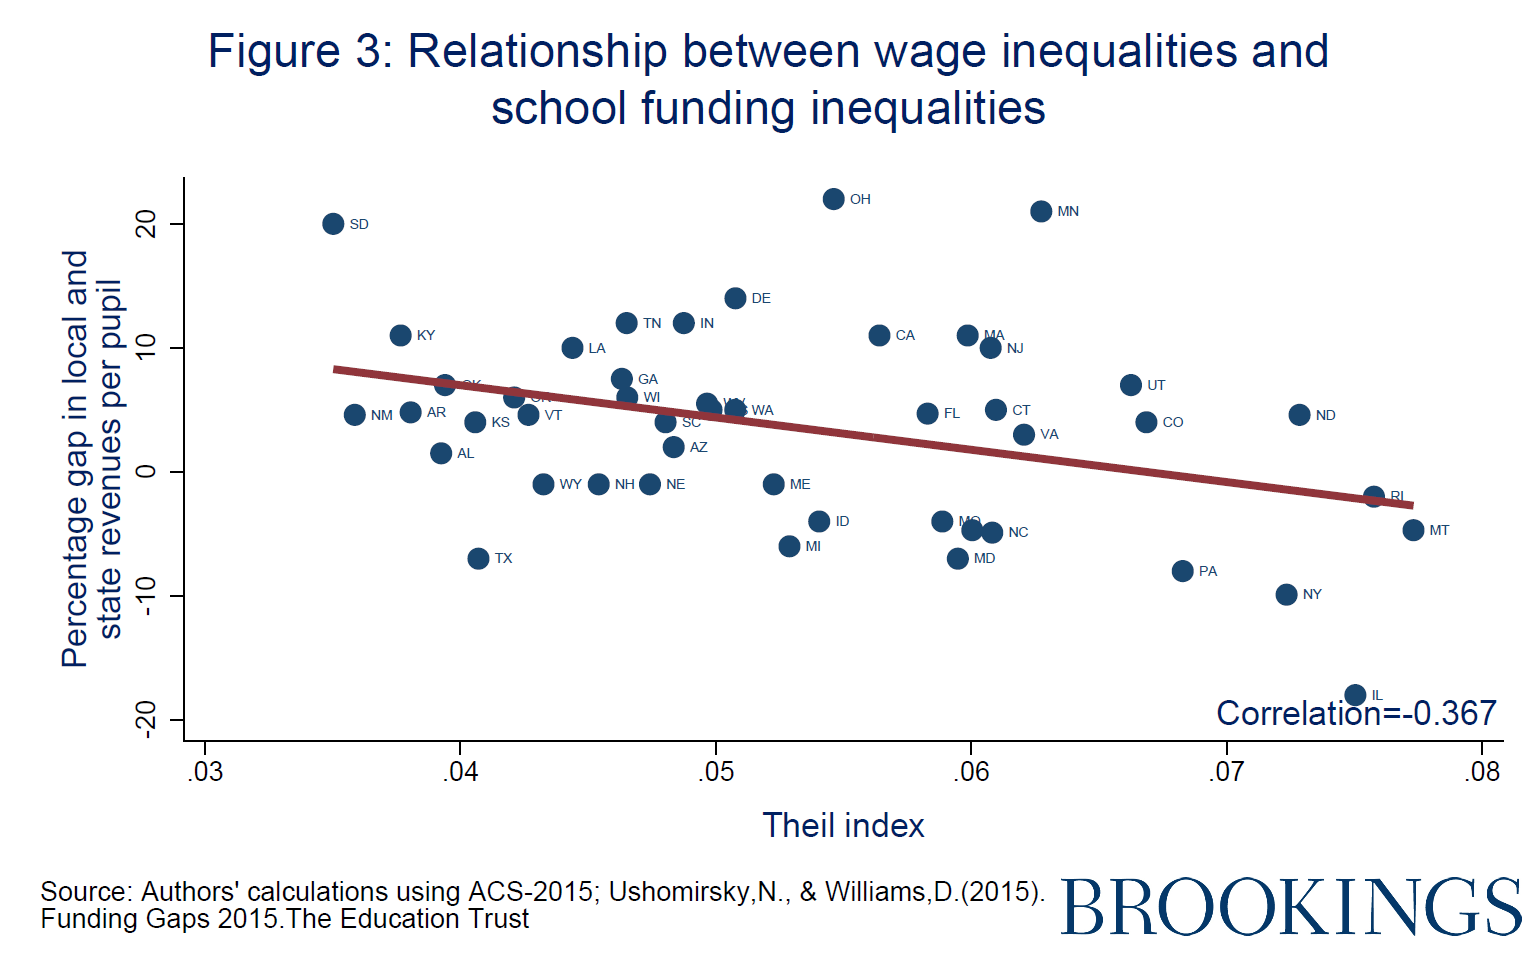
As we hypothesized, states with higher Theil Index values (greater salary inequality among teachers) tend to allocate less funding per pupil to school districts serving the most number of students in poverty than to school districts serving more affluent students (correlation coefficient: -0.37). We cannot be sure of the direction of the causal relationship between these variables, or whether both measures share a common cause, but the relationship is large and statistically significant.
Back-loaded schedules feed into unequal pensions
Back-loaded salary schedules also have direct implications on teachers’ pension benefits. Public pension systems have their own special set of problems, and among policy analysts are commonly criticized for both unequally redistributing pension resources across teachers and increasing states’ long-term (often underfunded) liabilities.
Approximately 90 percent of public school teachers work in locales that offer defined-benefit retirement plans, which guarantee a fixed amount of benefits to retirees regardless of the amount of contributions by teachers or employers.45 Moreover, teachers are particularly dependent on the health of their pensions because 15 states do not contribute to Social Security for state employees (including teachers),46 and therefore few have other retirement supports.
Related Content


Pension systems offer benefits that typically generously compensate long-term teachers at the expense of short-term teachers. Most teachers will never get any retirement benefit from their time teaching, as most states require a vesting period of three to five years (up to 10 years in some states) before teachers can claim even a minimal retirement benefit.47 The modern teaching workforce is more mobile than in decades past—both across professions and across states48—and therefore, the pension system built on assumptions of stable careers and locations fails to serve the majority of teachers who spend some, but not all, of their careers in the classroom.
Even among those who stay in their state and the classroom long enough to vest in the pension system, resources are distributed unevenly because pension benefit calculations typically contain multipliers that jump at predetermined intervals (e.g., at 25 years of service).49 These jumps translate to sharp increases in pension value very late in teachers’ careers, while those with slightly shorter careers receive significantly less.50 Studies have estimated a median teacher must work for 25 or more years before the pension benefit received from the state meets or exceeds the expected value of the employer pension contributions made on the teacher’s behalf during those years.51
In addition to their unequal distribution among teachers, many pension systems are flirting with insolvency. Fund managers’ optimistic actuarial assumptions about performance, combined with the political realities of offering enhancements in good times but avoiding cuts in bad times, have contributed to many state pension funds now being severely underfunded.52
Now, as baby boomers retire from the workforce in greater numbers, outflows of retiree benefits exceed inflows of contributions from active teachers and their district employers. The gap is filled by taking on additional pension debts that are, in turn, amortized by future teacher and employer contributions. These increasing amortization costs for mounting pension debts have been slowly increasing over the past two decades and now account for nearly 70 percent of employer retirement costs; this is equivalent to more than 10 percent of spending on teachers’ salaries.53
As of 2016, states have accrued pension debts in the cumulative amount of $516 billion.54 To respond to the increasing debt, states have reformed their pension plans, including increasing their vesting period length, raised teacher’s contributions, increased retirement age, and changed multipliers.55 Yet, in the aggregate, these reforms disproportionately make it harder for short- to moderate-term teachers to access pension benefits, while only making marginal changes to benefits for teachers retiring after a full career. In other words, these reforms have reinforced pension inequalities.
The relationship between wage inequality and pensions
We hypothesize that teachers’ wage inequalities will correspond to inequalities in teacher pension benefits. Our hypothesis is motivated by the fact that pension benefit calculations, typically based on a teacher’s peak career salary, by definition comes from the extreme end of the teacher salary distribution. Assuming a constant pension fund value, more unequal compensation for teachers will result in higher benefits for pensioners but will require the state to restrict the benefits to fewer teachers to remain solvent.
We seek to test this hypothesis with pension data. Unfortunately, authoritative national data on teacher pensions is scarce, and no public micro-level data exists to our knowledge.56 Consequently, for this report we are compelled to use state-level pension measures instead of individual data. Our main sources of information includes public data reported by TeacherPensions.org, a project of Bellwether Education Partners aimed at providing analysis and commentary about public teacher pensions.
We use the following variables related to pension inequalities:
- Transfer value to equalize pension benefits: This is a measure we developed using the average benefit for new retirees and the percentage of new teachers who will not be eligible for a pension.57 The product of these two variables represent the amount each eligible teacher would need to transfer to ineligible teachers to equalize benefits across all teachers. This is the most direct measure of pension inequality that we can calculate, given the available data. A larger transfer value represents greater inequalities, all things equal.
- Maximum savings penalty:58 This is the maximum amount of employer contributions a teacher will forfeit by leaving the classroom or state before vesting. A larger savings penalty typically suggests a longer vesting period in which fewer teachers qualify for vesting in the state’s pension plan (i.e., due to restricting the eligible pool) after the state made significant contributions on their behalf. Thus, larger maximum savings penalties represent greater inequalities.
Though these two measures represent some dimension of inequality, they are not perfect measures. Because we are using state-level pension measures and not individual data, our numbers may still be masking important variation among individuals within states. Nonetheless, we hypothesize that these two pension inequality measures will be positively correlated with wage inequalities among teachers at the state level. We correlate these two measures against the Theil index in each state; Figures 4a and 4b present our results (click to enlarge).
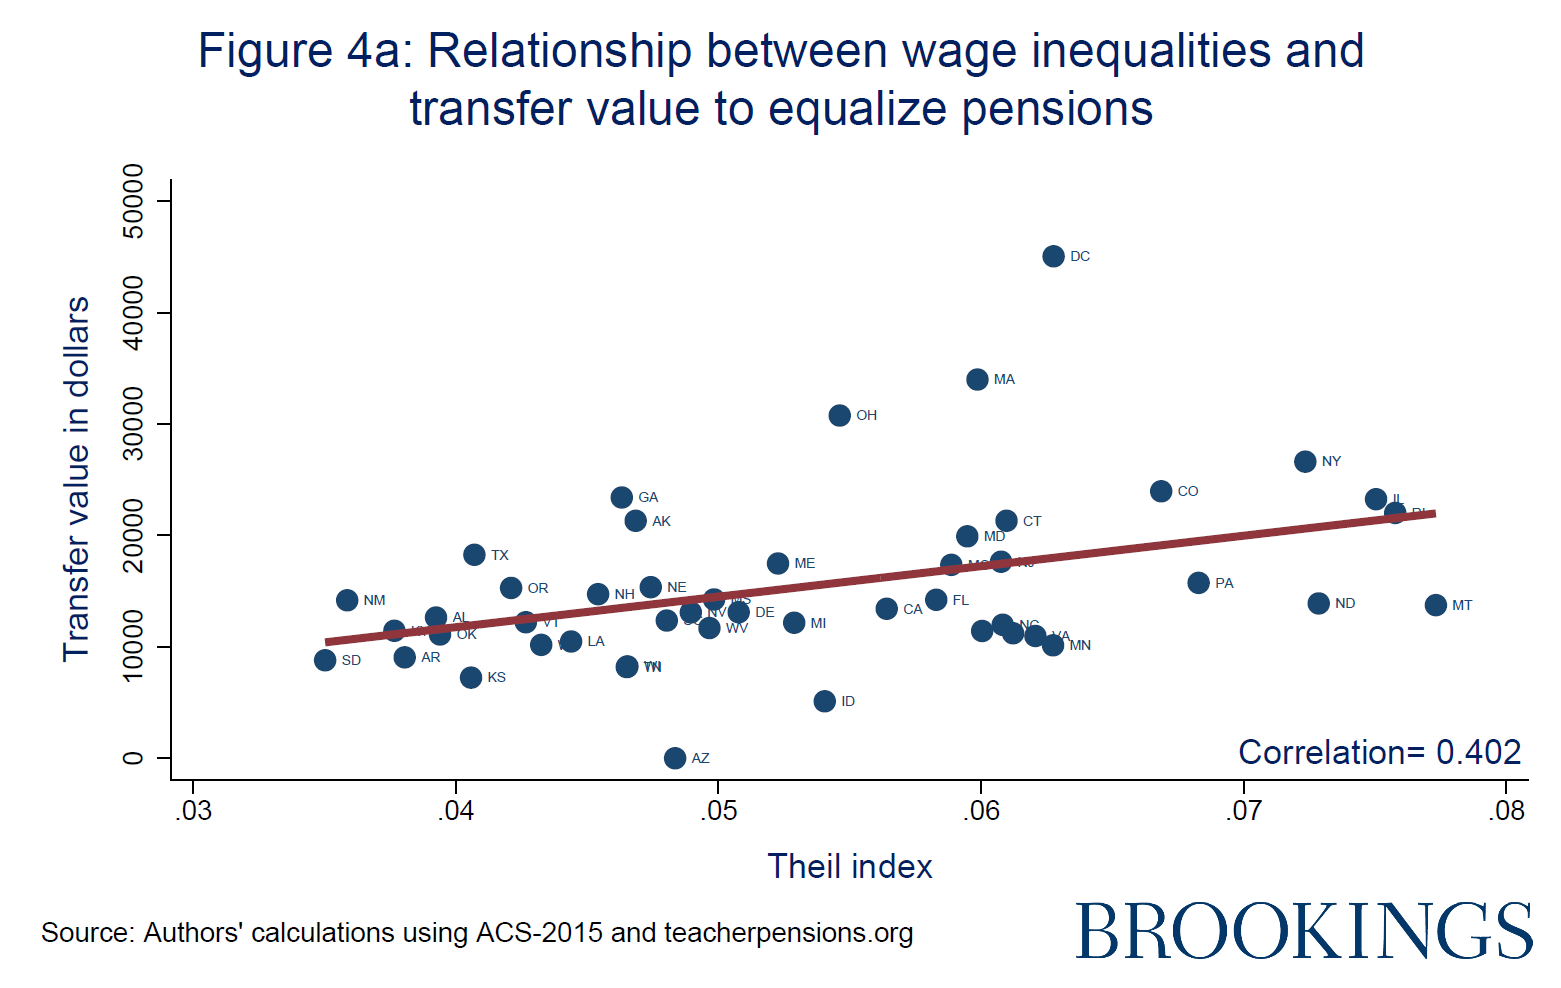
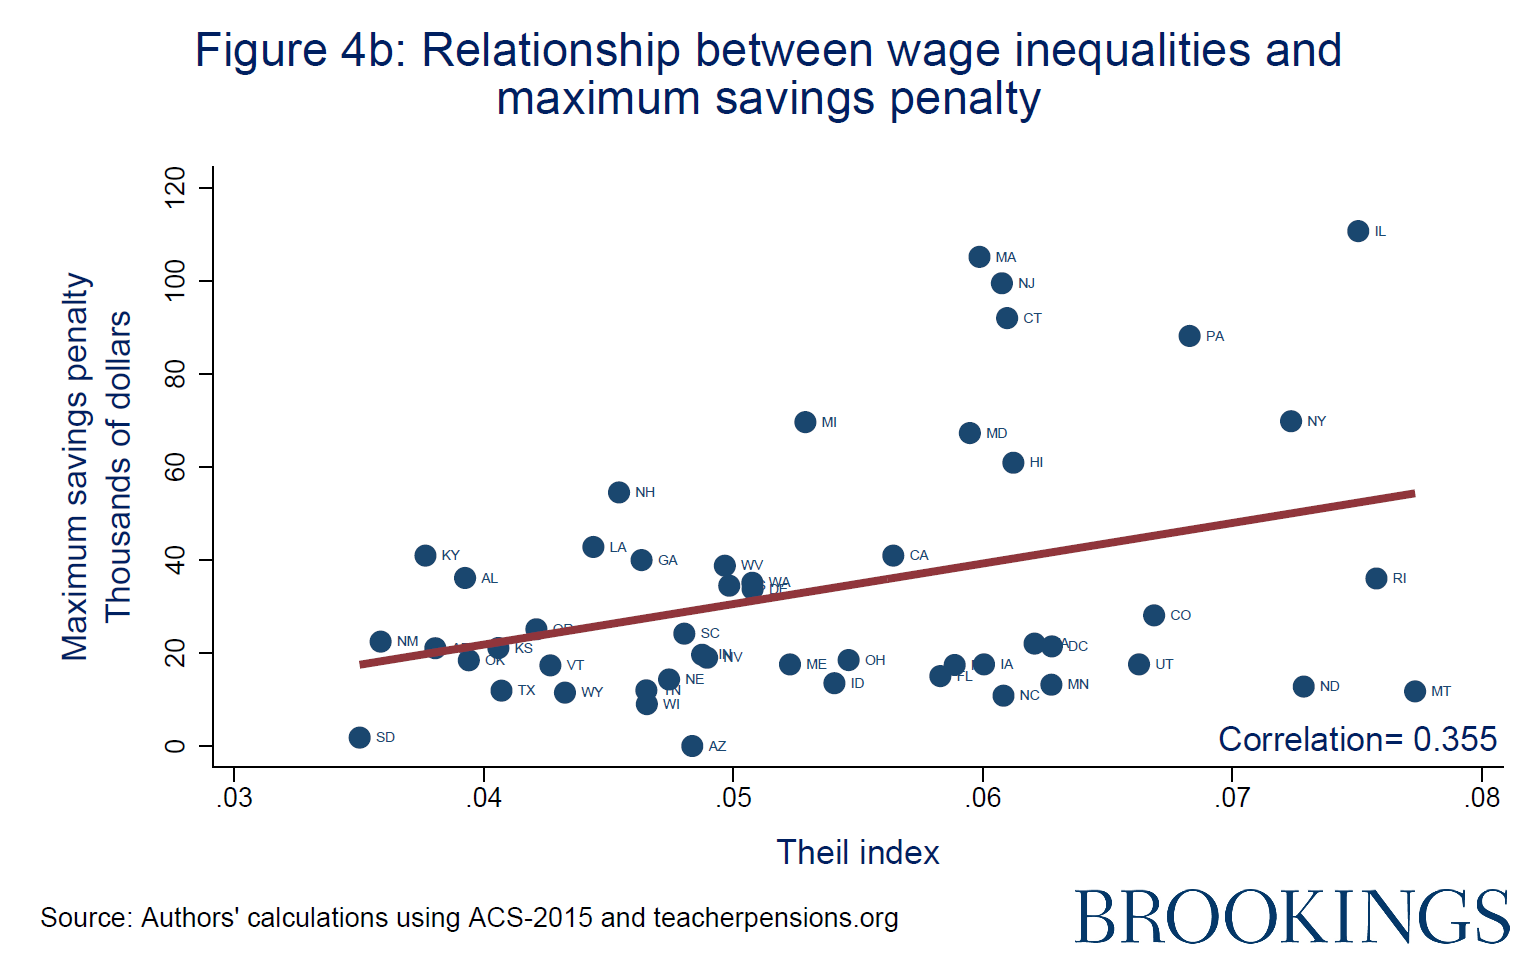
We find that states with greater wage inequalities among teachers, measured by the Theil index, tend to have greater pension inequalities. Both the transfer value required to equalize pension benefits and the average maximum savings penalty are strongly correlated with wage inequalities, both showing correlation coefficients across states in excess of 0.35.59
Discussion and Implications
The teacher salary schedule has long attracted criticism for the artificial ways in which teachers are differentially compensated, yet has been venerated due to its perceived fairness. In this report, we have shown that wage inequalities among public school teachers are low overall and show some unique characteristics in comparison to how workers in other occupations are compensated. In addition, we also find a correlation between state-level inequalities among teacher salaries and inequalities in school funding across high- and low-income districts as well as inequality measures in teacher pension benefits.
We want to be clear that this evidence provides a descriptive snapshot of salary inequalities among teachers and their relationship with other inequality measures. However, we stop short of providing any prescriptive recommendations about the optimal level of inequality among teachers. Rather, we feel the value of this evidence is to help reveal underlying patterns across these dimensions to inform policy debates in light of ongoing discussions to reform either teacher pay, school finances, or pensions.
To that end, we interpret these findings to have four important implications.
- Connected inequalities demand more holistic solutions. Based on how school funding and pension systems work, we expect a connection with teacher salaries, though the finding that inequalities are correlated across all three sectors is new and important. Scholars, advocates, and policymakers typically consider policy changes in these domains in isolation without directly seeing the relationships among them. Therefore, further exploration of reforms on any one of these dimensions should be carried out in a more holistic way in the future. Since teacher salary schedules are arguably the first steps in determining financing and pension allocations further down the chain, closer scrutiny of wage inequalities first may reveal insights into inequalities arising in school funding and pensions.
- Salary schedules—from starting wages through points later in a teacher’s career—influence the number of teachers in the workforce by attracting and retaining them. Though the extent of the nationwide teacher shortage is disputed,60 the fact that a wave of retiring baby boomer teachers continues to create more vacancies in schools across the U.S. is not. This continuing trend makes the need to attract more individuals into the profession even more acute. These discussions warrant greater attention in school districts serving mostly low-income students, as these schools face the most difficulty in staffing their schools.
- Our findings demonstrate teacher compensation is unique among professions, but it’s not clear it needs to be. This misalignment with other professions, coupled with the research demonstrating misalignment with productive factors suggest more scrutiny of teacher compensation is warranted. For example, both state policies and teachers unions have blocked differentiating teacher compensation for things like teaching in high-demand subjects or in high-need school settings,61 but this type of price discrimination would be an expedient way to address many of the persistent teacher vacancies districts increasingly face. Modest shifts to better align salary schedules with outside wages or signals of productivity, rather than steps and lanes based on age and education, may also alleviate some of these pressures.
- We should keep in mind that how we pay teachers influences who comes to teach. Our exploration of this issue was initially motivated by a hypothesis that wage inequalities may be lurking behind the lack of minority representation in the work force;62 though we find little evidence of wage inequalities on race/ethnicity among teachers, our results suggest that inequalities on other dimensions may still be important. Further, it may be the rigidity of the salary schedule in the face of differing working conditions or responsibilities that contributes to the low minority-teacher representation we see in the teacher workforce.
Suggested citation: Hansen, M., & Quintero, D. (2017). “Scrutinizing equal pay for equal work among teachers.” The Brookings Institution. Washington, D.C.
Authors


-
Footnotes
- We acknowledge that our use of the word “inequality” in our discussion of teacher salaries may feel inappropriate to some readers, as differences in teacher wages are not necessarily something policymakers should feel compelled to equalize. We agree that minimizing all inequalities is not the desired outcome, as we expect wage differences to arise for a variety of reasons (e.g., teachers have different sets of skills, productivity levels, or work in different contexts). Yet, to the extent that salary differences arise for reasons misaligned with reasonable expectations, we feel they warrant further scrutiny. Accordingly, our use of the term “inequality” is not intended to convey a necessarily negative outcome, though it could be.
- Chetty, R., Friedman, J., & Rockoff, J. (2014). “Measuring the Impacts of Teachers II: Teacher Value-Added and Student Outcomes in Adulthood.” American Economic Review, 104(9), 2633-79.
- For instance, in D.C., the negotiation between former school chancellors and union leaders to introduce a new contract that included performance pay took more than two years: http://www.npr.org/templates/story/story.php?storyId=125684008. Buck and Green argue that interest groups have blocked several states’ efforts to institute merit pay for teachers. In other cases, unions make the program temporary or dissuade local districts from participating in the statewide programs. (Buck, S. & Greene, J.P. (2011, spring). “Blocked, Diluted, and Co-Opted.” Education Next, http://educationnext.org/files/ednext_20112_Buck.pdf.
- Teachers can often supplement incomes through taking on extra duties—for example, leading extracurricular activities or teaching summer school classes—though these supplements are generally modest. Additionally, some districts in recent years have begun to experiment with offering additional pay along other dimensions (e.g., bonuses for excellence in teaching, working in hard-to-staff schools or subject areas).
- Kelley, C., & Odden, A. (1995). “Reinventing Teacher Compensation Systems.” Consortium for Policy Research in Education. Retrieved from http://www.cpre.org/images/stories/cpre_pdfs/fb06.pdf.
- Kelley & Odden, 1995; Margo, R.A. (1990). Race and Schooling in the South, 1880-1950: An Economic History. Chicago: University of Chicago Press.
- Gray, L., Bitterman, A., & Goldring, R. (2013). “Characteristics of Public School Districts in the United States: Results from the 2011-12 Schools and Staffing Survey. First Look.” U.S. Department of Education. Washington, D.C.: National Center for Education Statistics. Retrieved from https://nces.ed.gov/pubs2013/2013311.pdf, Table 2.
- Salary schedules are determined at the state level in 17 states, and another three states have minimum salaries for teachers codified in state law. Griffith, M. (2016). “State Teacher Salary Schedules.” Education Commission of the States. Policy Analysis. Retrieved from http://www.ecs.org/ec-content/uploads/State-Teacher-Salary-Schedules-1.pdf.
- Teacher contracts are a well-known example of an economic problem known as a multitask moral hazard problem, first described in Holmstrom, B. & Milgrom, P. (1991). “Multitask Principal-Agent Analyses: Incentive Contracts, Asset Ownership, and Job Design.” Journal of Law, Economics, & Organization, 7(special issue), 24-52. While output-based contracts are generally deemed as more economically efficient, the authors show fixed salary contracts could actually be more efficient if the tasks are sufficiently complex and difficult to measure with fidelity.
- Jacob, B. (2005). “Accountability, Incentives And Behavior: The Impact Of High-Stakes Testing In The Chicago Public Schools.” Journal of Public Economics, 2005, 89(5-6), 761-796.; Koretz, D. (2002). “Limitations in the Use of Achievement Tests as Measures of Educators’ Productivity.” The Journal of Human resources, 37(4), 752-777; Jacob, B, & Levitt, S.D. (2003). “Rotten Apples: An Investigation of the Prevalence and Predictors of Teacher Cheating.” The Quarterly Journal of Economics, 118(3), 843-877.
- Dixit, A. (2002). “Incentives and Organizations in the Public Sector: An Interpretative Review.” The Journal of Human Resources, 37(4), 696-727.
- National Council on Teacher Quality. (2010). “Restructuring Teacher Pay to Reward Excellence.” Washington, D.C.
- Rivkin, E., Hanushek, E.A., & Kain, J.F. (2005). “Teachers, Schools, and Academic Achievement.” Econometrica, 73(2), 417-458; Aaronson, D., Barrow, L., Sander, W. (2007). “Teachers and Student Achievement in the Chicago Public High Schools.” Journal of Labor Economics, 25(1) 95-135; Goldhaber, D. & Brewer, D. (1998). “When Should we Reward Degrees for Teachers?” The Phi Delta Kappan, 80(2), 134,136-138.
- Clotfelter, C.T., Ladd, H.F., Vigdor, J.L. (2006). “Teacher–student matching and the assessment of teacher effectiveness.” Journal of Human Resources, 41 (4), 778–820.
- Ladd, H.F. & Sorensen, L.C. (2017). “Returns to Teacher Experience: Student Achievement and Motivation in Middle School.” Education Finance and Policy, 12(2), 241-279.
- Rockoff, J.E. (2004). “The Impact of Individual Teachers on Student Achievement: Evidence from Panel Data.” The American Economic Review, 94(2), 247-252.
- Papay, J.P., & Kraft, M.A. (2015). “Productivity Returns to Experience in the Teacher Labor Market: Methodological Challenges and New Evidence on Long-Term Career Improvement.” Journal of Public Economics, 130, 105-119.
- Vigdor, J. (2008, fall). “Scrap the Sacrosanct Salary Schedule.” EducationNext, 8(4). Retrieved from http://educationnext.org/scrap-the-sacrosanct-salary-schedule/.
- Roza, M. (2015). “Breaking Tradition: A Fixed-Dollar Pay Raise Strategy that Benefits Teachers and School Districts.” Rapid Response paper series, Edunomics Lab. Georgetown University, and National Council on Teacher Quality. (2010). “Restructuring Teacher Pay to Reward Excellence.” Washington, D.C.
- Roza, M. (2015); Vigdor, J. (2008).
- Goldhaber, D. (2009). “The politics of teacher pay reform.” In Springer, M. (ed.) Performance Incentives: Their Growing Impact on American K-12 Education, (pp. 25-42). Brookings Institution Press. Goldhaber, D., DeArmond, M., & DeBurgomaster, S. (2011). “Teacher Attitudes About Compensation Reform: Implications for Reform Implementation.” ILR Review, 64(3), 441-463; Prince, C.D. (2002). “Higher Pay in Hard-to-Staff Schools: The case for financial incentives.” American Association of Schools Administrators, Arlington, VA.
- Dee, T., & Goldhaber. D. (2017). “Understanding and Addressing Teacher Shortages in the United States.” The Hamilton Project at The Brookings Institution. Washington, D.C.
- West, K.L., & Mykerezi, E. (2011). “Teachers’ unions and compensation: The impact of collective bargaining on salary schedules and performance pay schemes.” Economics of Education Review, 30, 99-108; Moe, T. (2003). “The Politics of the Status Quo.” In Peterson, P.E. (ed.) In Our Schools & Our Future…are we still at risk? Stanford, CA: Hoover Institution Press; Buck, S. & Greene, J.P. (2011, spring).
- The Integrated Public Use Microdata Series (IPUMS) provided the census data. Steven Ruggles, Katie Genadek, Ronald Goeken, Josiah Grover, and Matthew Sobek. Integrated Public Use Microdata Series: Version 6.0 [2015, 5 year estimates]. Minneapolis: University of Minnesota, 2015.
- We restrict our analysis sample to full-time workers, between 25 and 65 years old with at least a bachelor’s degree. Following Rickman, 2013, full-time workers are individuals who worked at least 35 hours per week for at least 27 weeks during the previous year and whose wage income is $6,581 or greater. We exclude individuals who report being self-employed or unpaid family members. The final sample is comprised of 1,698,105 individuals, where 150,346 (8.8 percent) are public school teachers.
- The sample size for the other occupations is: 18,052 private school teachers, 43,397 postsecondary teachers, 12,143 education administrators, 30,608 social workers, 43,932 registered nurses, 34,062 lawyers, and 29,010 physicians/surgeons.
- Startz, D. (2016, May). “What do Teachers do when they Leave Teaching?” Brown Center Chalkboard, The Brookings Institution, Washington, D.C. Retrieved from https://www.brookings.edu/blog/brown-center-chalkboard/2016/05/09/what-do-teachers-do-when-they-leave-teaching/.
- In a similar exercise using the Schools and Staffing Survey, 2012, we find that the share of overall inequality accounted for by experience is 27 percent and by education is 15 percent. Wage inequalities based on state and locale are 32 percent and 9 percent, respectively. Sex and gender inequalities are close to zero.
- A careful reader may see that the value for the Theil index across the U.S. presented in Figure 1 (0.07) falls in the highest category of the state-specific measures presented here in Figure 2. This is because a significant share of the inequality observed across the U.S. is due to state-level differences, and after removing these differences (as these within-state measures do), the resulting Theil indices are correspondingly smaller in value.
- Gagnon, D., & Mattingly, M. (2012). “Beginning teachers are more common in Rural, High-Poverty, and Racially Diverse Schools.” Carsey Institute. Issue Brief No.53. Retrieved from http://scholars.unh.edu/cgi/viewcontent.cgi?article=1172&context=carsey. Hanushek, E.A., Kain, J.F., & Rivkin, S.G. (2004). “Why Public Schools Lose Teachers.” The Journal of Human Resources, 24(2), 326-354.
- Knight, D. S. (2016). “Are school districts allocating resources equitably? Teacher experience gaps and the Every Student Succeeds Act.” CERPS Working Paper 2016-2. University of Texas at El Paso, El Paso, TX.
- See, for example, the U.S. Department of Education (August 2016). “Fact Sheet: Supplement-not-Supplant under Title I of the Every Student Succeeds Act.” https://www.ed.gov/news/press-releases/fact-sheet-supplement-not-supplant-under-title-i-every-student-succeeds-act.
- Semuels, A. (August, 2016). “Good school, Rich School; Bad School, Poor School.” The Atlantic. https://www.theatlantic.com/business/archive/2016/08/property-taxes-and-unequal-schools/497333/.
- Chingos, M., & Blagg, K. (2017). “Do Poor Kids get their Fair Share of School Funding?” The Urban Institute. Washington, D.C. Retrieved from http://www.urban.org/sites/default/files/publication/90586/school_funding_brief.pdf.
- Edbuild. Funded: Student Poverty Report. Policies in each state. Retrieved from http://funded.edbuild.org/national#formula-type.
- Ushomirsky, N., & Williams, D. (2015). “Funding gaps 2015: Too many states still spend less on educating students who need the most.” The Education Trust. Washington, D.C.
- Chingos, M., & Blagg, K. (2017).
- Ushomirsky, N., & Williams, D. (2015). These results are adjusted by the additional needs that low-income students have.
- Chingos, M., & Blagg, K. (2017).
- U.S. Department of Education, National Center for Education Statistics, Biennial Survey of Education in the United States, 1919-20 through 1949-50; Statistics of State School Systems, 1959-60 and 1969-70; Revenues and Expenditures for Public Elementary and Secondary Education, 1979-80; and Common Core of Data (CCD), “National Public Education Financial Survey,” 1989-90 through 2013-14. Table 236.10, https://nces.ed.gov/programs/digest/d16/tables/dt16_236.10.asp.
- Allegretto, S. & Mishel, L. (2016). “The Teacher Pay Gap is Wider than Ever.” Economic Policy Institute. Washington, D.C.; Startz, R. (2010). Profit of Education, Praeger.
- Kaufman, B.E., & Martinez-Vazquez, J. (1990). “Monopoly, Efficient Contract, and Median Voter Models of Union Wage Determination: A Critical Comparison,” Journal of Labor Research, 11(4), 401-423.
- Given this relationship between average salaries and wage inequality across states, we are unsurprised to find a positive correlation between high per-pupil spending on education in a state (from all sources) and our measure of teacher salary inequalities (correlation coefficient: 0.31).
- We used the calculations reported by Ushomirsky, N., & Williams, D. (2015). “Funding gaps 2015: Too many states still spend less on educating students who need the most.” The Education Trust. Washington, D.C.
- Aldeman, C., & Robson, K. (2017) “Why Most Teachers Get a Bad Deal on Pensions.” EducationNext. Retrieved from http://educationnext.org/why-most-teachers-get-bad-deal-pensions-state-plans-winners-losers/.
- Aldeman, C., Rotherham, A.J. (2014). “Friends without benefits: How states systematically shortchange teachers’ retirement and threaten their retirement security.” Bellwether Education Partners.
- Aldeman, C. (2015). “Hidden Penalties. How states shortchange early-career teachers.” Bellwether Education Partners.
- Doherty, K.M., Jacobs, S., & Madden, T.M. (2012). “No One Benefits: How Teacher Pensions Systems are Failing Both Teachers and Taxpayers.” National Council on Teacher Quality. Washington, DC
- Costrel, R.M., & Podqursky, M. (2009). “Peaks, Cliffs, and Valleys: The Peculiar Incentives in Teacher Retirement Systems and their Consequences for School Staffing,” Education Finance and Policy, 4(2), 175-211.
- Recent studies have found these uneven pension contributions by teacher experience, combined with uneven distributions of teachers across schools, results in fewer pension dollars being spent on teachers in disadvantaged school settings in comparison to those in more affluent schools. Roza, M. (2017). “The Equity Problem in Teacher Pensions. Rapid response paper series.” Edunomics Lab. Georgetown University; Marchitello, M. (2017). Illinois’ Teacher Pensions Plans Deepen School Funding Inequities. Bellwether Education Partners.
- Aldeman, C., & Johnson, R.W. (2015). “Negative Returns: How States Pensions Shortchange Teachers.” Bellwether Education Partners.; Lueken, M.F. (2017). “(No) Money in the Bank: Which Retirement Systems Penalize New Teachers?” Thomas Fordham Institute.
- Backes, B., Goldhaber, D.,Grout, C., Koedel, C., Ni, S., Podgursky, M., Xiang, P.B., & Xu, Z. (2016). “Benefit or Burden? On the Intergenerational Inequity of Teacher Pension Plans.” Educational Researcher, 45(6), 367-377.
- Aldeman, C. (2016). “The Pension Pac-Man: How Pension Debt Eats Away at Teacher Salaries.” Bellwether Education Partners; Backes, B., Goldhaber, D.,Grout, C., Koedel, C., Ni, S., Podgursky, M., Xiang, P.B., & Xu, Z. (2016).
- Doherty, K.M., Jacobs, S., & Lueken, M.F. (2017). “Lifting the Pension Fog. What teachers and taxpayers need to know about the teacher pension crisis.” National Council on Teacher Quality. Washington, D.C.
- Doherty, K.M., Jacobs, S., & Madden, T.M. (2012). “No One Benefits How Teacher Pensions Systems are Failing Both Teachers and Taxpayers.” National Council on Teacher Quality. Washington, D.C.; and Doherty, et al. 2017).
- Nationally representative surveys, including the ACS, provide some information on retirement income, however, the source of retirement income for individuals who have been out of the workforce for more than five years is unknown.
- Kan, L. (2016, August). “What is the average teacher pension in my state?” TeacherPensions.org. Retrieved from https://www.teacherpensions.org/blog/what-average-teacher-pension-my-state.
- Aldeman, C. (2015). “Hidden Penalties: How states shortchange early-career teachers.” Bellwether Education Partners.
- In addition to transfer value and maximum penalty saving, we considered other variables related to pension inequalities: the vesting period and the number of years to break even. Vesting period is the number of years a teacher must work in a school system to have claim on any employer-contributed benefits. The number of years to break even is the amount of time a teacher needs to remain on the same pension plan in order for their expected pension benefits to exceed the future value of their own contributions to the pension system (both personal and employer contributions on their behalf). Both longer vesting periods and more years to break even represent greater inequalities, as fewer teachers will receive the full benefit from the pension system. Both variables show a positive, though relatively weaker correlation with our Theil index measure of wage inequalities (0.2) in comparison to the two variables presented in the text.
- See, for example, Sutcher, L., Darling-Hammond, L., & Carver-Thomas D. (2016). “A coming crisis in teaching? Teacher supply, demand, and shortages in the U.S.” Learning Policy Institute. https://learningpolicyinstitute.org/product/coming-crisis-teaching; and Dee, T., & Goldhaber. D. (2017). “Understanding and Addressing Teacher Shortages in the United States.” The Hamilton Project. The Brookings Institution. Washington, D.C.
- Prince, C.D. (2002). “Higher Pay in Hard-to-Staff Schools: The case for financial incentives.” American Association of Schools Administrators, Arlington, VA. Goldhaber, DeArmond, & DeBurgomaster. (2011) present evidence that these differential payment policies are generally supported among teachers.
- Putman, H., Hansen, M., Walsh, K., & Quintero, D. (2016). “High Hopes and Harsh Realities. The real challenges to building a diverse workforce.” The Brookings Institution. Washington, D.C.
The Brookings Institution is committed to quality, independence, and impact.
We are supported by a diverse array of funders. In line with our values and policies, each Brookings publication represents the sole views of its author(s).