This is the time of year when the U.S. Census Bureau publishes its latest data on poverty in the United States, and headlines are presenting a mixed picture. One set of survey results found that the overall number of people living in poverty in 2022 was relatively unchanged from the last two years. In contrast, another survey found that America’s child poverty rate doubled between 2021 and 2022, largely due to the post-pandemic expiration of an expanded child tax credit. The divergent results reflect the fact that the Census Bureau measures poverty in more than one way.
Neither of these results, however, sheds much light on where poverty is rising, falling, or staying the same, and who is most affected. Ten years ago, our book, “Confronting Suburban Poverty in America,” chronicled the rapid rise of poverty in the nation’s suburbs during the 2000s. We showed the challenges the shifting geography of poverty posed for low-income Americans’ ability to access safety net services, transportation, and jobs.
Now, the Census Bureau’s latest American Community Survey (ACS)—another set of data that often flies under the public radar—offers an updated look at the landscape of poverty in 2022. After a long run of economic growth in the 2010s and more than two years into a post-pandemic economic recovery, what does the geography of poverty in America look like today?
The nation’s suburbs accounted for the majority of increases in the poor population following the onset of the pandemic
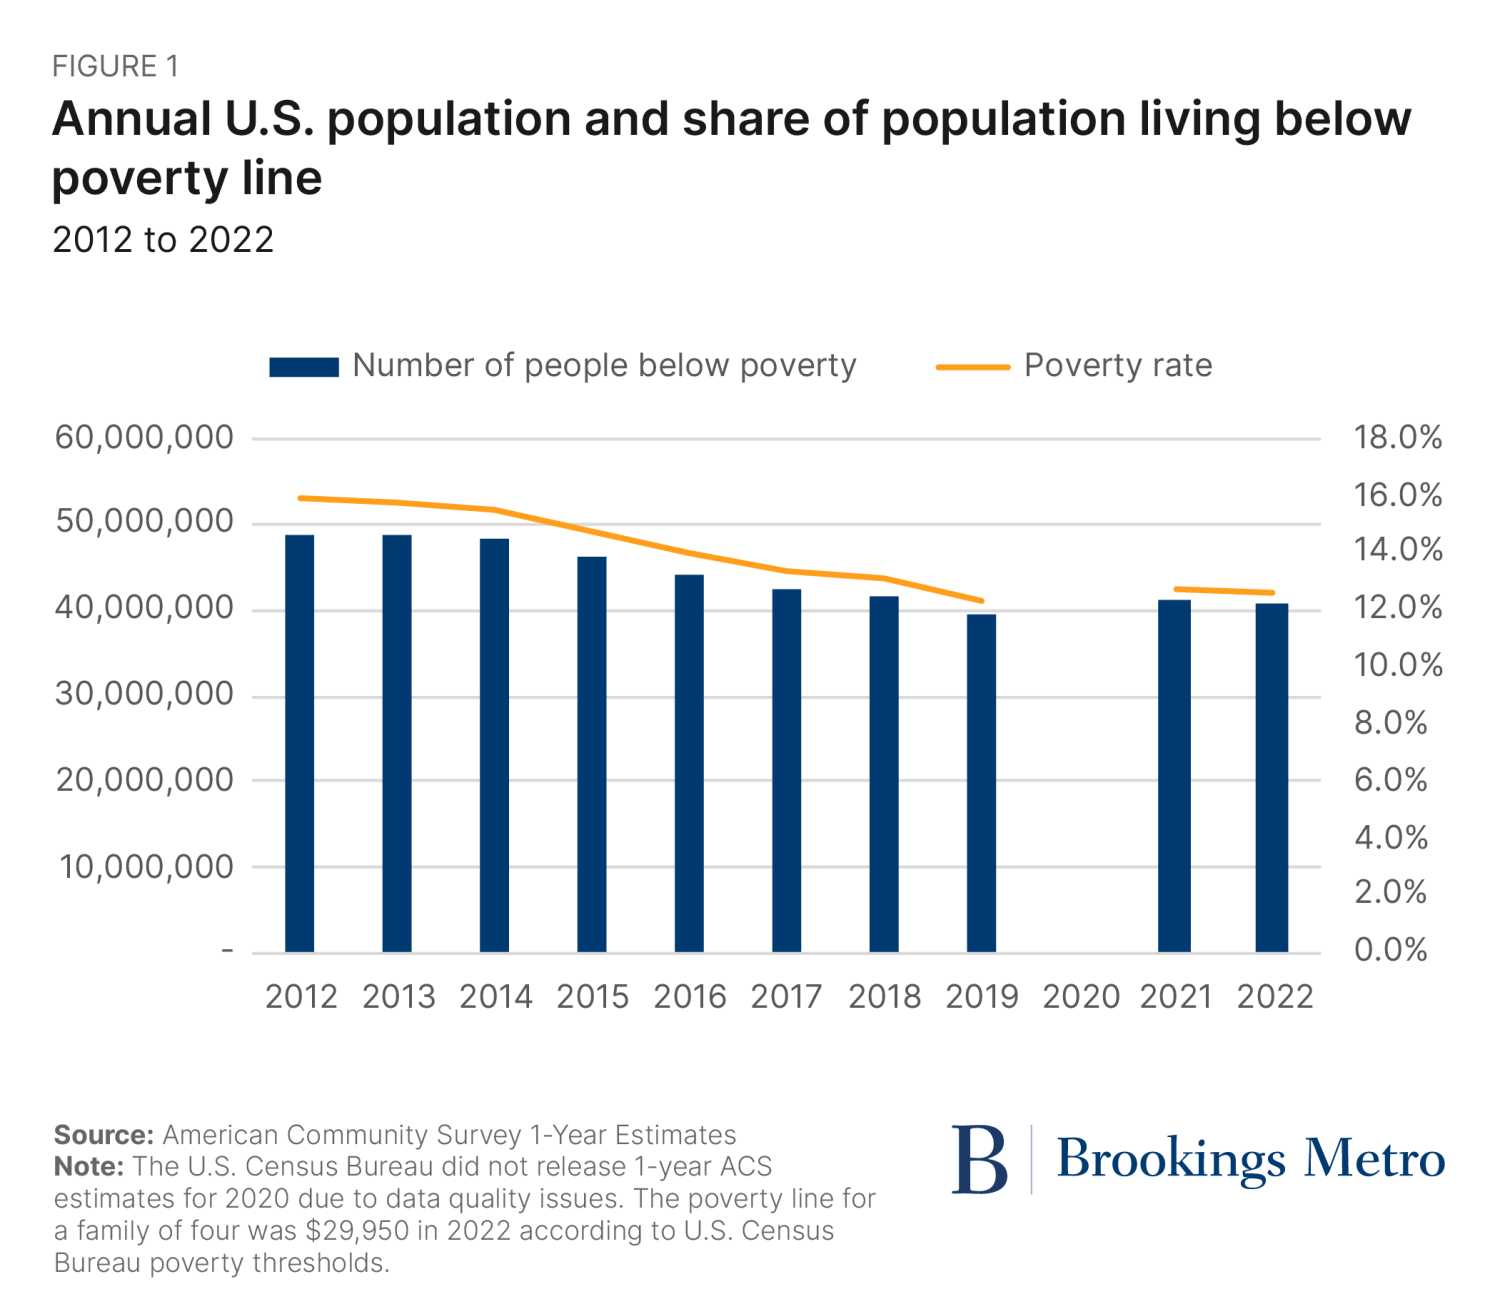
According to the latest ACS data, nearly 41 million people in the United States lived below the poverty line in 2022. That is nearly 1.5 million more people than in 2019, before the pandemic struck (Figure 1). The increase in the poor population translated into a small yet statistically significant bump in the U.S. poverty rate, from 12.3% in 2019 to 12.6% in 2022. Still, both the absolute number of people living in poverty and the share of the U.S. population in poverty sat well below their levels from the early 2010s, in the wake of the Great Recession.
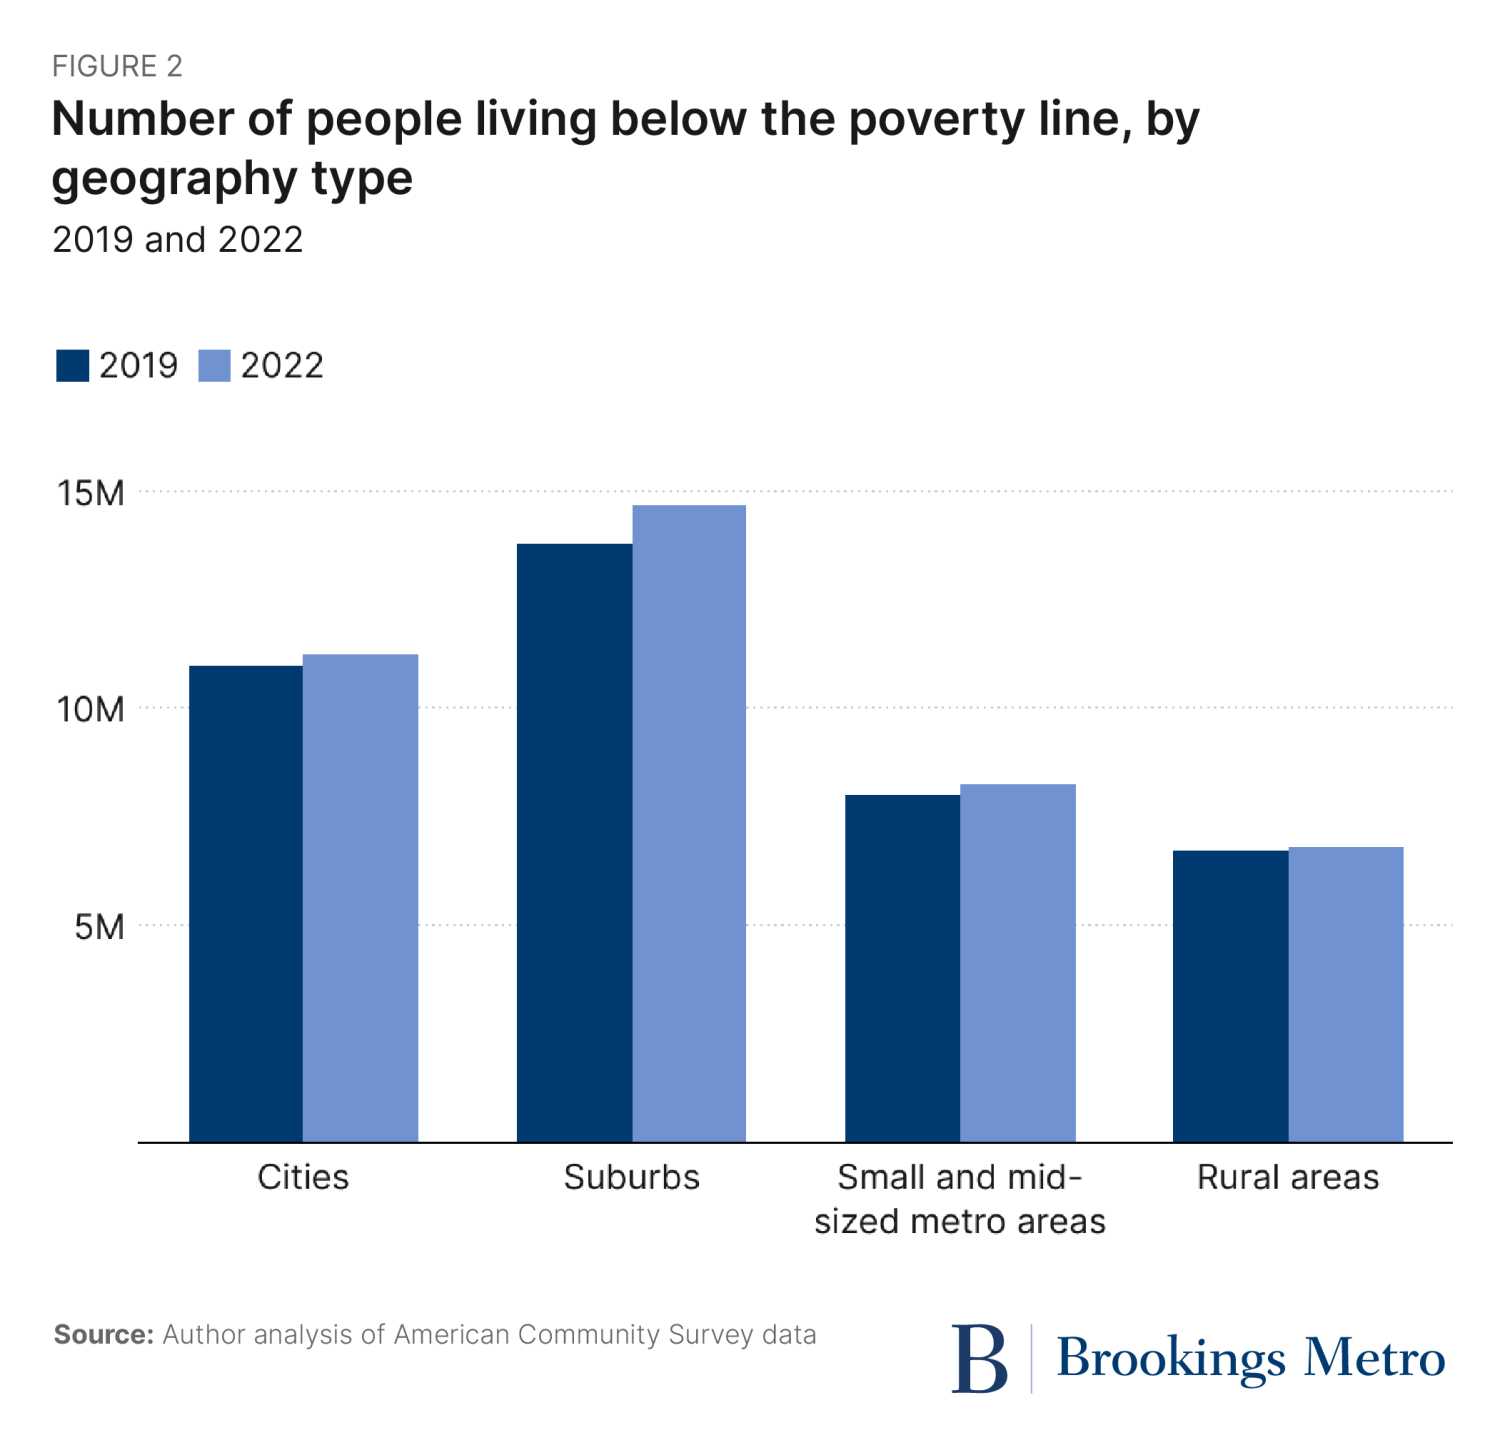
Of that 1.5 million person increase in Americans living below the poverty line, more than 60% occurred in suburbs. The U.S. is a suburban nation—more people live in suburbs (47%) than in cities (21%), small and midsized metro areas (18%), or rural areas (14%).1 And between 2019 and 2022, the poor population in major metropolitan suburbs grew three times as fast as in major cities (6% versus 2%). Major metro areas in the West (e.g., Ogden, Utah and San Francisco), South (e.g., Washington, D.C. and Houston), and Midwest (e.g., St. Louis and Minneapolis-Saint Paul) posted double-digit percentage increases in their suburban poor populations over this period. (See the appendix for detailed data.)
Fewer suburbs experienced falling poverty rates than cities
As urban and suburban poor populations increased, so did poverty rates (the share of the total population living below the poverty line) in both large cities and their surrounding suburbs. In 2022, roughly one in 10 suburban residents lived in poverty (9.6%), compared to about one in six in primary cities (16.2%). Those rates represented increases of less than half a percentage point over 2019 (0.3 percentage points for suburbs and 0.4 percentage points for large cities).
Over this same period, 25 major metro areas posted statistically significant increases in their suburban poverty rates, and 25 saw significant increases in their urban poverty rates. Only six metro areas had increases in both their urban and suburban poverty rates: Chicago, Detroit, Houston, New York, Ogden, Utah, and San Francisco. As our colleague William H. Frey has shown, several of these metro areas shed both city and suburban population during the 2019-2022 pandemic period.
In contrast, 19 major metro areas saw their urban poverty rates decline between 2019 and 2022, led by Grand Rapids, Mich., Buffalo, N.Y., and Knoxville, Tenn. But only 12 major metro areas posted statistically significant declines in their suburban poverty rates following the pandemic. By and large, those declines reflected overall (non-poor) population growth rather than declines in the number of people living in poverty; no major metro area registered a statistically significant decline in its suburban poor population over this period. For example, the total number of residents in Provo, Utah’s suburbs grew by 13% between 2019 and 2022. That rapid population growth, even as the region’s poor population remained statistically unchanged, led Provo’s suburban poverty rate to fall by 2.2 percentage points.
America continues to confront suburban poverty
A year after the release of “Confronting Suburban Poverty in America,” we wrote that recovery from the Great Recession “did not hit the reset button” on the landscape of poverty. By 2014, the worst effects of the recession had receded, yet the shift of poverty toward the nation’s suburbs had not. The same remains true in the wake of the pandemic recession. Whatever trajectory U.S. poverty follows in the coming years, it’s increasingly clear that the “new geography of poverty” we chronicled a decade ago is here to stay.
Much of our book detailed the challenges of addressing this geography of poverty when so much key infrastructure—such as policies targeted to low-income communities, the social service capacity for deploying key work supports, and the transportation networks that shape access to employment opportunities—historically has been concentrated in urban areas. We articulated the need for more cross-jurisdictional strategies that could grapple with the regional scale at which major metropolitan labor and housing markets function.
For all the economic pain it wrought, the COVID-19 pandemic also induced a massive federal response to alleviate need at the local level. Counties, cities, and towns of all sizes—including thousands in suburban America—received direct aid to help workers, households, and students whose lives the pandemic upended. While that aid was time-limited, it surely opened more suburban leaders’ eyes to the hardships many of their residents continue to face even after the emergency has subsided.
Sustaining efforts to address economic hardship once pandemic-era federal funding runs dry will take creativity, collaboration, and commitment in the face of competing priorities. But as the latest data makes clear, American poverty remains a growing suburban challenge, and solutions to overcome it must take root there as well.
Authors


Related Content
-
Acknowledgements and disclosures
Co-author Elizabeth Kneebone is assistant vice president of community development research at the Federal Reserve Bank of San Francisco. The views expressed here are those of the authors and do not necessarily reflect the views of the Federal Reserve Bank of San Francisco or the Federal Reserve System.
-
Footnotes
- This analysis delineates “primary cities” and “suburbs” for metropolitan statistical areas (MSAs) with populations over 500,000. Primary cities include the first-named city in the official MSA title plus any other incorporated place in the title with a population of 100,000 or more. Suburbs make up the remainder of the MSA outside of primary cities. “Small and midsized metro areas” include all other MSAs with populations below 500,000. “Rural areas” represent non-metropolitan counties. Among the 113 MSAs with populations above 500,000, seven have primary cities with insufficient population or data to be included in 1-year ACS estimates. Those MSAs are excluded from the city/suburb analysis.
The Brookings Institution is committed to quality, independence, and impact.
We are supported by a diverse array of funders. In line with our values and policies, each Brookings publication represents the sole views of its author(s).