Part II of the 2015 Brown Center Report on American Education
Over the next several years, policy analysts will evaluate the impact of the Common Core State Standards (CCSS) on U.S. education. The task promises to be challenging. The question most analysts will focus on is whether the CCSS is good or bad policy. This section of the Brown Center Report (BCR) tackles a set of seemingly innocuous questions compared to the hot-button question of whether Common Core is wise or foolish. The questions all have to do with when Common Core actually started, or more precisely, when the Common Core started having an effect on student learning. And if it hasn’t yet had an effect, how will we know that CCSS has started to influence student achievement?
The analysis below probes this issue empirically, hopefully persuading readers that deciding when a policy begins is elemental to evaluating its effects. The question of a policy’s starting point is not always easy to answer. Yet the answer has consequences. You can’t figure out whether a policy worked or not unless you know when it began.[i]
The analysis uses surveys of state implementation to model different CCSS starting points for states and produces a second early report card on how CCSS is doing. The first report card, focusing on math, was presented in last year’s BCR. The current study updates state implementation ratings that were presented in that report and extends the analysis to achievement in reading. The goal is not only to estimate CCSS’s early impact, but also to lay out a fair approach for establishing when the Common Core’s impact began—and to do it now before data are generated that either critics or supporters can use to bolster their arguments. The experience of No Child Left Behind (NCLB) illustrates this necessity.
Background
After the 2008 National Assessment of Educational Progress (NAEP) scores were released, former Secretary of Education Margaret Spellings claimed that the new scores showed “we are on the right track.”[ii] She pointed out that NAEP gains in the previous decade, 1999-2009, were much larger than in prior decades. Mark Schneider of the American Institutes of Research (and a former Commissioner of the National Center for Education Statistics [NCES]) reached a different conclusion. He compared NAEP gains from 1996-2003 to 2003-2009 and declared NCLB’s impact disappointing. “The pre-NCLB gains were greater than the post-NCLB gains.”[iii] It is important to highlight that Schneider used the 2003 NAEP scores as the starting point for assessing NCLB. A report from FairTest on the tenth anniversary of NCLB used the same demarcation for pre- and post-NCLB time frames.[iv] FairTest is an advocacy group critical of high stakes testing—and harshly critical of NCLB—but if the 2003 starting point for NAEP is accepted, its conclusion is indisputable, “NAEP score improvement slowed or stopped in both reading and math after NCLB was implemented.”
Choosing 2003 as NCLB’s starting date is intuitively appealing. The law was introduced, debated, and passed by Congress in 2001. President Bush signed NCLB into law on January 8, 2002. It takes time to implement any law. The 2003 NAEP is arguably the first chance that the assessment had to register NCLB’s effects.
Selecting 2003 is consequential, however. Some of the largest gains in NAEP’s history were registered between 2000 and 2003. Once 2003 is established as a starting point (or baseline), pre-2003 gains become “pre-NCLB.” But what if the 2003 NAEP scores were influenced by NCLB? Experiments evaluating the effects of new drugs collect baseline data from subjects before treatment, not after the treatment has begun. Similarly, evaluating the effects of public policies require that baseline data are not influenced by the policies under evaluation.
Avoiding such problems is particularly difficult when state or local policies are adopted nationally. The federal effort to establish a speed limit of 55 miles per hour in the 1970s is a good example. Several states already had speed limits of 55 mph or lower prior to the federal law’s enactment. Moreover, a few states lowered speed limits in anticipation of the federal limit while the bill was debated in Congress. On the day President Nixon signed the bill into law—January 2, 1974—the Associated Press reported that only 29 states would be required to lower speed limits. Evaluating the effects of the 1974 law with national data but neglecting to adjust for what states were already doing would obviously yield tainted baseline data.
There are comparable reasons for questioning 2003 as a good baseline for evaluating NCLB’s effects. The key components of NCLB’s accountability provisions—testing students, publicizing the results, and holding schools accountable for results—were already in place in nearly half the states. In some states they had been in place for several years. The 1999 iteration of Quality Counts, Education Week’s annual report on state-level efforts to improve public education, entitled Rewarding Results, Punishing Failure, was devoted to state accountability systems and the assessments underpinning them. Testing and accountability are especially important because they have drawn fire from critics of NCLB, a law that wasn’t passed until years later.
The Congressional debate of NCLB legislation took all of 2001, allowing states to pass anticipatory policies. Derek Neal and Diane Whitmore Schanzenbach reported that “with the passage of NCLB lurking on the horizon,” Illinois placed hundreds of schools on a watch list and declared that future state testing would be high stakes.[v] In the summer and fall of 2002, with NCLB now the law of the land, state after state released lists of schools falling short of NCLB’s requirements. Then the 2002-2003 school year began, during which the 2003 NAEP was administered. Using 2003 as a NAEP baseline assumes that none of these activities—previous accountability systems, public lists of schools in need of improvement, anticipatory policy shifts—influenced achievement. That is unlikely.[vi]
The Analysis
Unlike NCLB, there was no “pre-CCSS” state version of Common Core. States vary in how quickly and aggressively they have implemented CCSS. For the BCR analyses, two indexes were constructed to model CCSS implementation. They are based on surveys of state education agencies and named for the two years that the surveys were conducted. The 2011 survey reported the number of programs (e.g., professional development, new materials) on which states reported spending federal funds to implement CCSS. Strong implementers spent money on more activities. The 2011 index was used to investigate eighth grade math achievement in the 2014 BCR. A new implementation index was created for this year’s study of reading achievement. The 2013 index is based on a survey asking states when they planned to complete full implementation of CCSS in classrooms. Strong states aimed for full implementation by 2012-2013 or earlier.
Fourth grade NAEP reading scores serve as the achievement measure. Why fourth grade and not eighth? Reading instruction is a key activity of elementary classrooms but by eighth grade has all but disappeared. What remains of “reading” as an independent subject, which has typically morphed into the study of literature, is subsumed under the English-Language Arts curriculum, a catchall term that also includes writing, vocabulary, listening, and public speaking. Most students in fourth grade are in self-contained classes; they receive instruction in all subjects from one teacher. The impact of CCSS on reading instruction—the recommendation that non-fiction take a larger role in reading materials is a good example—will be concentrated in the activities of a single teacher in elementary schools. The burden for meeting CCSS’s press for non-fiction, on the other hand, is expected to be shared by all middle and high school teachers.[vii]
Results
Table 2-1 displays NAEP gains using the 2011 implementation index. The four year period between 2009 and 2013 is broken down into two parts: 2009-2011 and 2011-2013. Nineteen states are categorized as “strong” implementers of CCSS on the 2011 index, and from 2009-2013, they outscored the four states that did not adopt CCSS by a little more than one scale score point (0.87 vs. -0.24 for a 1.11 difference). The non-adopters are the logical control group for CCSS, but with only four states in that category—Alaska, Nebraska, Texas, and Virginia—it is sensitive to big changes in one or two states. Alaska and Texas both experienced a decline in fourth grade reading scores from 2009-2013.
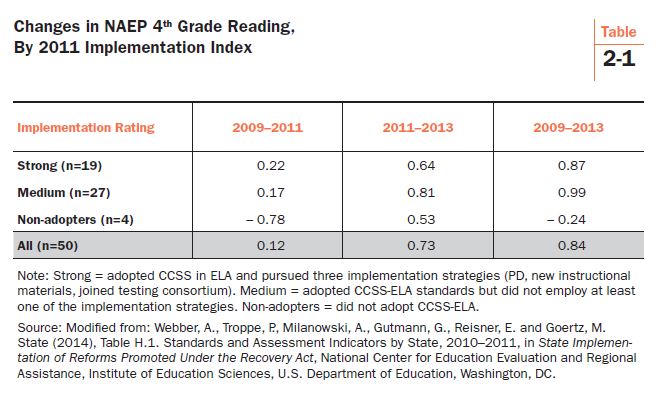
The 1.11 point advantage in reading gains for strong CCSS implementers is similar to the 1.27 point advantage reported last year for eighth grade math. Both are small. The reading difference in favor of CCSS is equal to approximately 0.03 standard deviations of the 2009 baseline reading score. Also note that the differences were greater in 2009-2011 than in 2011-2013 and that the “medium” implementers performed as well as or better than the strong implementers over the entire four year period (gain of 0.99).
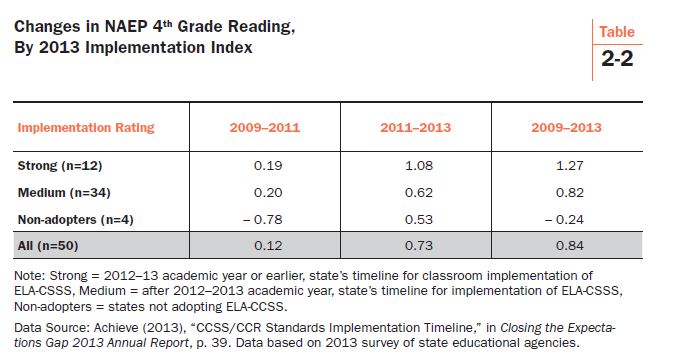
Table 2-2 displays calculations using the 2013 implementation index. Twelve states are rated as strong CCSS implementers, seven fewer than on the 2011 index.[viii] Data for the non-adopters are the same as in the previous table. In 2009-2013, the strong implementers gained 1.27 NAEP points compared to -0.24 among the non-adopters, a difference of 1.51 points. The thirty-four states rated as medium implementers gained 0.82. The strong implementers on this index are states that reported full implementation of CCSS-ELA by 2013. Their larger gain in 2011-2013 (1.08 points) distinguishes them from the strong implementers in the previous table. The overall advantage of 1.51 points over non-adopters represents about 0.04 standard deviations of the 2009 NAEP reading score, not a difference with real world significance. Taken together, the 2011 and 2013 indexes estimate that NAEP reading gains from 2009-2013 were one to one and one-half scale score points larger in the strong CCSS implementation states compared to the states that did not adopt CCSS.
Common Core and Reading Content
As noted above, the 2013 implementation index is based on when states scheduled full implementation of CCSS in classrooms. Other than reading achievement, does the index seem to reflect changes in any other classroom variable believed to be related to CCSS implementation? If the answer is “yes,” that would bolster confidence that the index is measuring changes related to CCSS implementation.
Let’s examine the types of literature that students encounter during instruction. Perhaps the most controversial recommendation in the CCSS-ELA standards is the call for teachers to shift the content of reading materials away from stories and other fictional forms of literature in favor of more non-fiction. NAEP asks fourth grade teachers the extent to which they teach fiction and non-fiction over the course of the school year (see Figure 2-1).
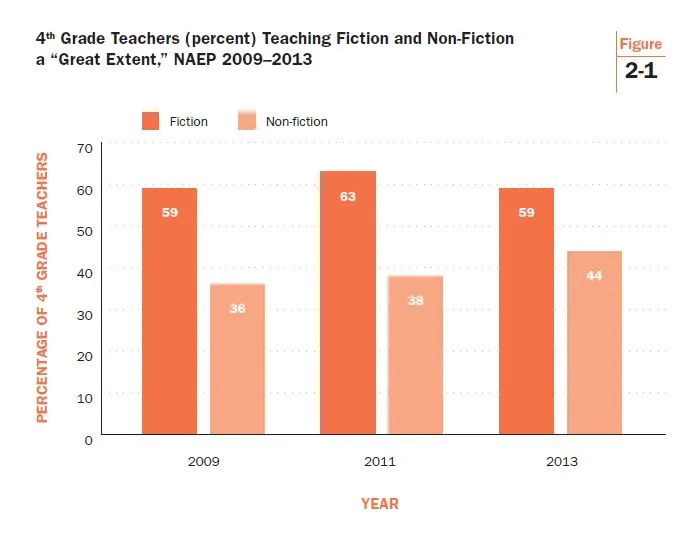
Historically, fiction dominates fourth grade reading instruction. It still does. The percentage of teachers reporting that they teach fiction to a “large extent” exceeded the percentage answering “large extent” for non-fiction by 23 points in 2009 and 25 points in 2011. In 2013, the difference narrowed to only 15 percentage points, primarily because of non-fiction’s increased use. Fiction still dominated in 2013, but not by as much as in 2009.
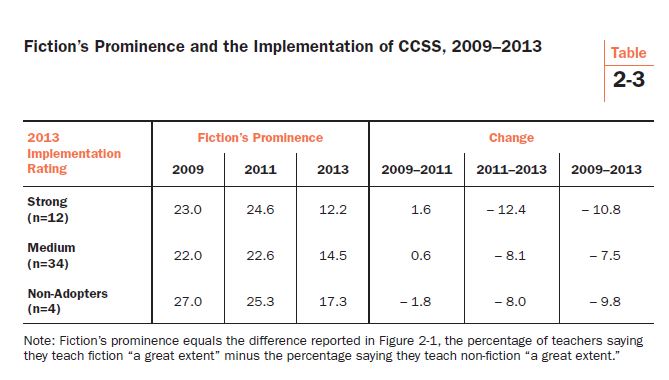
The differences reported in Table 2-3 are national indicators of fiction’s declining prominence in fourth grade reading instruction. What about the states? We know that they were involved to varying degrees with the implementation of Common Core from 2009-2013. Is there evidence that fiction’s prominence was more likely to weaken in states most aggressively pursuing CCSS implementation?
Table 2-3 displays the data tackling that question. Fourth grade teachers in strong implementation states decisively favored the use of fiction over non-fiction in 2009 and 2011. But the prominence of fiction in those states experienced a large decline in 2013 (-12.4 percentage points). The decline for the entire four year period, 2009-2013, was larger in the strong implementation states (-10.8) than in the medium implementation (-7.5) or non-adoption states (-9.8).
Conclusion
This section of the Brown Center Report analyzed NAEP data and two indexes of CCSS implementation, one based on data collected in 2011, the second from data collected in 2013. NAEP scores for 2009-2013 were examined. Fourth grade reading scores improved by 1.11 scale score points in states with strong implementation of CCSS compared to states that did not adopt CCSS. A similar comparison in last year’s BCR found a 1.27 point difference on NAEP’s eighth grade math test, also in favor of states with strong implementation of CCSS. These differences, although certainly encouraging to CCSS supporters, are quite small, amounting to (at most) 0.04 standard deviations (SD) on the NAEP scale. A threshold of 0.20 SD—five times larger—is often invoked as the minimum size for a test score change to be regarded as noticeable. The current study’s findings are also merely statistical associations and cannot be used to make causal claims. Perhaps other factors are driving test score changes, unmeasured by NAEP or the other sources of data analyzed here.
The analysis also found that fourth grade teachers in strong implementation states are more likely to be shifting reading instruction from fiction to non-fiction texts. That trend should be monitored closely to see if it continues. Other events to keep an eye on as the Common Core unfolds include the following:
1. The 2015 NAEP scores, typically released in the late fall, will be important for the Common Core. In most states, the first CCSS-aligned state tests will be given in the spring of 2015. Based on the earlier experiences of Kentucky and New York, results are expected to be disappointing. Common Core supporters can respond by explaining that assessments given for the first time often produce disappointing results. They will also claim that the tests are more rigorous than previous state assessments. But it will be difficult to explain stagnant or falling NAEP scores in an era when implementing CCSS commands so much attention.
2. Assessment will become an important implementation variable in 2015 and subsequent years. For analysts, the strategy employed here, modeling different indicators based on information collected at different stages of implementation, should become even more useful. Some states are planning to use Smarter Balanced Assessments, others are using the Partnership for Assessment of Readiness for College and Careers (PARCC), and still others are using their own homegrown tests. To capture variation among the states on this important dimension of implementation, analysts will need to use indicators that are up-to-date.
3. The politics of Common Core injects a dynamic element into implementation. The status of implementation is constantly changing. States may choose to suspend, to delay, or to abandon CCSS. That will require analysts to regularly re-configure which states are considered “in” Common Core and which states are “out.” To further complicate matters, states may be “in” some years and “out” in others.
A final word. When the 2014 BCR was released, many CCSS supporters commented that it is too early to tell the effects of Common Core. The point that states may need more time operating under CCSS to realize its full effects certainly has merit. But that does not discount everything states have done so far—including professional development, purchasing new textbooks and other instructional materials, designing new assessments, buying and installing computer systems, and conducting hearings and public outreach—as part of implementing the standards. Some states are in their fifth year of implementation. It could be that states need more time, but innovations can also produce their biggest “pop” earlier in implementation rather than later. Kentucky was one of the earliest states to adopt and implement CCSS. That state’s NAEP fourth grade reading score declined in both 2009-2011 and 2011-2013. The optimism of CCSS supporters is understandable, but a one and a half point NAEP gain might be as good as it gets for CCSS.
[i] These ideas were first introduced in a 2013 Brown Center Chalkboard post I authored, entitled, “When Does a Policy Start?”
[ii] Maria Glod, “Since NCLB, Math and Reading Scores Rise for Ages 9 and 13,” Washington Post, April 29, 2009.
[iii] Mark Schneider, “NAEP Math Results Hold Bad News for NCLB,” AEIdeas (Washington, D.C.: American Enterprise Institute, 2009).
[iv] Lisa Guisbond with Monty Neill and Bob Schaeffer, NCLB’s Lost Decade for Educational Progress: What Can We Learn from this Policy Failure? (Jamaica Plain, MA: FairTest, 2012).
[v] Derek Neal and Diane Schanzenbach, “Left Behind by Design: Proficiency Counts and Test-Based Accountability,” NBER Working Paper No. W13293 (Cambridge: National Bureau of Economic Research, 2007), 13.
[vi] Careful analysts of NCLB have allowed different states to have different starting dates: see Thomas Dee and Brian A. Jacob, “Evaluating NCLB,” Education Next 10, no. 3 (Summer 2010); Manyee Wong, Thomas D. Cook, and Peter M. Steiner, “No Child Left Behind: An Interim Evaluation of Its Effects on Learning Using Two Interrupted Time Series Each with Its Own Non-Equivalent Comparison Series,” Working Paper 09-11 (Evanston, IL: Northwestern University Institute for Policy Research, 2009).
[vii] Common Core State Standards Initiative. “English Language Arts Standards, Key Design Consideration.” Retrieved from: http://www.corestandards.org/ELA-Literacy/introduction/key-design-consideration/
[viii] Twelve states shifted downward from strong to medium and five states shifted upward from medium to strong, netting out to a seven state swing.
| « Part I: Girls, boys, and reading | Part III: Student Engagement » |
The Brookings Institution is committed to quality, independence, and impact.
We are supported by a diverse array of funders. In line with our values and policies, each Brookings publication represents the sole views of its author(s).

