Once a quarter, Federal Reserve Chair Janet Yellen and her colleagues on the Federal Open Market Committee take a thorough look at where the U.S. economy has been and then make projections for where they think it’s going. The next batch of those predictions—for unemployment, inflation, growth and interest rates—will be released on June 18. Ms. Yellen will discuss them at her quarterly press conference. The difference between the forecasts of Fed officials and those of all the other economists in the world is simple: Fed forecasts matter because Fed officials control the monetary levers that steer the economy towards its objectives of maximum sustainable employment and price stability.
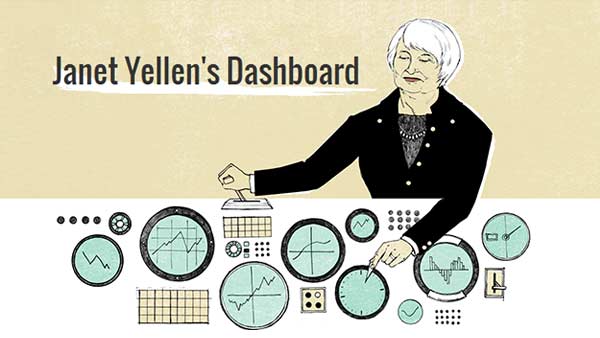
In anticipation of the June 18 Fed forecasts, the Hutchins Center on Fiscal and Monetary Policy at the Brookings Institution is launching “Janet Yellen’s Dashboard,” an on-line version of the Fed chair’s gauges that will be updated frequently.
In one interactive graphic on the Brookings’ website, the dashboard shows a dozen of the most important measures of the economy’s speed and direction. For inflation, for instance, it charts the recent trend in the Fed’s favorite inflation measure, the Personal Consumption Expenditure price index, as well as the trend in average hourly wages and the bond market’s expectations for future inflation.
We are offering a quick way for people to put themselves in Janet Yellen’s cockpit and see how the economy is doing—and to judge for themselves how well the Yellen Fed is doing in meeting the objectives that Congress has set for it. For now, inflation remains below the Fed’s 2% target and unemployment remains above the level that Fed officials deem full employment.
We hope you find this useful. Let us know what you think.
The Brookings Institution is committed to quality, independence, and impact.
We are supported by a diverse array of funders. In line with our values and policies, each Brookings publication represents the sole views of its author(s).


Commentary
Introducing Janet Yellen’s Dashboard
June 10, 2014