
The United States is home to some of the most expensive cities in the world, and middle-class residents are struggling to afford a decent life for themselves and their families. According to our latest analysis, one-third of the American middle class cannot afford the cost of basic necessities as of 2023.
Using cost-of-living estimates from the Economic Policy Institute and demographic data from the U.S. Census Bureau, this report examines the affordability of 160 U.S. metro areas for middle-class households. Middle-class households are those with incomes within the middle 60% of income earners. Our analysis finds that in each metro area, at least 20% of the middle class cannot afford to live in that place, even after adjusting income ranges to account for local price variations.
This report also examines the state of affordability for middle-class families across racial groups, finding that affordability across the country is often further out of reach for families of color. Even within the middle class, proven historical income disparities by race and ethnicity permeate: The median income for middle-class families overall is $79,000, compared to $70,000 for Black families; $73,000 for Latino or Hispanic families; $75,000 for Native American families; $81,000 for white families; and $81,200 for Asian American families.
Who is in the middle class, and what is affordability?
People may consider themselves “middle class” because of the house they grew up in, the education they attained, or a comparison of themselves to the people around them—concluding that they’re in the middle of the pack. These social indicators are important measures, but for the sake of consistency, most economists rely on income-based definitions of the middle class: typically, the middle 60% of income earners. The argument is that this middle segment of earners should be able to afford to live a comfortable life, to varying degrees.
Our definition of the middle class follows this economic assumption while also adjusting for geographic variation, following the methodology from Brookings’ Future of the Middle Class Initiative. We start with the Tax Policy Center’s income quintiles, which place the national middle class between the annual incomes of $30,000 and $153,000. We then shift these ranges up or down for all metro areas, following previous methodology that considers regional price parity (price differences across place) and average family size.1 This adjustment is based on academic and common knowledge that different cities are more expensive to live in than others, and that a family’s necessary income to be comfortably middle class will also change with the number of people in the household. For example, these adjustments shift middle-class income ranges in Youngstown, Ohio (at the lowest end) to between $24,454 and $124,716, while the income range for Los Angeles (at the highest end) shifts to between $36,561 and $186,459.
Life is considered “affordable” when a household’s income is equal to or greater than the total cost of living. We measure cost of living using the Economic Policy Institute’s Family Budget Calculator—an annually updated, inflation-adjusted estimate of the cost of basic necessities for a household depending on the number of workers and children as well as where they live. The Family Budget Calculator includes estimates for housing, food, transportation, child care, health care, taxes, and a grouping of “other necessities” such as clothes, personal care items, and household supplies. Compiling these cost-of-living estimates with anonymized microdata from the U.S. Census Bureau’s 2023 American Community Survey data, we analyze how much of middle-class incomes are spent on basic necessities across metro areas, disaggregating by race and family size.
This analysis looks at 160 metropolitan areas (cities and their surrounding suburban areas) that are home to at least 100,000 households. For racial variation within metro areas, we only provide estimates for racial groups that compose at least 100 households or more than 0.01% of the metro area population. Due to data limitations, racial and ethnic identities are determined by single-group identification of the household’s primary resident, as indicated on the census.
Affordability for the middle class varies by race
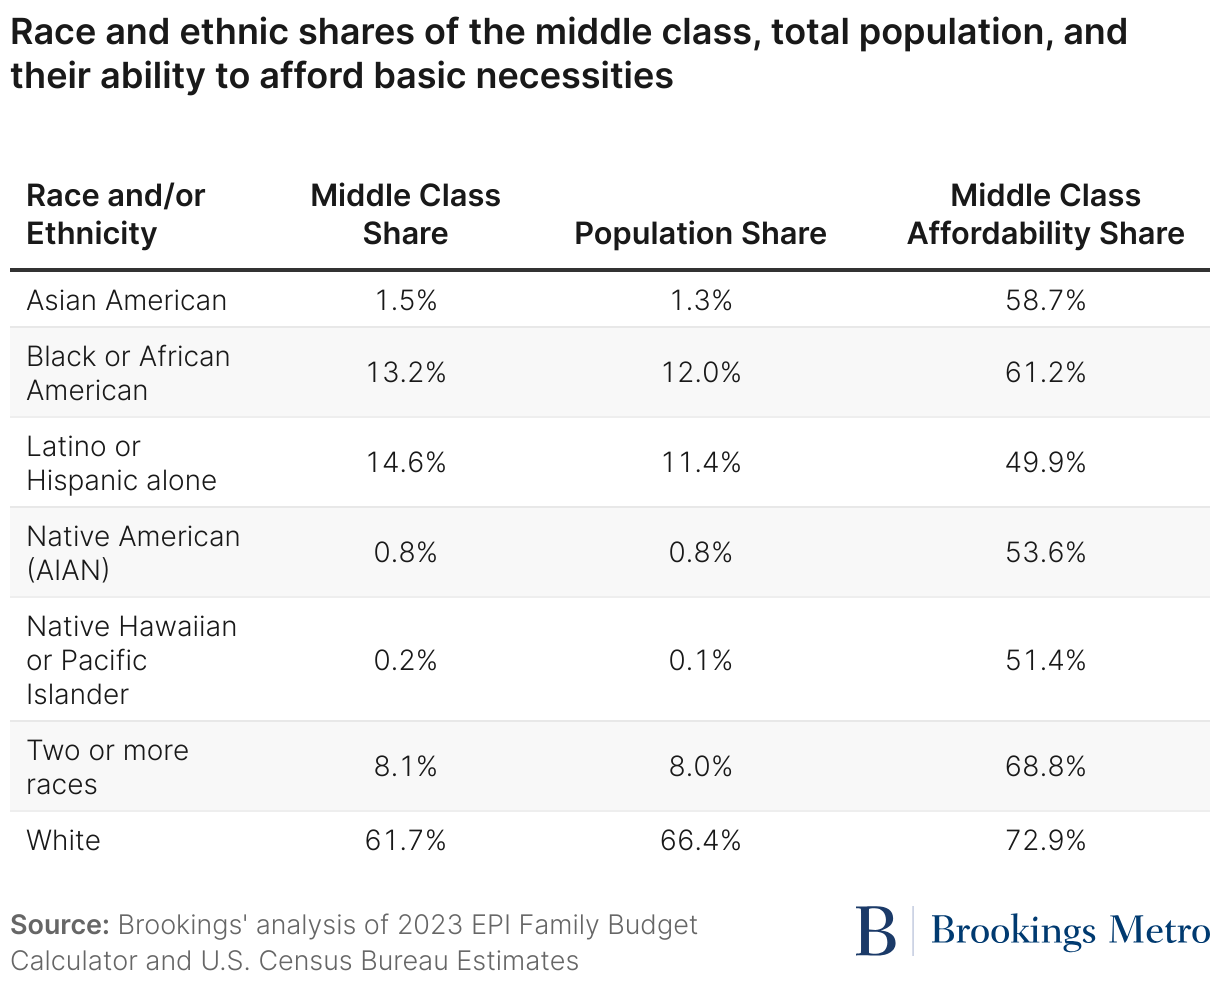
The middle class is diverse. Middle-class shares of race and ethnic groups roughly mirror those of the American population, with slightly higher shares for people of color (Asian, Black, and Latino or Hispanic Americans), and a slightly smaller share for white Americans. As journalist Jim Tankersley writes in “The Riches of This Land,” “the middle class as we understand it now is not limited to one color of collar or to any color of the skin.”
Our analysis finds the overall share of middle-class households that do not make enough to afford basic necessities where they live ranges from 23% to 57%. Therefore, a household defined by income as middle class may not feel they are middle class as they struggle to make ends meet.
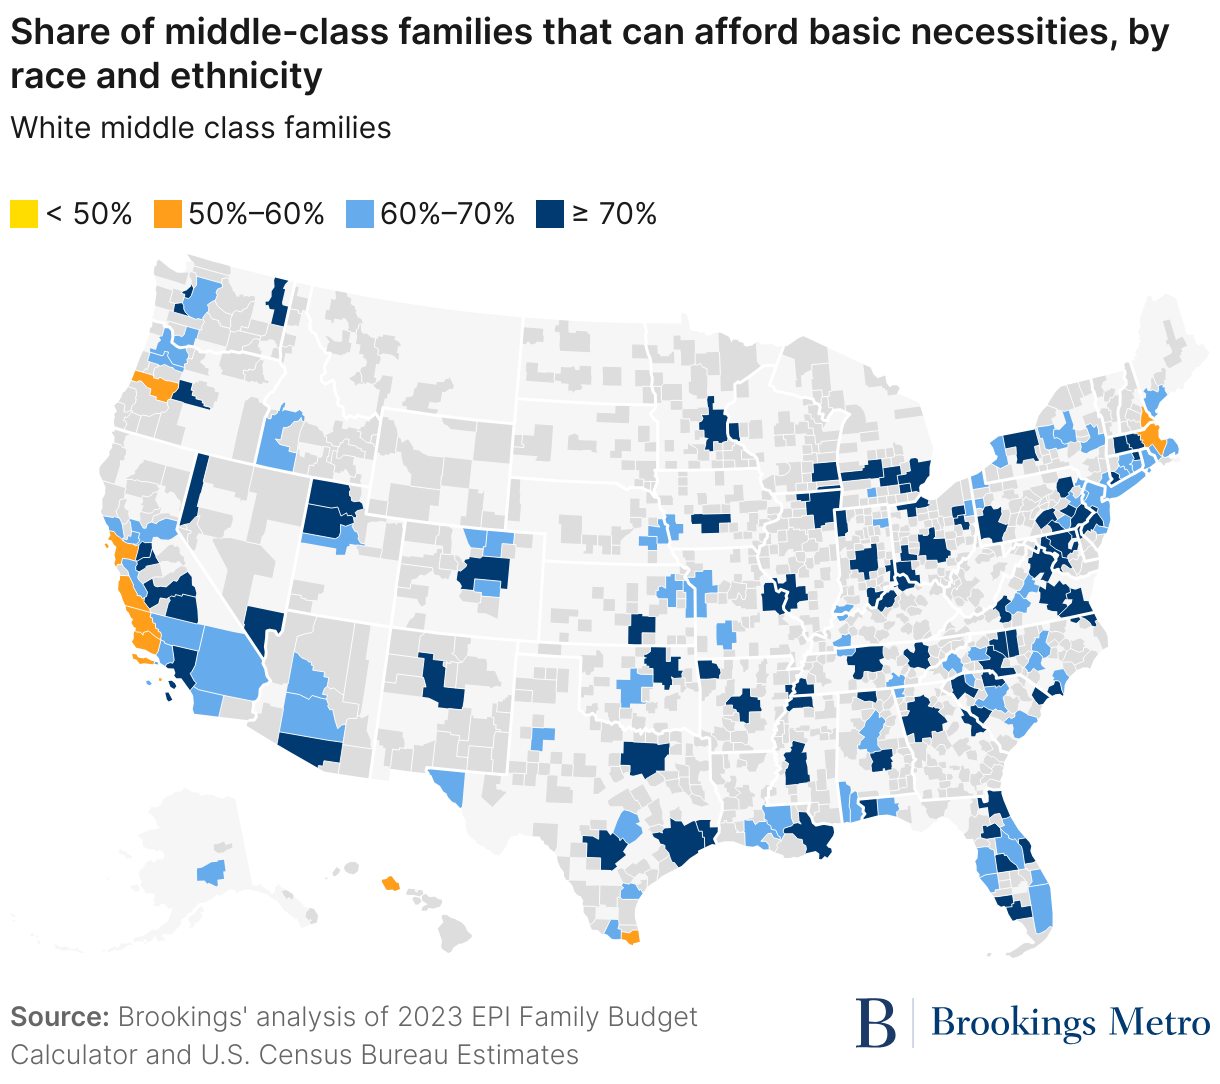
When disaggregating by race and ethnicity, the share of groups that do not make enough to afford basic necessities varies. White middle-class families have the lowest share, at 27%, while Latino or Hispanic middle-class families have the highest, with 50% struggling to make ends meet. These racial disparities indicate that while the middle class is facing affordability issues overall, white families are more likely than nonwhite families to be able to afford basic necessities such as housing and food. These middle-class disparities mirror income and wealth gaps for the U.S. population overall.
Affordability for the middle class varies by place
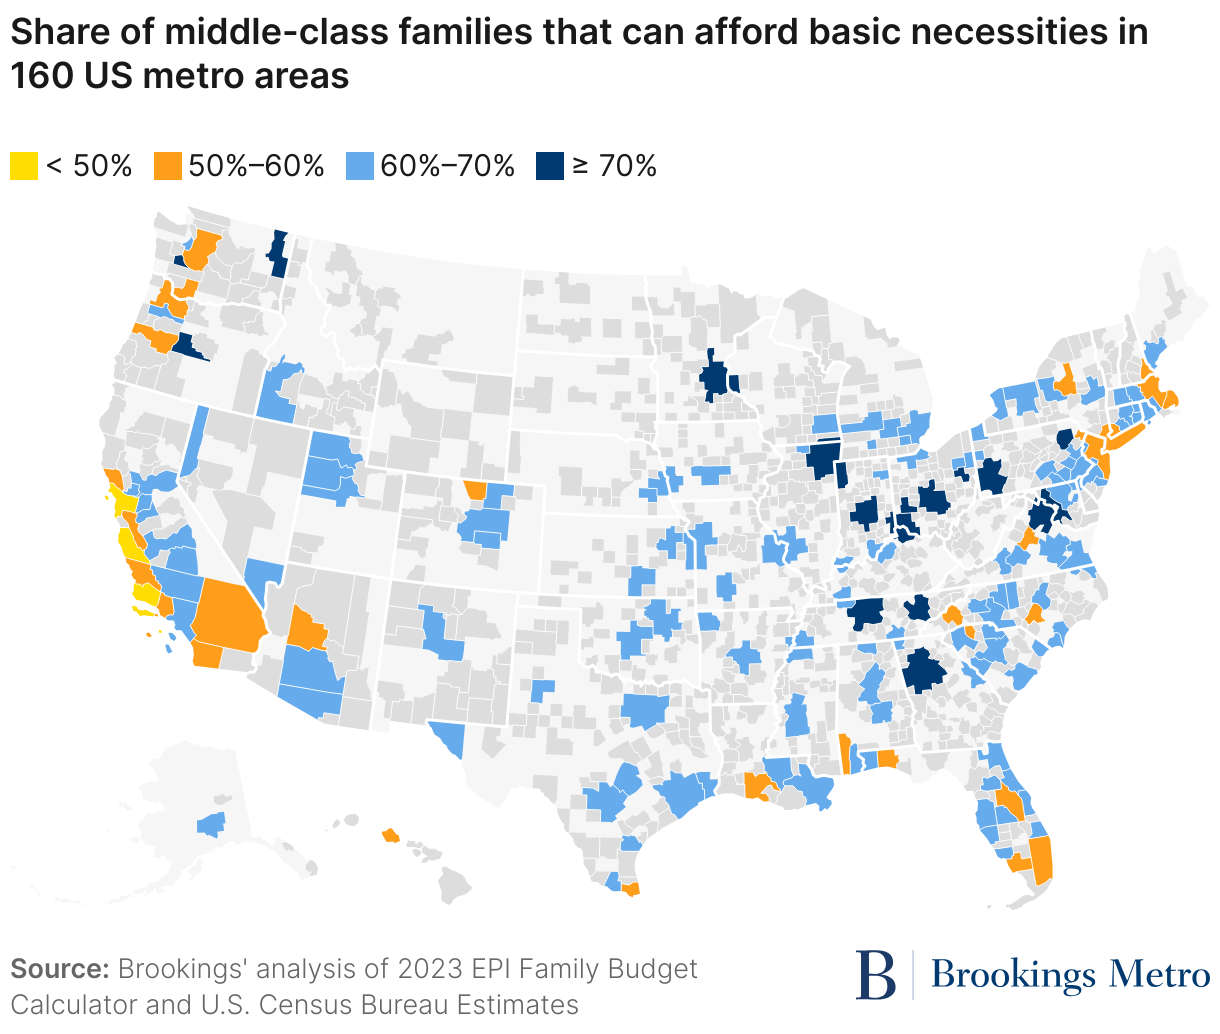
Our analysis shows that there is no major city in the country where 100% of the middle class can afford basic necessities. Affordability, therefore, is not only an issue in the largest or richest cities such as New York or San Francisco, but extends to 160 metro areas covering every state.
The metro areas with the largest shares of middle-class families that can afford basic necessities are Washington, D.C.; Minneapolis; Dayton, Ohio; Pittsburgh; and Scranton, Penn. The variety of these more affordable places reflects the different middle-class income ranges; for example, in Dayton, the median middle-class family makes $70,000, while median middle-class income in Washington, D.C. is $95,000. Yet even in these areas, more than 20% of middle-class families are still unable to afford basic necessities. And, unfortunately, while Washington, D.C. has one of the highest shares of middle-class affordability, recent job losses due to federal government cuts may have a significant negative effect.
The cities with the lowest shares of middle-class affordability are mostly in Western states, especially California, followed by some Northeastern and Southern cities. At the bottom ranks are Salinas, Calif.; Santa Barbara, Calif.; San Francisco; New York; and San Luis Obispo, Calif. In these places, less than 52% of middle-class households can afford basic necessities.
Middle-class affordability by both race and place
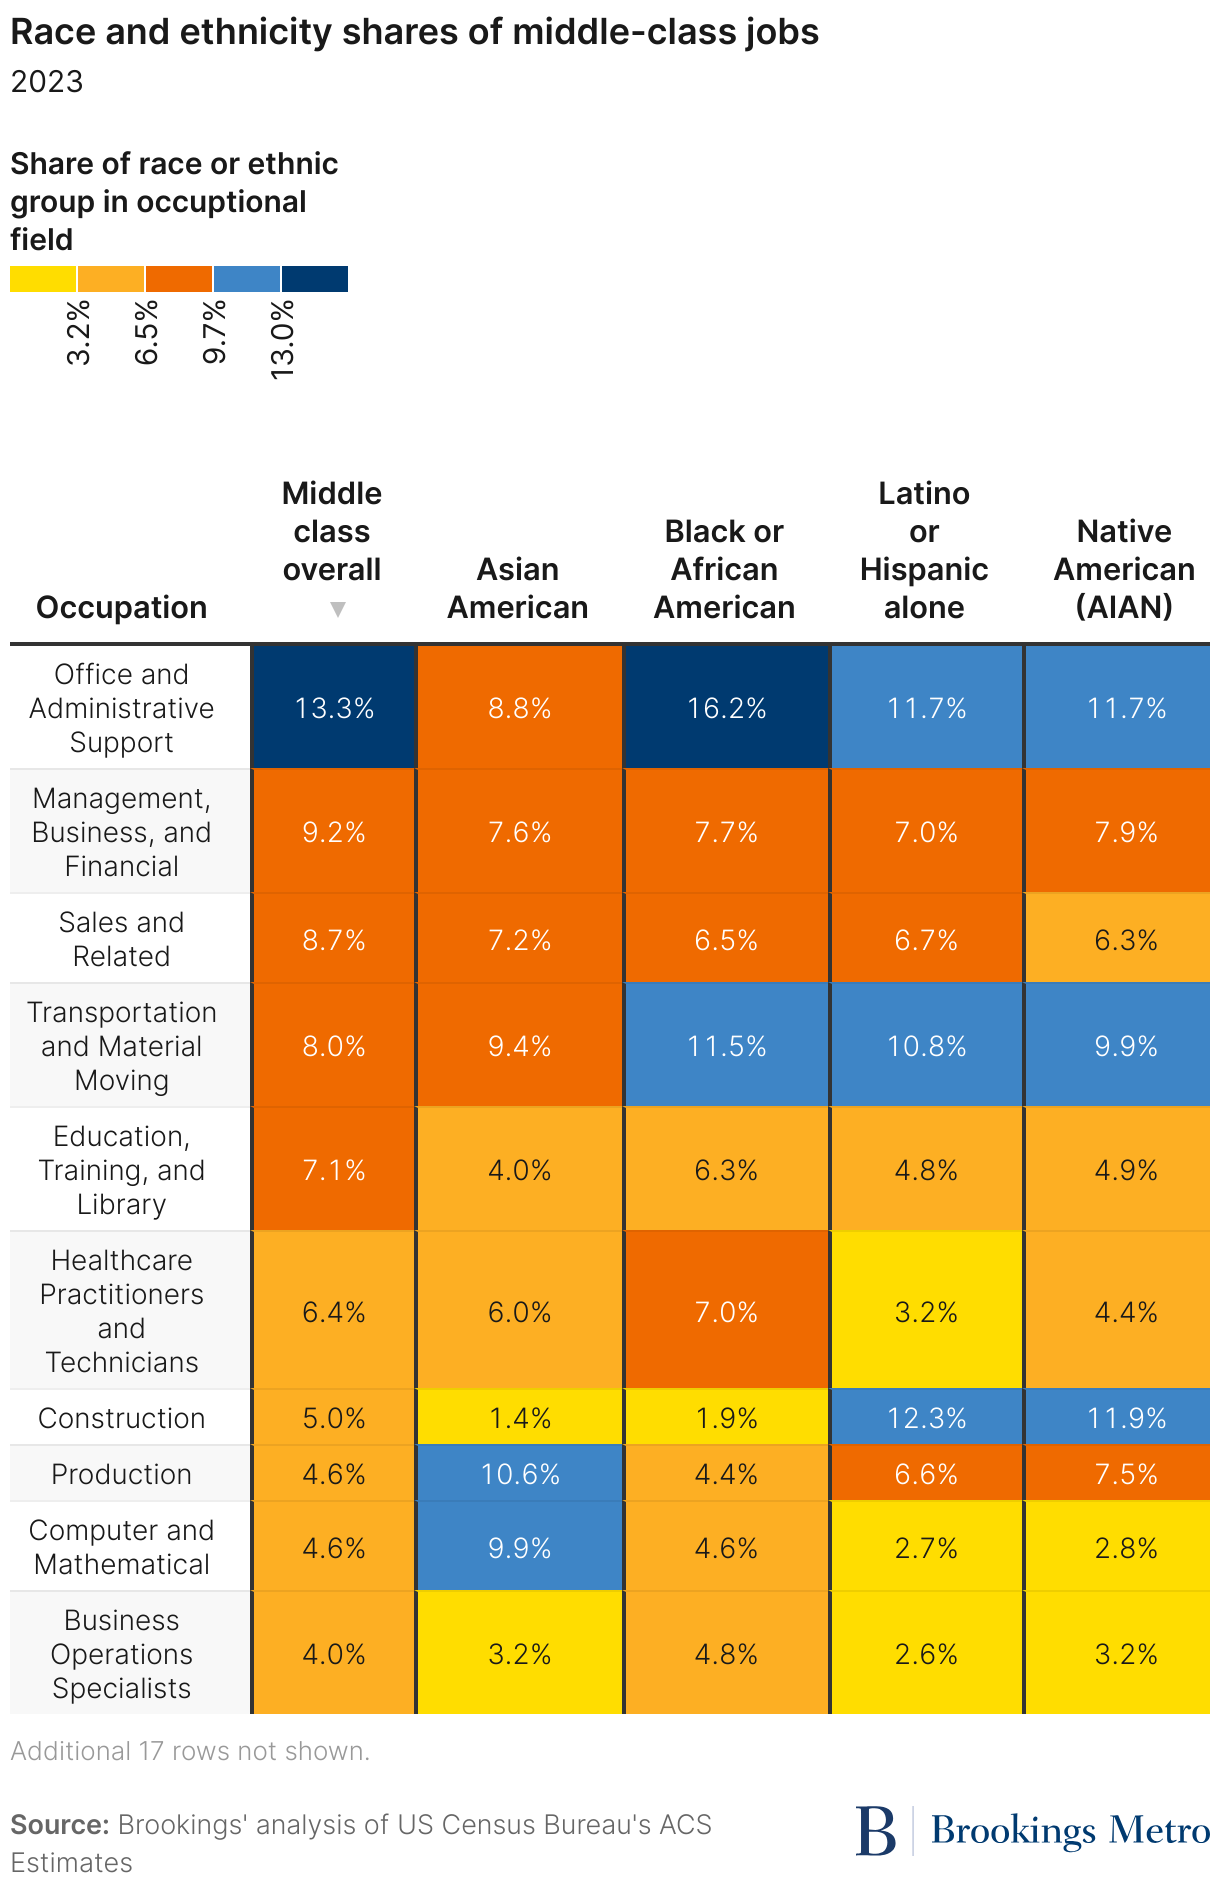
Across race and ethnicity, white collar jobs are the most commonly held roles for the American middle class, with the largest share holding office and administrative support roles, followed by business/finance and sales jobs, as shown in Table 2.
However, many blue collar jobs are still part of the middle class, especially those in transportation/material moving, construction, and production. Adding to the rainbow, “pink collar” jobs—which typically employ high shares of women—such as education and health care roles are popular middle-class jobs as well. Some outliers when disaggregating by race are high shares of Asian American middle-class workers in computer/mathematical and personal care roles, as well as high shares of Native Hawaiian or Pacific Islander middle-class workers in food preparation and serving roles.
Racial distributions in middle-class work are not coincidental; they reflect decades of systemic racial, ethnic, and gender discrimination that have shaped who can access which occupations. As some economists argue, in a race-neutral labor market, concentrations of certain races in certain fields would not exist, so therefore they are products of historic discrimination. A Pew Research Center survey reports that 41% of Black workers experienced discrimination in their current job, compared with 25% of Asian American and 20% of Latino or Hispanic workers. Gender discrimination further compounds occupational segregation, steering women into caregiving fields: About one-fifth of personal health aides and nearly one-third of nursing assistants are Black women, while roughly one-fifth of child care workers are Latino or Hispanic women.
Racial and gender variation by middle-class occupation impacts the incomes of people of color and women, pushing them into the lower middle class. According to a Stanford University report, Black and Latino or Hispanic millennials make an estimated $2.40 less per hour than white millennials, and between 39% and 49% of this disparity is due to the former groups’ underrepresentation in relatively highly paid occupations.
Therefore, it is no surprise that racial variation in middle-class affordability continues across places. There are only three metro areas in our study where over half of the overall middle class cannot afford basic necessities. However, when looking at communities of color, there are significantly more metro areas where that is the case. In 35% of studied metro areas, less than half of Black middle-class households can afford basic necessities; that figure is 38% of metro areas for Asian American middle-class households; 45% for Native American households; and 61% for Latino and Hispanic households. Yet for white households, there is no metro area where less than half of middle-class households can afford to live.
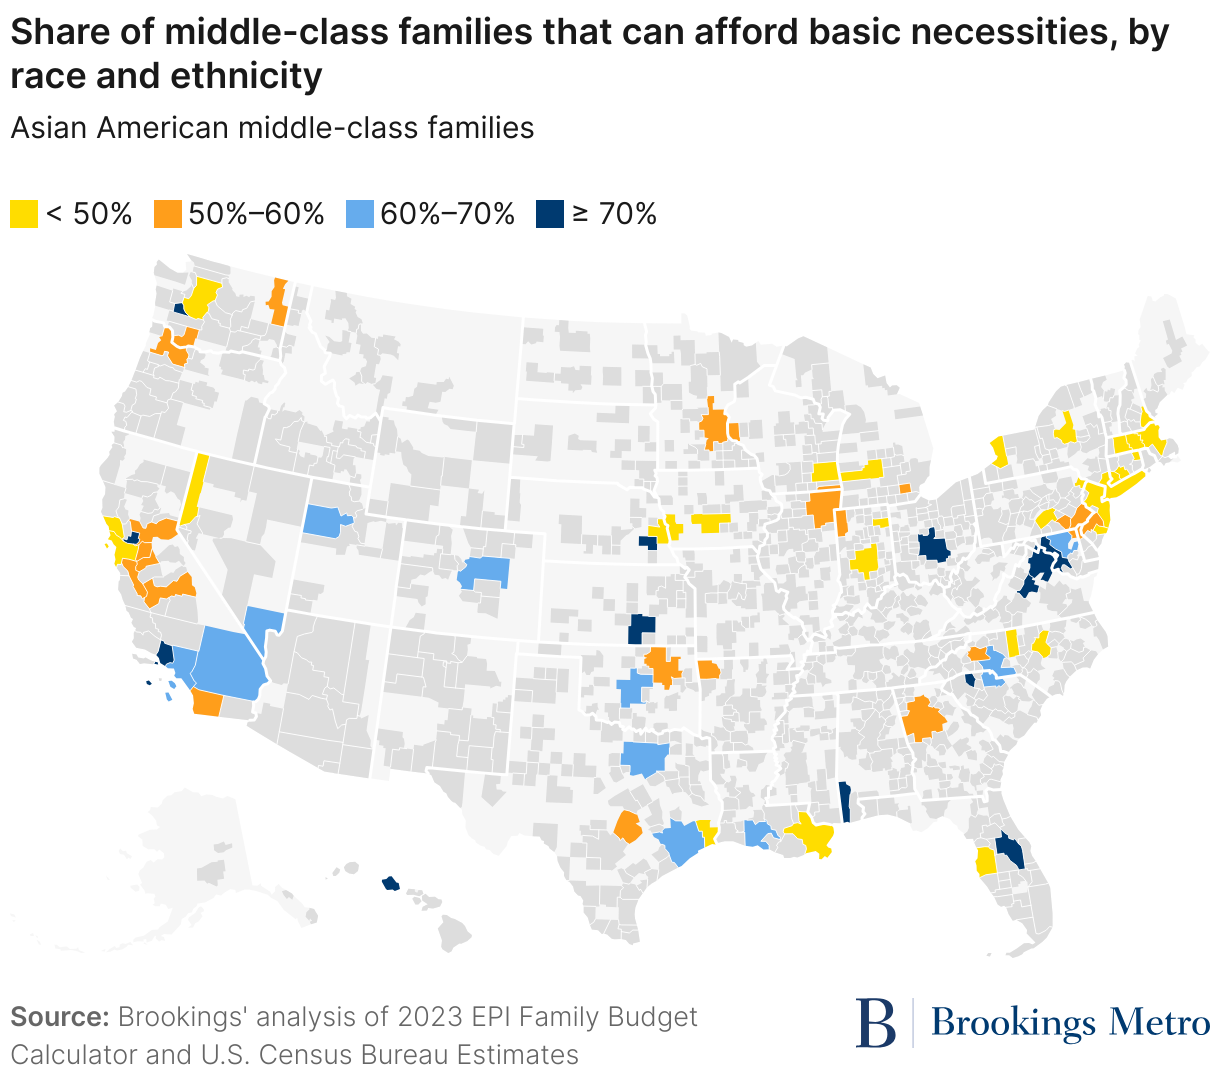
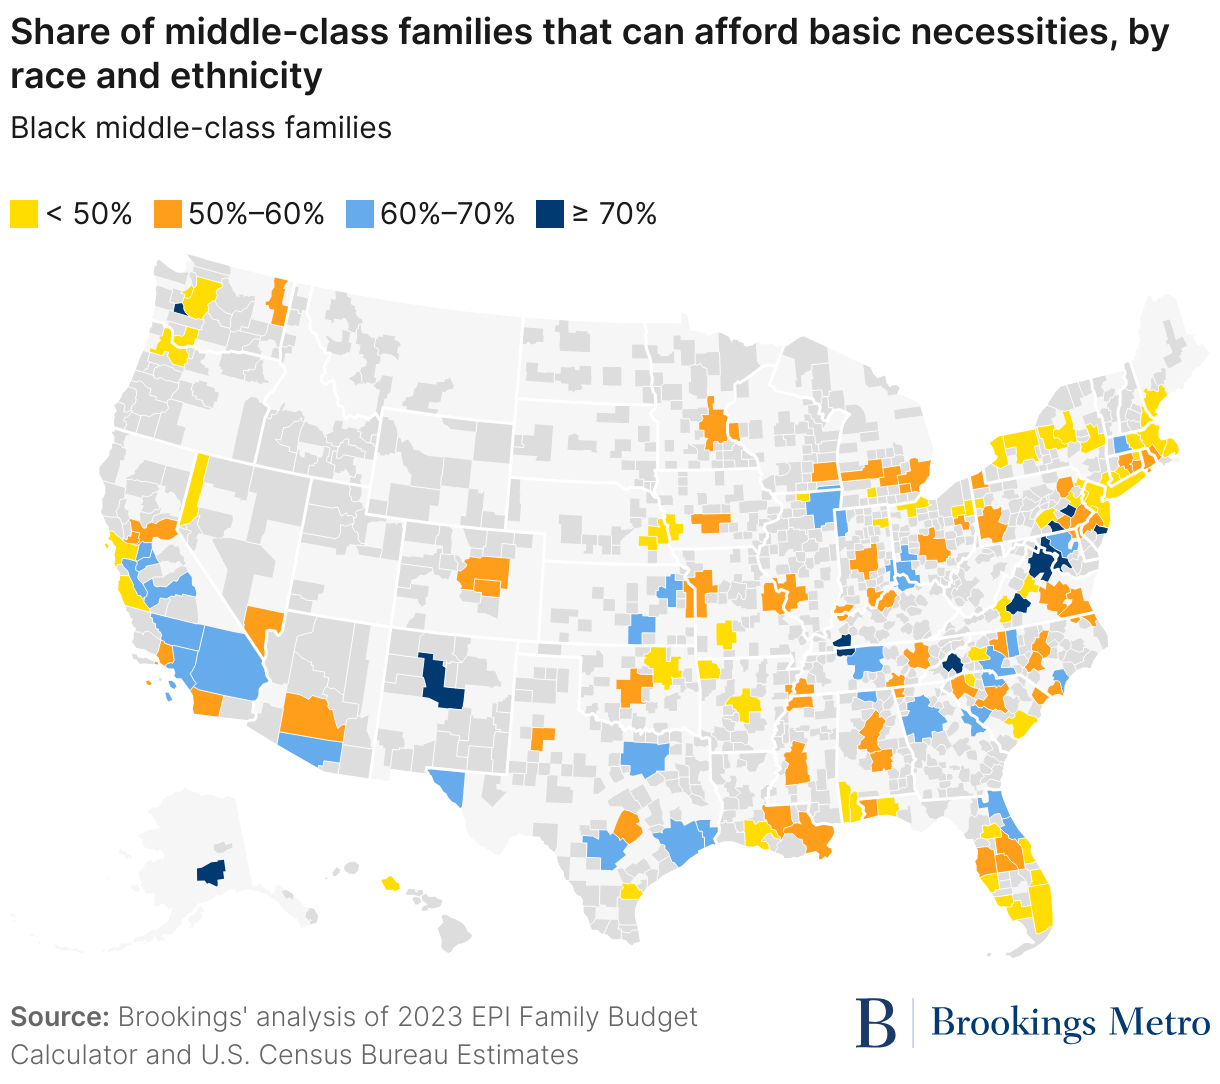
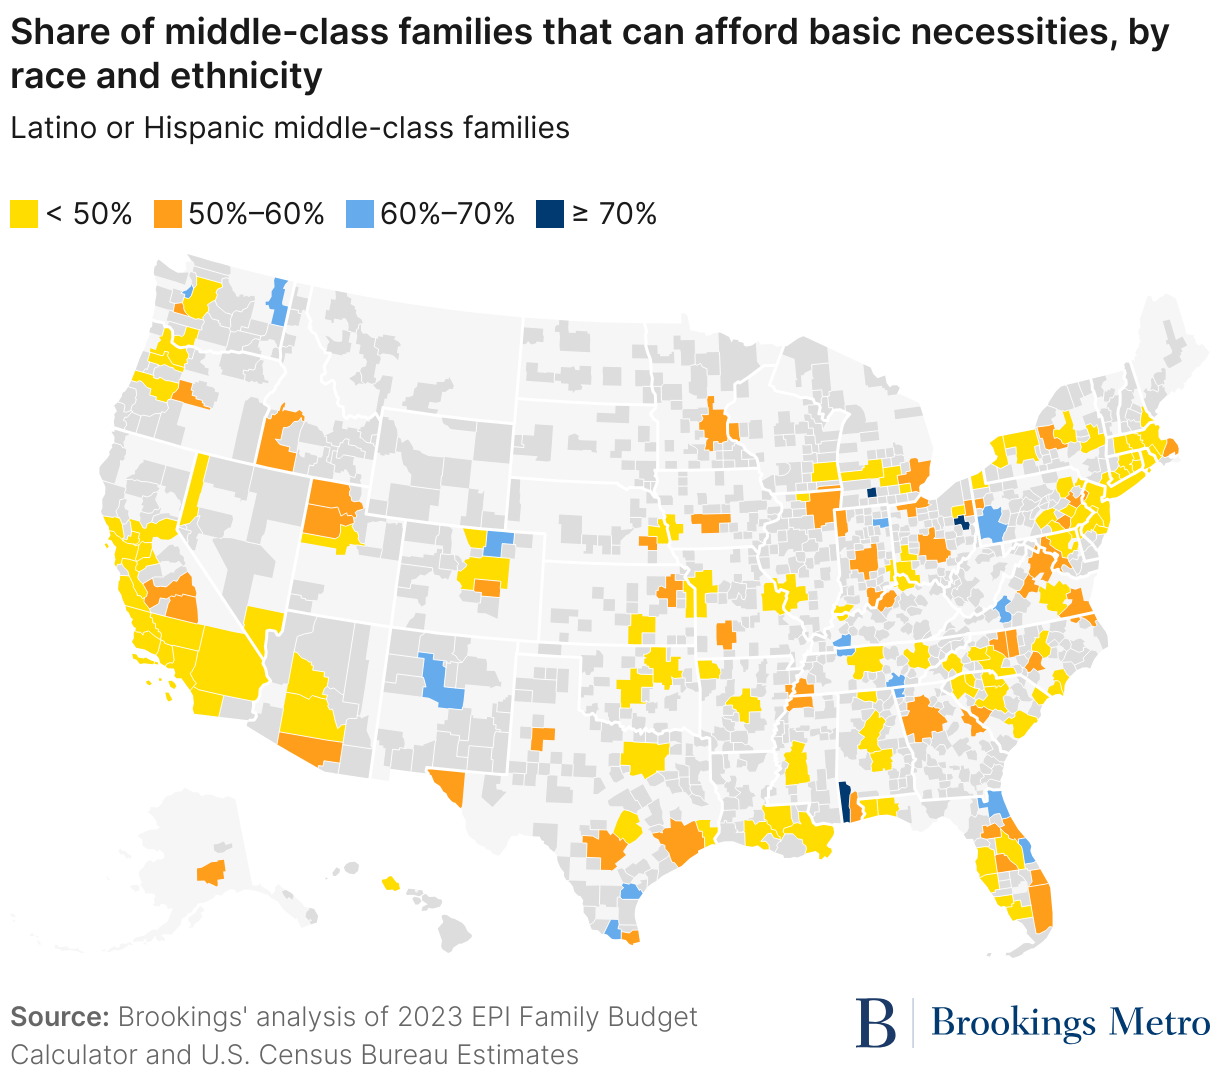

Regional variations in affordability expose racial variations as well. For example, Midwestern metro areas have some of the highest shares of middle-class affordability, but disaggregating by race shows that a higher share of white middle-class households can afford basic necessities compared to Black and Latino or Hispanic middle-class households. Conversely, California is home to metro areas with some of the lowest shares of middle-class affordability; those shares are even lower for Latino or Hispanic and Native American middle-class families (especially in places such as Los Angeles) compared to shares for white, Asian American, and Black middle-class households.
How policymakers can help middle-class families
The share of how many middle-class families are struggling to make ends meet varies by city, meaning state and local leaders can and should act to address these affordability challenges. However, the prevalence of those struggling to make ends meet on their current salaries is a national challenge. The most direct policy interventions at the national level are increasing income levels and decreasing the cost of living—or both.
To increase incomes, policymakers could increase the federal minimum wage, which since 2009 remains stagnant at $7.25 per hour (or $2.13 per hour since 1996 for tipped workers). Many cities and states have already raised their minimum wage, but 20 states still use the federal minimum wage. Additionally, income inequality has long been linked to union representation, as collective bargaining agreements give workers the power to demand higher pay. Protecting union activity and strengthening the power of the National Labor Relations Board is another way to help the middle class afford life in their cities and towns.
Decreasing the cost of living is another route to supporting middle-class families, and requires a combination of policies. Since the cost of living is a summation of housing, food, health care, child care, and transportation costs, reducing the price of these necessities requires targeted policies. At the national and state level, lowering costs for middle-class households could include universal health and child care as well as increased investments into public transportation and Supplemental Nutrition Assistance Program (SNAP) benefits.
These policy interventions will support middle-class families of all races, but due to systematic disparities in employment rates, homeownership, food access, health care, and transportation for Asian, Black, Latino or Hispanic, and Native Americans, making life more affordable for all will also require policy solutions that account for these challenges. Targeted, place-based interventions in cities where families of color are struggling are likely to address racial disparities in affordability. Our upcoming research will dive further into the middle class by racial group, including an examination of the greatest affordability barriers in places across the country.
Conclusion
It is jarring that in one of the richest countries in the world, one-third of the middle class does not make enough to afford basic necessities. The single woman living in Pennsylvania buying her first home, the Latino or Hispanic couple in Indiana running a local business, the Black parents in Texas starting their family—all of these faces of the American middle class are struggling with affordability when they shouldn’t have to. The promise of the American dream—living a comfortable life and leaving a foundation for future generations—is not materializing for today’s middle class.
The impact of this disconnect between middle class incomes and the cost of living leaves ripple effects on everyday Americans’ ability to live and build wealth for their future and family. Those who cannot afford basic necessities are more likely to go into debt and are unable to save or invest, making them more vulnerable to economic shocks. Meanwhile, racial disparities in income make middle-class families of color disproportionately vulnerable. Both local and national policymakers need to act boldly to help average Americans live and prosper.
Authors


-
Acknowledgements and disclosures
Thank you to Glencora Haskins, Farah Khan, and Vanessa Williamson for invaluable support and advice in developing this project.
-
Footnotes
- This methodology adjusts income thresholds for each metro area using the ratio of the inverse of the square root of average household size at the national level to that at the metropolitan level. The formula for this adjustment is 𝐼𝑛𝑐𝑜𝑚𝑒×𝑅𝑒𝑔𝑖𝑜𝑛𝑎𝑙𝑃𝑟𝑖𝑐𝑒𝑃𝑎𝑟𝑖𝑡𝑦÷100×(1÷√𝐴𝑣𝑒𝑟𝑎𝑔𝑒𝑈𝑆𝐻𝑜𝑢𝑠𝑒ℎ𝑜𝑙𝑑𝑆𝑖𝑧𝑒)÷(1÷√𝐴𝑣𝑒𝑟𝑎𝑔𝑒𝑀𝑒𝑡𝑟𝑜𝐻𝑜𝑢𝑠𝑒ℎ𝑜𝑙𝑑𝑆𝑖𝑧𝑒)
The Brookings Institution is committed to quality, independence, and impact.
We are supported by a diverse array of funders. In line with our values and policies, each Brookings publication represents the sole views of its author(s).