This piece is part of a collection of retirement policy proposals launched at the September 30, 2026 event, “The next generation of reforms to the retirement saving system“. You can view the entire collection here.
Introduction
Tax-preferred defined contribution (DC) plans are now the primary vehicle through which federal policy subsidizes retirement savings, with associated tax expenditures totaling approximately $276 billion in 2019 (Congressional Budget Office 2021). Despite the massive expenditure, access to employer-sponsored plans remains uneven. Around 36 million private sector workers in the U.S. did not have access to an employer-sponsored retirement plan in 2025 (Bureau of Labor Statistics 2025). For those who have access, the value of tax benefits for DC plans varies widely: An individual in the top tax bracket receives roughly $35 in immediate tax savings per $100 contributed, while a worker in a lower tax bracket might receive $10 or less for the same contribution. For the lowest-income workers, the traditional tax exclusion often provides no benefit.
Several developments heighten the policy relevance of these structural features. First, while mortality trends vary across groups, overall life expectancy has risen, extending the retirement horizon and increasing required savings (Social Security Administration 2026). Whereas in 1950, the mean life expectancy at age 65 was 14 years, today it has grown to nearly 20 years. This extension of the expected postretirement lifespan has increased the need for savings, as longer retirements require greater accumulated wealth to maintain living standards. Second, the projected depletion of the Social Security trust fund increases the need to strengthen alternative savings vehicles. The latest report from the Social Security Board of Trustees projects that the program’s trust fund will be exhausted in 2032 (Social Security Administration 2026). Policymakers should seek complementary strategies to improve retirement security outside Social Security if benefit cuts are implemented. Third, the explosion in artificial intelligence (AI) investment and projected rise in productivity has prompted concerns of a shift in national income from labor to capital and given rise to calls for more broadly sharing the gains from AI. Under such a scenario, a broader distribution of capital—particularly equity ownership by low- and middle-income households—can help mitigate rising inequality and diminished returns to labor. And lastly, a growing body of academic literature finds that tax incentives for DC plans yield limited net new savings, with most benefits accruing to higher-income households that would likely have saved in the absence of the incentive. The economics literature suggests that the incentives raise net savings by only a minuscule share, implying that it may be more accurate to characterize the DC system as a hybrid transfer program—a system that functions more as a wealth transfer to higher-income households than as a mechanism for generating new savings—rather than a pure savings incentive.
Indeed, the consensus around the economic impact of DC plans has evolved as the accounts became more widespread. Studies conducted early in the DC expansion established an optimistic baseline for the efficacy of tax incentives for retirement savings and suggested that tax-preferred retirement accounts were effective instruments for increasing household wealth accumulation (Feldstein 1995; Poterba, Venti, and Wise 1995, 1996, and 1998). However, studies employing more rigorous controls for participant heterogeneity and selection bias reached opposite conclusions, often finding that DC plans represented limited net additions to household saving (Gale and Scholz 1994; Engen, Gale, and Scholz 1996; Engen and Gale 2000; Benjamin 2003). More recent research has reinforced this finding, suggesting that these tax preferences primarily induce portfolio reallocation rather than increased savings (Chetty et al. 2014; Beshears et al. 2017). One study even suggested that the substantial annual federal cost of the subsidies could be reducing national savings once the resulting larger budget deficits are factored in (Gale and Orszag 2004).
From a distributional perspective, the consequences of tax-preferred DC plans are highly regressive. Updated figures show that the top two quintiles together receive roughly 84% of the subsidy, compared with a mere 1.3% going to the bottom quintile (Congressional Budget Office 2021). These annual distributional patterns persist when examined over the lifetime. Microsimulation analyses find that the bottom 40% of households receive only single-digit shares of the tax subsidies for retirement savings over their careers, while half of all benefits flow to the top 10% (Burman et al. 2004). The structure of these tax preferences creates what amounts to a transfer to top earners and motivates various proposals to redirect tax incentives for retirement savings toward moderate- and low-income households. Reallocating a portion of this expenditure to more effective matches or mandatory savings mechanisms could improve retirement preparedness without increasing net fiscal costs.
Given both the minimal effects on net savings and the regressive distributional patterns of existing tax preferences for DC plans, researchers have explored revenue-neutral reforms that would exchange high-income tax benefits for more progressive matching contributions. One frequently cited approach would replace current deductions with a uniform refundable credit providing a government match of approximately 30% on contributions (Gale, Gruber, and Orszag 2006). While transitioning the benefit to a matching credit would increase net-savings among low- and middle-income households, it would almost certainly prove politically intractable and could have negative unintended consequences—including potentially diminished retirement plan coverage for workers if firms cancelled their plans in the wake of the reform. The flat-rate matching credit approach also entails substantial transition costs.
This essay, adapted from a recently published article in Tax Notes (Harris and Sarin 2026), lays out three options to make the Saver’s Match even more progressive by pairing an expanded match with modest saving-related offsets. From a broad perspective, our proposal can be seen as an incremental step toward the flat-rate matching credit. In comparing these proposals, the flat-rate matching credit would upend the retirement savings landscape, boosting the retirement saving benefit for roughly four-fifths of savers, whereas the plan we present below would be much more targeted. On the flipside, our plan could plausibly be included in SECURE 3.0 legislation and would largely maintain the existing DC landscape—without the complicated political and logistical issues associated with a flat-rate matching credit.
Several caveats are warranted. This essay presents three illustrative and tractable proposals for offsets to ensure revenue neutrality, but there are other potential offsets, and such a reform could also be included in a broader package with more sweeping reforms and associated fiscal “pay-fors.” Relatedly, the identified offsets were in part selected because they would preserve incentives by plan sponsors to maintain their DC-account offerings and thus avoid intentionally harming retirement savers by reducing access to workplace accounts. Finally, this essay is focused on increasing the maximum match on contributions, but other reforms to the Saver’s Match could prove beneficial. For example, the income eligibility thresholds could be broadened, the automatic enrollment infrastructure could be strengthened, and the match rate could be raised. All of these reforms deserve consideration in future research.
Using the Urban-Brookings Tax Policy Center’s microsimulation model,1 we find that our modeled reforms would benefit between 2.6 million and 3.0 million taxpayers annually, with benefits concentrated among households in the bottom three income quintiles. Further, the tax increases needed to fund these reforms would primarily affect the top 1 to 10% of the income distribution. In all instances, households below the top quintile would see their average taxes decline.
The Saver’s Match and proposed reforms
The primary focus of this article is to present the distributional consequences of three separate revenue-neutral proposals that expand the maximum Saver’s Match using revenue from various progressive reforms to retirement benefits or the estate and gift tax.
Under current law, some low- and middle-income households can claim a nonrefundable tax credit, known as the Saver’s Credit, for contributions made to qualified retirement accounts like 401(k) plans and IRAs. The SECURE 2.0 legislation, signed into law in 2022 (SECURE 2.0 Act 2022), is scheduled to transform the Saver’s Credit into a more generous Saver’s Match in 2027. A more detailed discussion of SECURE 2.0 is available in the full paper. In all three scenarios for the proposed reforms, we model an expansion of the Saver’s Match in the form of a maximum matched contribution.

In Scenario 1, we offset the Saver’s Match expansion by imposing special distribution rules on account holders with exceptionally high balances. This scenario is based on the proposal advanced in the Biden administration’s fiscal year 2025 budget that would force certain high-income taxpayers to make mandatory distributions from their tax-preferred retirement savings vehicles (U.S. Department of the Treasury 2024). Such a proposal would raise substantial revenue while better aligning tax benefits for DC accounts with their intended purpose of providing retirement security, which diminishes as a justification for account holders with balances in excess of $10 million.
In Scenario 2, the Saver’s Match offset is derived from a proposal to change the procedure for property valuation under the estate and gift tax—in particular, for valuing promissory notes and partial interests of transferred intrafamily property to limit tax avoidance opportunities. This offset corresponds to the Biden administration’s fiscal year 2025 budget proposal to revise the rules for the valuation of certain property. This offset can be justified on tax administration grounds given concerns that existing valuation practices understate the market value of certain businesses and thus artificially depress estate tax liability.
In Scenario 3, the offset is a reduction in the contribution limits for DC plans, such as 401(k)s and IRAs—including both standard and catch-up contribution limits. Further, in each year, the IRS establishes limits on both individual and joint contributions from an employee and an employer. These limits are indexed to inflation and reset annually. The proposed offset in Scenario 3 reduces the maximum contributions by 5% for employer-based plans and IRAs. A more moderate 3% adjustment is analyzed in the companion Tax Notes essay (Harris and Sarin 2026). Limiting contribution limits on DC accounts, in isolation, can improve the progressivity of the retirement saving system with minimal impact on retirement security as only the wealthiest earners are typically able to contribute the maximum.
A related design question is whether the revenue generated by these offsets would be more effectively directed toward raising the maximum matched contribution—as proposed in each scenario—or toward expanding the income eligibility threshold. These two approaches involve a meaningful trade-off. Increasing the maximum match concentrates additional resources on the lowest-income eligible households, but it assumes that these households are able to contribute enough to take full advantage of the higher ceiling. Under Scenario 1, for example, a $9,000 maximum match would require $18,000 in annual contributions—a substantial share of income for households near the eligibility threshold. Survey data indicate that approximately one-third of U.S. households report being unable to cover an unexpected $500 expense entirely with cash or its equivalent (Board of Governors of the Federal Reserve System 2024), suggesting that the financial capacity to maximize a generous match may be limited among the target population. Alternatively, raising the income limit would extend eligibility to moderate-income workers who currently fall just above the threshold, but who may nonetheless face meaningful retirement savings shortfalls. The 2022 Survey of Consumer Finances found that the median retirement account balance among households with such accounts was approximately $87,000 (Board of Governors of the Federal Reserve System 2023)—a level that, for many middle-income households, may prove insufficient to sustain adequate living standards in retirement. We focus on raising the maximum match in this analysis because it directs resources toward the lowest-income eligible savers, but policymakers should consider whether broadening eligibility might produce larger aggregate improvements in retirement preparedness.
Methodology
We use the Tax Policy Center (TPC) microsimulation model, which is designed to estimate the revenue and distributional effects of current and proposed tax policies, to analyze three potential expansions to the Saver’s Match. The estimates are made using the 2006 public use file from the IRS’s Statistics of Income Division, which includes detailed tax data on 145,858 tax units filing in calendar year 2007. The data are then adjusted forward using aggregate targets to produce a sample capable of analyzing tax changes in future years (TPC 2022).
Using the microsimulation model, we first establish revenue-neutral scenarios for the three proposed approaches by estimating the gross revenue increase from the specific pay-for. Next, we calculate an equal-magnitude expansion in the Saver’s Match contribution limit. Finally, we estimate the distributional consequences of the combined reform.
The TPC’s microsimulation model does not have the capacity to precisely model changes in distribution rules for high-balance accounts or revisions in valuation rules for estate and gift tax purposes. For Scenario 2, in which the Saver’s Match expansion is offset by changes in estate and gift tax valuation rules, we begin with the 10-year score produced by the Joint Committee on Taxation (Joint Committee on Taxation 2024), then adjust the score to correspond to calendar years 2027 through 2035 and to incorporate changes from the One Big Beautiful Bill Act (P.L. 119-21). We then distribute the estimated score in accordance with the TPC’s method for distributing estate tax liability to tax units (Burman, Lim, and Rohaly 2008). Similarly, to distribute Scenario 1’s increased tax revenue associated with modifying distribution rules for high-value retirement accounts, we follow the same procedure, except here we distribute the burden in proportion to each tax unit’s share of accumulated retirement benefits in accounts worth over $10 million. The increased taxes associated with lower contribution limits, as well as the tax benefits associated with expanded contributions for the Saver’s Match, are distributed in accordance with the TPC’s retirement saving methodology. No behavioral effects were included in the modeling procedures. Retirement contributions are determined under the TPC microsimulation methodology, which relies on both observed and imputed retirement contributions to determine how much each unit contributes to an account. The TPC model does not have a direct assumption for the take-up rate of the Saver’s Credit, but rather calculates an implied take-up rate based on imputations of various types of retirement contributions.
Results
We analyze three reforms that would place modest limitations on tax relief for wealthy taxpayers and direct the increased revenue toward an expanded Saver’s Match benefiting low- and middle-income workers. In all cases, the scenarios are approximately revenue-neutral over the 10-year budget window. Budget neutrality is not guaranteed beyond this period. Also, in all cases, the modeled expansion in the Saver’s Match is an increased contribution limit, increasing the maximum benefit for eligible savers without changing the share of households eligible to receive the benefit.
Below, we present estimates of the revenue-neutral expansion in the Saver’s Match permitted by each tax increase, coupled with insights on the distributional effects of each collective reform. We present distributional estimates for both 2027 and 2035 to provide a more complete picture of the trade-offs.
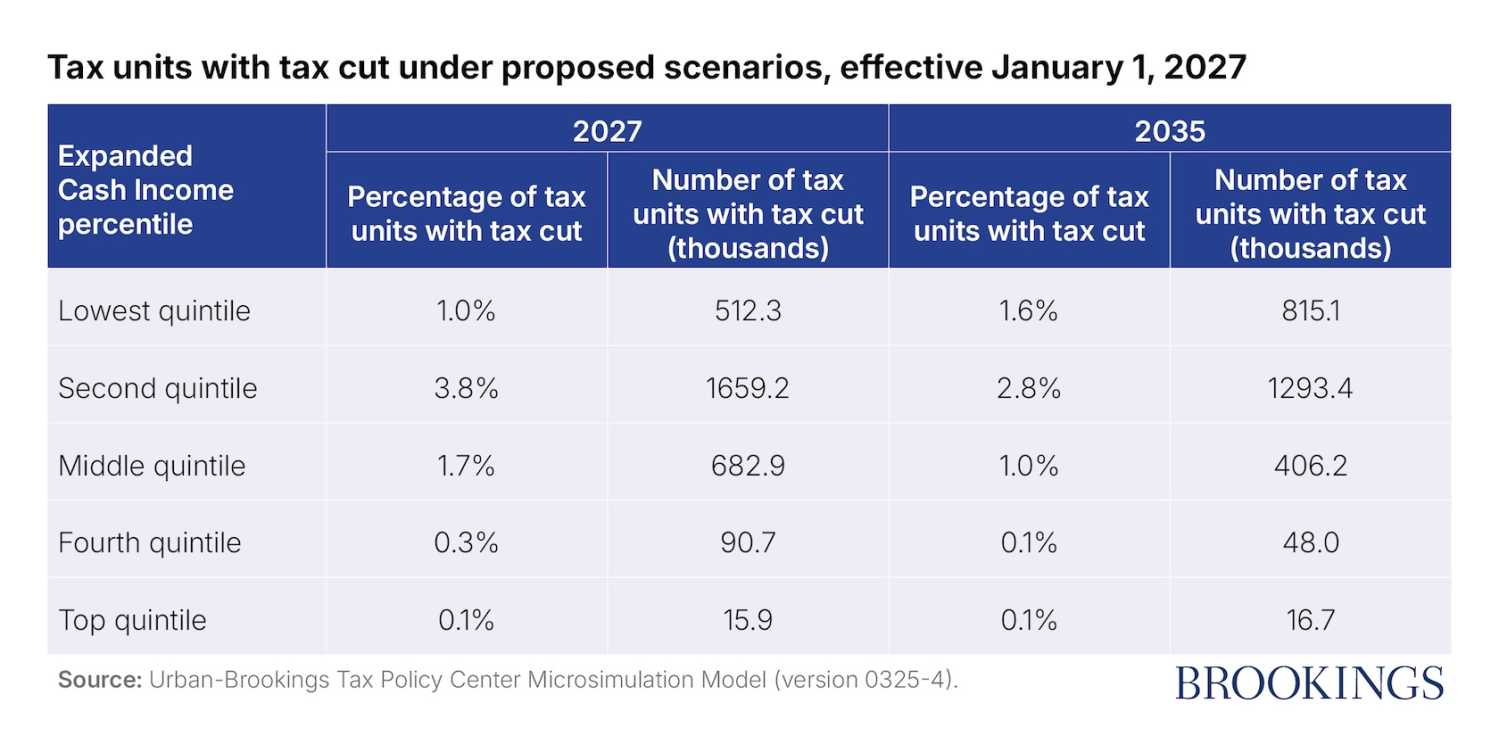
Because the Saver’s Match expansion is structured as a higher maximum match, the number of tax units benefiting from each scenario is constant across scenarios in any given year, although the magnitude of the benefit will vary. For 2027, about 1 to 2% of tax units in the bottom and middle quintiles would see higher retirement benefits, with a small share of households in the fourth quintile—0.3%—benefiting from the expansion. The pattern would largely hold for 2035 where almost no taxpayers in the top two quintiles (just 0.1%) would see a benefit (see Table 1). Note that some tax units classified in upper quintiles under TPC’s Expanded Cash Income measure may have lower income under the tax code and thus qualify for the Saver’s Match; for details on Expanded Cash Income, see TPC (2022).
Scenarios 1, 2, and 3 would raise $19.8 billion, $11.0 billion, and $18.1 billion, respectively, between 2027 and 2035. This revenue would be sufficient to increase the maximum Saver’s Match to $9,000; $4,000; and $7,400 from the current-law level of $2,000. Scenario 1 revenue would be sharply front-loaded, with the bulk being paid within the first three years, while scenario 2 revenue would be relatively more consistent after an initial spike, around $1.1 billion per year in years 2 through 10. Scenario 3 would have near uniform increased revenue per year (see Table 2 for revenue raised in 2027 and 2035). Across the three scenarios, affected taxpayers would realize sizable increases in average retirement contributions from 2027 through 2035, with scenarios 1 and 3 presenting the largest average increases in retirement contributions for the lowest three income quintiles.
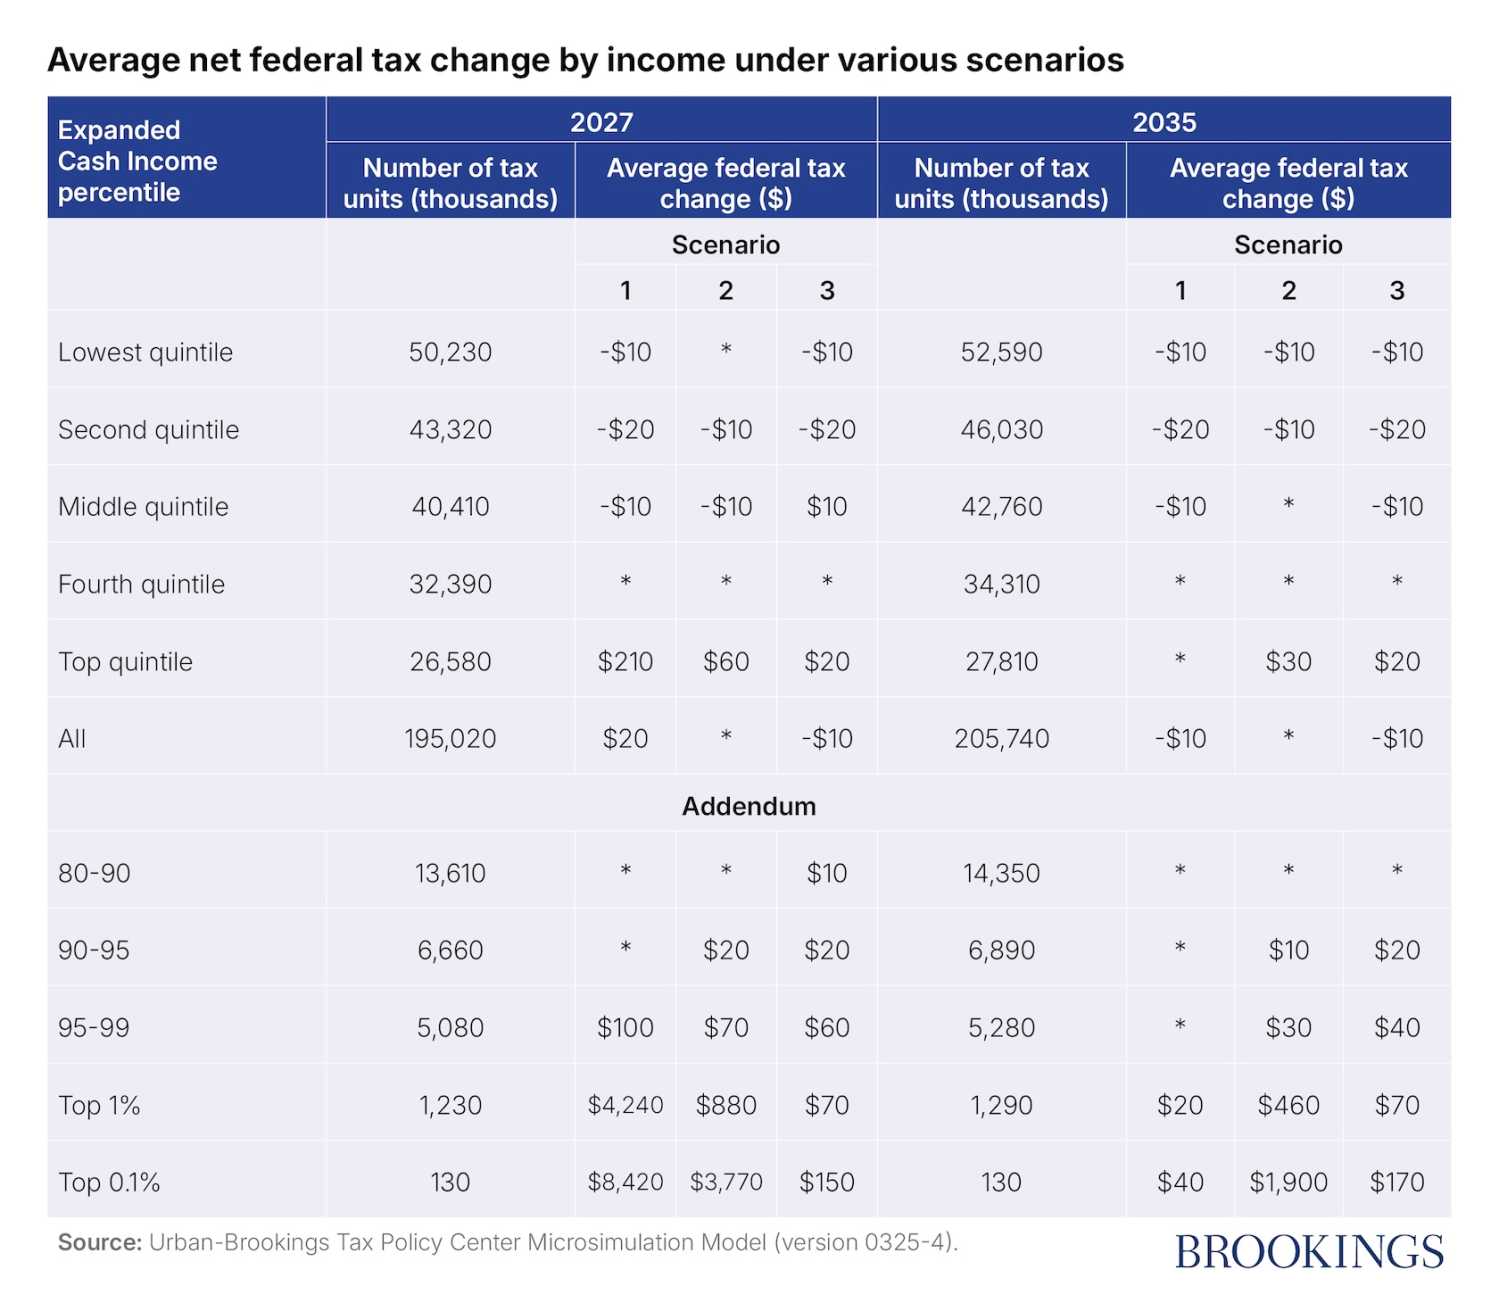
Tax increases, however, would not be equally shared across scenarios. For scenario 1, the top 1% of taxpayers would see an average decline in after-tax income of 0.2%, concentrated in 2027 and negligible by 2035; for taxpayers below the top 1%, the average federal tax change is nearly 0. Likewise, in Scenario 2, the bulk of the tax increase is realized by taxpayers in the top 1%—but the tax increase is more evenly spread across the budget window. In 2027, the average increase is $880 for the top 1%, compared with just $70 for those in the 95th to 99th percentile. By 2035, the average tax hike would fall to $460 for the top 1% and is close to 0 for all other percentiles. For Scenario 3, the average tax increase for the 90th to 99th percentile is in the range of $20 to $70 for both 2027 and 2035.
In conclusion, we argue that policymakers should pursue higher matching benefits for low- and middle-income workers, especially considering a growing body of research suggesting that these plans are better characterized as a hybrid transfer system than as a pro-saving vehicle. We find that incremental expansions of the Saver’s Match can have important implications for low- and middle-income savings, potentially boosting the savings of up to 3 million households annually. So as not to increase the deficit, we propose three revenue-neutral offsets to pair with various Saver’s Match expansions, with the various offsets selected based on equity and economic efficiency criteria. We do not signal a preferred approach among these three alternatives, but we do note that the first approach—requiring distributions from accounts with balances exceeding $10 million—appears to be the most plausible politically and administratively. While all three reform options we present are far from transformational, any would marginally raise retirement assets for millions of working households.
Authors


-
References
Benjamin, Daniel J. 2003. “Does 401(k) Eligibility Increase Saving? Evidence from Propensity Score Subclassification.” Journal of Public Economics 87 (5–6): 1259–1290.
Beshears, John, James J. Choi, David Laibson, and Brigitte C. Madrian. 2017. “Does Front-Loading Taxation Increase Savings? Evidence from Roth 401(k) Introductions.” Journal of Public Economics 151: 84–95.
Board of Governors of the Federal Reserve System. 2023. Changes in U.S. Family Finances from 2019 to 2022: Evidence from the Survey of Consumer Finances. Washington, DC: Board of Governors of the Federal Reserve System.
Board of Governors of the Federal Reserve System. 2024. Economic Well-Being of U.S. Households in 2023. https://www.federalreserve.gov/publications/report-economic-well-being-us-households.htm.
Burman, Leonard E., William G. Gale, Matthew Hall, and Peter R. Orszag. 2004. “Distributional Effects of Defined Contribution Plans and Individual Retirement Arrangements.” National Tax Journal 57 (3): 671–701.
Burman, Leonard E., Katherine Lim, and Jeffrey Rohaly. 2008. “Back from the Grave: Revenue and Distributional Effects of Reforming the Federal Estate Tax.” Washington, DC: Tax Policy Center.
Bureau of Labor Statistics. 2025. Employee Benefits in the United States—March 2025. USDL-25-1464. U.S. Department of Labor. https://www.bls.gov/news.release/ebs2.htm.
Chetty, Raj, John N. Friedman, Søren Leth-Petersen, Torben Heien Nielsen, and Tore Olsen. 2014. “Active vs. Passive Decisions and Crowd-Out in Retirement Savings Accounts: Evidence from Denmark.” Quarterly Journal of Economics 129 (3): 1141–1219.
Congressional Budget Office. 2021. The Distribution of Major Tax Expenditures in 2019. https://www.cbo.gov/publication/57413.
Engen, Eric M., and William G. Gale. 2000. “The Effects of 401(k) Plans on Household Wealth: Differences across Earnings Groups.” NBER Working Paper 8032. National Bureau of Economic Research.
Engen, Eric M., William G. Gale, and John Karl Scholz. 1996. “The Illusory Effects of Saving Incentives on Saving.” Journal of Economic Perspectives 10 (4): 113–138.
Feldstein, Martin. 1995. “The Effects of Tax-Based Saving Incentives on Government Revenue and National Saving.” Quarterly Journal of Economics 110 (2): 475–494.
Gale, William G., and Peter R. Orszag. 2004. “Budget Deficits, National Saving, and Interest Rates.” Brookings Papers on Economic Activity, no. 2: 101–210.
Gale, William G., and John Karl Scholz. 1994. “IRAs and Household Saving.” American Economic Review 84 (5): 1233–1260.
Gale, William G., Jonathan Gruber, and Peter R. Orszag. 2006. “Improving Opportunities and Incentives for Saving by Middle- and Low-Income Households.” Hamilton Project Discussion Paper 2006-02.
Harris, Ben, and Natasha Sarin. 2026. “Improving Retirement Security by Expanding the Saver’s Match.” Tax Notes Today Federal, March 12.
Internal Revenue Service. 2024. “2025 Amounts Relating to Retirement Plans and IRAs, as Adjusted for Changes in Cost-of-Living.” Notice 2024-80. https://www.irs.gov/pub/irs-drop/n-24-80.pdf.
Joint Committee on Taxation. 2024. Description of the Revenue Provisions Contained in the President’s Fiscal Year 2025 Budget Proposal. JCS-1-24.
McDermott, Brendan. 2025. “The Retirement Savings Contribution Credit and the Saver’s Match.” IF11159. Congressional Research Service. https://www.congress.gov/crs-product/IF11159.
Poterba, James M., Steven F. Venti, and David A. Wise. 1995. “Do 401(k) Contributions Crowd Out Other Personal Saving?” Journal of Public Economics 58 (1): 1–32.
Poterba, James M., Steven F. Venti, and David A. Wise. 1996. “How Retirement Saving Programs Increase Saving.” Journal of Economic Perspectives 10 (4): 91–112.
Poterba, James M., Steven F. Venti, and David A. Wise. 1998. “401(k) Plans and Future Patterns of Retirement Saving.” American Economic Review 88 (2): 179–184.
SECURE 2.0 Act of 2022, Division T of the Consolidated Appropriations Act, 2023, Pub. L. No. 117-328.
Social Security Administration. 2026. The 2026 Annual Report of the Board of Trustees of the Federal Old-Age and Survivors Insurance and Federal Disability Insurance Trust Funds.
Tax Policy Center. 2022. “Brief Description of the Tax Model.” https://taxpolicycenter.org/resources/brief-description-tax-model.
U.S. Department of the Treasury. 2024. General Explanations of the Administration’s Fiscal Year 2025 Revenue Proposals.
-
Footnotes
- This article reflects independent research by the authors and is not a publication of the Budget Lab at Yale or the Brookings Institution.
The Brookings Institution is committed to quality, independence, and impact.
We are supported by a diverse array of funders. In line with our values and policies, each Brookings publication represents the sole views of its author(s).