
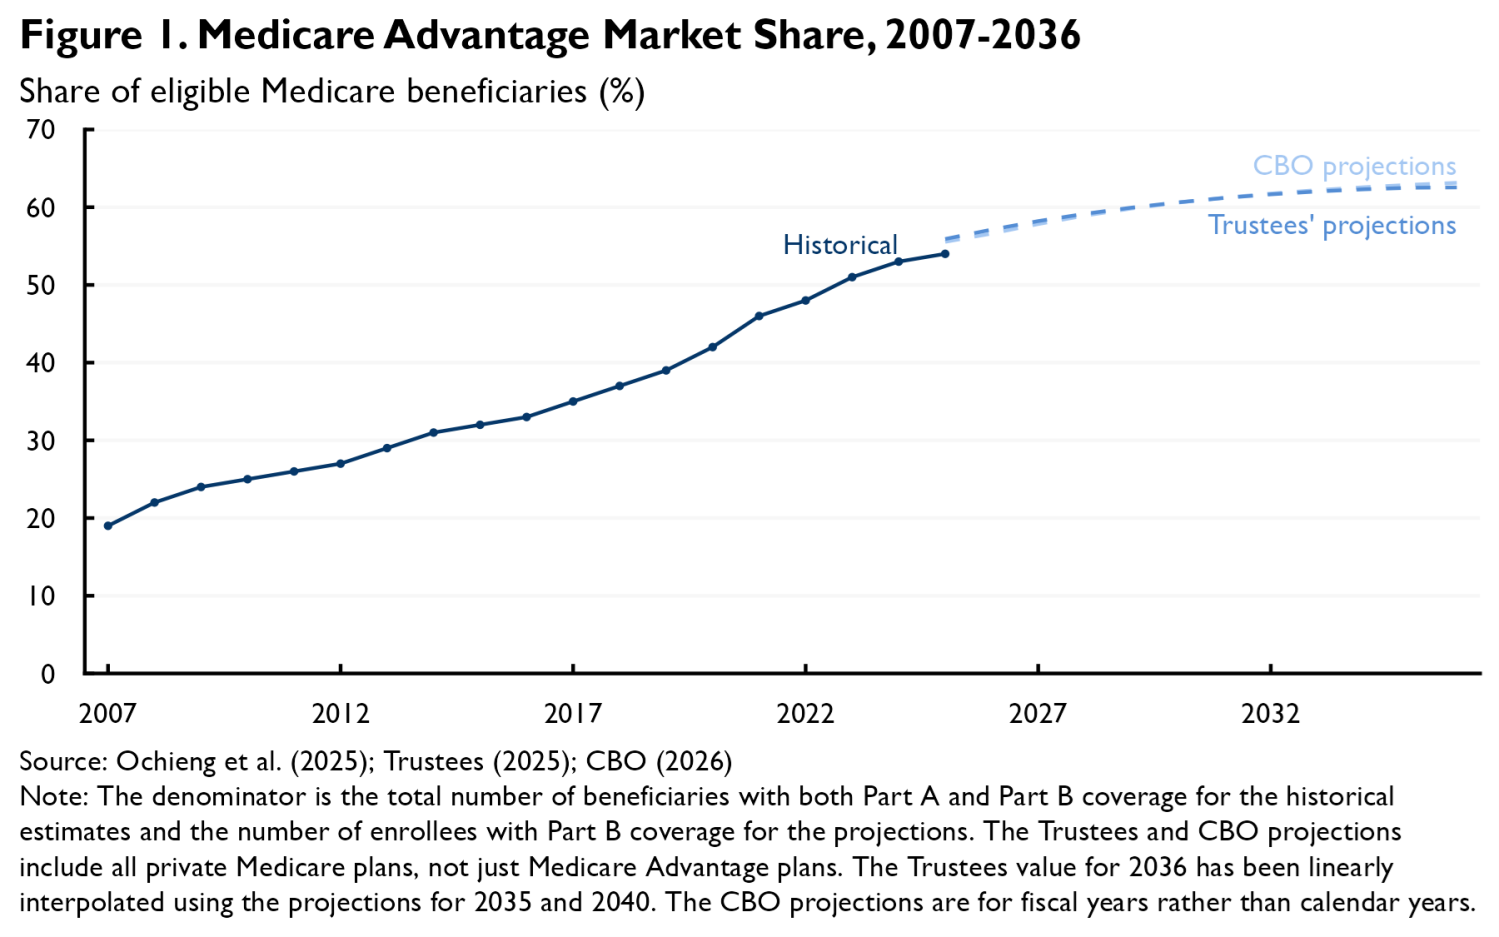
Medicare Advantage (MA) currently serves slightly more than half of eligible Medicare beneficiaries, following nearly two decades of steady growth. While MA’s growth has slowed recently, both the Medicare Trustees and the Congressional Budget Office expect MA’s market share to continue rising in the coming years, with each projecting that MA will attain a 63% market share by 2036 (see Figure 1). And these projections are uncertain, meaning that it is possible that MA’s market share will rise even further above historical levels than currently projected.
It is therefore natural to ask how continued growth in MA might affect the Medicare program’s performance. Most obviously, growth in MA tends to magnify the consequences of problems with MA and diminish the consequences of problems with traditional Medicare (TM). For example, Medicare currently pays far more to cover a beneficiary under MA than under TM, yet those higher payments often do not generate commensurate value for beneficiaries. This state of affairs is more wasteful, in the aggregate, when more people are enrolled in MA rather than TM.
This analysis focuses on a different aspect of this question: whether continued growth in MA’s market share—and a corresponding decline in TM’s—would lead to important changes in MA and TM’s underlying performance. In brief, I focus on four types of potential changes:1
- Accuracy of the MA payment system: One widely discussed issue is whether TM’s decline would reduce the accuracy of the MA payment system, which bases payments to MA plans on local TM costs. Notably, TM’s decline might make it hard to precisely measure local TM costs or change the degree to which MA enrollees are favorably selected relative to TM enrollees. I conclude that while the MA payment system has longstanding accuracy problems, recent work suggests that MA’s growth will do little to exacerbate those problems, at least in the medium-term. A corollary is that growth in MA does not, in itself, offer a strong rationale for making major changes to how MA plans are paid.
- Waning competitive pressure on MA plans from TM: Another key question is whether waning competition from TM might change how the MA market works. I argue that these effects could be more consequential; weaker competition from TM may lead insurers to seek higher profit margins and allow providers to extract higher prices from insurers, each of which would have costs for both MA enrollees and the federal government. These shifts may strengthen the rationale for policies aimed at intensifying competition among MA insurers or for more direct regulation of the prices that MA plans pay providers; however, steps like these would have important limitations, present tradeoffs, or both.
- Performance of the Part D and Medigap markets: A shift of enrollment from TM to MA could also affect the markets for Part D and Medigap coverage. I conclude that changes in the risk mix of TM and MA enrollees would likely put upward pressure on the premiums of standalone Part D and Medigap plans, while also eroding the generosity of MA plans that include Part D coverage, although evidence suggests that these effects may be modest in size. Reduced economies of scale in the Medigap market could also put some additional upward pressure on premiums in that market. A weakening of the Medigap market would strengthen the rationale for steps that would reduce beneficiaries’ reliance on Medigap plans, such as improving TM’s underlying benefit design.
- Effectiveness of TM’s provider payment systems: A final question is how declining TM enrollment may affect the performance of TM’s provider payment systems. While most aspects of TM’s payment systems seem likely to be unaffected, some observers have raised the question of whether falling TM enrollment might pose special challenges for TM’s accountable care organization (ACO) programs (and other payment arrangements where providers are compensated based on their patients’ average spending). While it is intuitive that the greater statistical noise associated with smaller patient populations could pose problems for these types of arrangements, I conclude that the magnitude—and even the direction—of these effects is unclear. One exception is that declines in TM market share would cause a modest (and likely unwarranted) decline in how many providers are eligible to form ACOs unless policymakers reduced the minimum number of TM patients a group of providers must serve in order to form an ACO.
In sum, MA’s rise appears likely to degrade the underlying performance of both MA and TM, but perhaps only in a subset of the areas that have attracted concern; in practice, the biggest problems may stem from a reduction in the competitive pressure that TM exerts on MA. Targeted reforms may be able to limit this degradation, but likely could not eliminate it. Thus, these considerations likely strengthen the case for reforms that would shore up TM’s competitive position and slow MA’s rise, such as reducing payments to MA plans, reforming TM’s benefit design, or improving TM’s ability to manage utilization. At the same time, the strongest rationale for steps like these would likely remain improving the program at any level of MA penetration, not addressing new problems created by MA’s growth. More generally, this analysis suggests that while continued growth in MA would raise some new issues, it would likely not radically alter the challenges Medicare policymakers face—or the menu of options for addressing them.
The remainder of this analysis examines these points in greater detail.
Accuracy of the MA payment system
The MA payment system generally aims to base payments to MA plans on what it would cost to cover the plans’ enrollees under TM. In practice, this is achieved by having plans bid against “benchmarks” that are based on county-level estimates of average per-enrollee TM spending, risk-adjusted to reflect differences between each plan’s enrolled population and the local TM population. Many observers have raised the question of whether the ongoing decline in TM’s market share will reduce the accuracy of these benchmarks, perhaps even undermining the viability of this system and necessitating fundamental changes in how MA plans are paid.
These concerns take two basic forms. One is that, as TM shrinks, the samples available to estimate county-level average TM spending also shrink, reducing the statistical precision of those estimates. My recent work with Samantha Crow and Julia Paris suggests that this is unlikely to be a quantitatively important concern. We estimate that even if TM’s market share continues to fall at the pace that it fell from 2014 to 2024, the median Medicare beneficiary will live in a county where the standard error of the estimate of local TM costs used in setting MA benchmarks will be 0.7% of underlying TM costs in 2033, up only modestly from 0.6% in 2022.2 Even the 95th percentile beneficiary will be in a county with a standard error of 2.4% of underlying TM costs in 2033, which is similarly up only modestly from 1.9% in 2022.3
A second concern is that, as TM shrinks, the beneficiaries still in TM will become more and more unusual; this could make their spending an increasingly poor guide to what it would cost to cover MA enrollees under TM and, thus, an increasingly poor basis for setting MA payments. This is, on its face, a reasonable concern, as past experience has shown that differences between TM and MA enrollees can substantially reduce payment accuracy. Indeed, TM enrollees currently have markedly greater health care needs than MA enrollees. Because this “favorable selection” into MA is not fully offset by the MA risk adjustment system, it inflates payments to MA plans by an estimated 11% in 2026. However, it is not clear a priori whether the payment accuracy problem created by favorable selection will get larger or smaller as MA grows and TM shrinks.
My recent work with Samantha Crow examines this question in detail. We show that it is theoretically ambiguous how payment accuracy will change. This is because beneficiaries who switch from TM to MA when MA penetration rises are likely to have lower costs than those who stay in TM, but higher costs than those already in MA. Thus, while higher MA penetration is likely to increase the average cost of TM enrollees, it is likely to also increase the average cost of MA enrollees. Depending on the precise circumstances, the difference in (risk-adjusted) costs between TM and MA enrollees, which is what matters for the accuracy of payments to MA plans, may increase, decrease, or remain the same. When we then examine this question empirically using data on selection behavior and MA penetration across counties and over time, we estimate that the net effect of rising MA penetration is close to zero. A corollary is that selection changes are unlikely to have much effect on the generosity of MA plan offerings, subject to some caveats about how selection affects Medicare Part D discussed below.4
In sum, rising MA penetration appears unlikely to substantially reduce the accuracy of the MA payment system, at least for the foreseeable future. This does not mean that the MA payment system is currently performing well. To the contrary, MA plans are currently being paid around 15% more than the law requires due to favorable selection and MA plans’ diagnosis coding efforts. But there appears to be little reason to expect that rising MA penetration will make this problem worse. Similarly, rising MA penetration does not appear to offer a compelling rationale for favoring reform approaches that break the link between MA payments and TM costs (e.g., approaches that would set benchmarks based on MA plans’ bids) over alternative approaches to reform.
Competitive dynamics within MA
Another important question is how TM’s decline may affect the competitive landscape facing MA insurers. When crafting and pricing plans, insurers must consider how their decisions will affect their competitive position relative to TM, not just other insurers. But as TM becomes less attractive, it is likely to exert less competitive pressure on MA. This section considers two ways this could reshape MA market outcomes and how policymakers could cope with those changes.
Effects on insurer profit margins
One natural concern is that fading competitive pressure from TM would lead insurers to submit less aggressive bids in pursuit of higher profit margins.5 These higher bids would increase federal costs while also eroding the “rebates” that fund extra benefits (e.g., reduced cost-sharing, lower premiums, or coverage for additional services) for MA enrollees.
One good reason to worry about this scenario is that the MA market is highly concentrated, which suggests that competition among MA insurers may do too little to discipline insurer behavior. As of December 2025, the two largest insurers in a county captured 66% of MA enrollment, on average, and 93% of MA enrollment was in counties that would be considered highly concentrated under federal merger guidelines.6 Thus, unless TM’s decline spurs substantial entry into the MA market, it appears likely to reduce competitive pressure on insurers.
Research on how insurers respond when payments to MA plans become more generous validates the concern that fading competition from TM would allow insurers to extract higher margins. This research finds that higher payments are, at best, only partly passed through to enrollees. Since raising payments to MA plans is one way of weakening TM’s competitive position, this evidence is consistent with the view that a weaker TM will allow insurers to capture more for themselves.
One way to prevent this type of upward pressure on insurer margins would be to take steps to shore up TM’s competitive position, such as reducing payments to MA plans or improving TM benefits; I return to these options in the conclusion. However, whether by choice or necessity, policymakers may find themselves wanting options that could rein in insurer margins even as TM remains a weak competitor. There are options in that vein worth considering, although they often have important limitations, involve tradeoffs, or both:
-
Increasing the MA bidding system’s rebate percentage: One approach would be to make structural reforms to the MA bidding process. Under that process, plans submit bids that reflect their price to deliver the base Medicare benefit. When an MA plan’s bid is below the benchmark, it receives a percentage of the difference as a “rebate” that it can use to provide benefits beyond those included in the base Medicare benefit (e.g., reduced cost-sharing or lower premiums). The rebate percentage varies based on a plan’s performance on certain measures of plan quality, but averages around 66% in 2026.
Policymakers could consider raising the rebate percentage to 100% (and simultaneously reducing benchmarks to hold total payments to MA plans fixed). This could encourage insurers to submit lower bids and offer correspondingly richer packages of added benefits. At present, a plan that lowers its bid by a dollar can offer only 66 cents in additional benefits to enrollees (on average); with a 100% rebate percentage, the full dollar could be used to offer additional benefits, making aggressive bidding a more effective competitive strategy.
While insurers might respond to a higher rebate percentage by targeting lower profit margins, they might also seek to lower their bids in other ways, such as by tightening utilization controls or narrowing networks. If insurers’ interests are well-aligned with beneficiary interests, then these responses could also be beneficial; concretely, this change would encourage plans to eliminate plan features that generate more than 66 cents but less than a dollar of value for beneficiaries per dollar the insurer spends. But if insurer and beneficiary interests are misaligned, which they likely are to some degree (e.g., because imperfect risk adjustment leaves insurers with incentives to avoid some types of enrollees or because beneficiaries undervalue some plan features when selecting plans), then these responses could be harmful. Thus, raising the rebate percentage might or might not be desirable on balance even if it squeezed insurers’ margins.
-
Make it easier for consumers to compare MA plans: Another potential approach would be to make it easier for beneficiaries to compare MA plans via steps like standardizing plan designs, limiting how many plans insurers can offer, or providing better decision tools. Steps like these could help shift toward the plans that are offering the best terms, and perhaps correspondingly increase the pressure on insurers to price aggressively.
It is unclear how effective these types of policies would be in mitigating upward pressure on insurer margins. Simply giving enrollees better information appears to often have small effects on plan choices, and one study examining standardization found that it did little to make enrollees more price sensitive, which suggests that these types of policies might do little to increase insurers’ incentives to price aggressively. On the other hand, when well designed, both standardization and limiting plan offerings do appear to encourage enrollees to select plans that better meet their needs, which could shift enrollment toward plans that are priced more aggressively (or that are better for enrollees in other ways), even absent changes in insurer behavior. These types of interventions may also have relatively few downsides, although some—especially aggressive plan standardization—could reduce insurers’ scope to innovate on plan design to some degree.
-
Strengthening medical loss ratio (MLR) requirements: The two approaches above are aimed at intensifying competition among MA plans. Another way policymakers could respond to rising MA profit margins would be to strengthen MLR requirements. In MA, those requirements currently require insurers to spend at least 85% of their revenues on claims. Raising this standard or enforcing it more effectively could, in principle, prevent insurers from taking advantage of TM’s weakness to claim large profit margins.
However, there is reason to doubt that this would be an effective (or even desirable) strategy in practice. To start, enforcing MLR requirements is challenging; this is especially true where insurers are vertically integrated with other types of entities (e.g., pharmacy benefit managers and providers), which creates opportunities to recast profits as claims payments to affiliated entities. While there may be ways policymakers could improve enforcement, it is questionable how successful they would be. Moreover, where MLR requirements do bind, they can weaken insurers’ incentives to efficiently manage claims spending since an insurer can increase its MLR by either reducing revenues or increasing claims spending, meaning that a more effective MLR regime could, at least in part, simply replace insurer profits with additional (and plausibly low-value) payments to providers.
It is worth noting that policies like these could be worth considering even with MA’s market share—and TM’s competitive position—as it is today. But they may have larger benefits in a world with a weaker TM, so their downsides and limitations might be more worth accepting.
Effects on provider prices
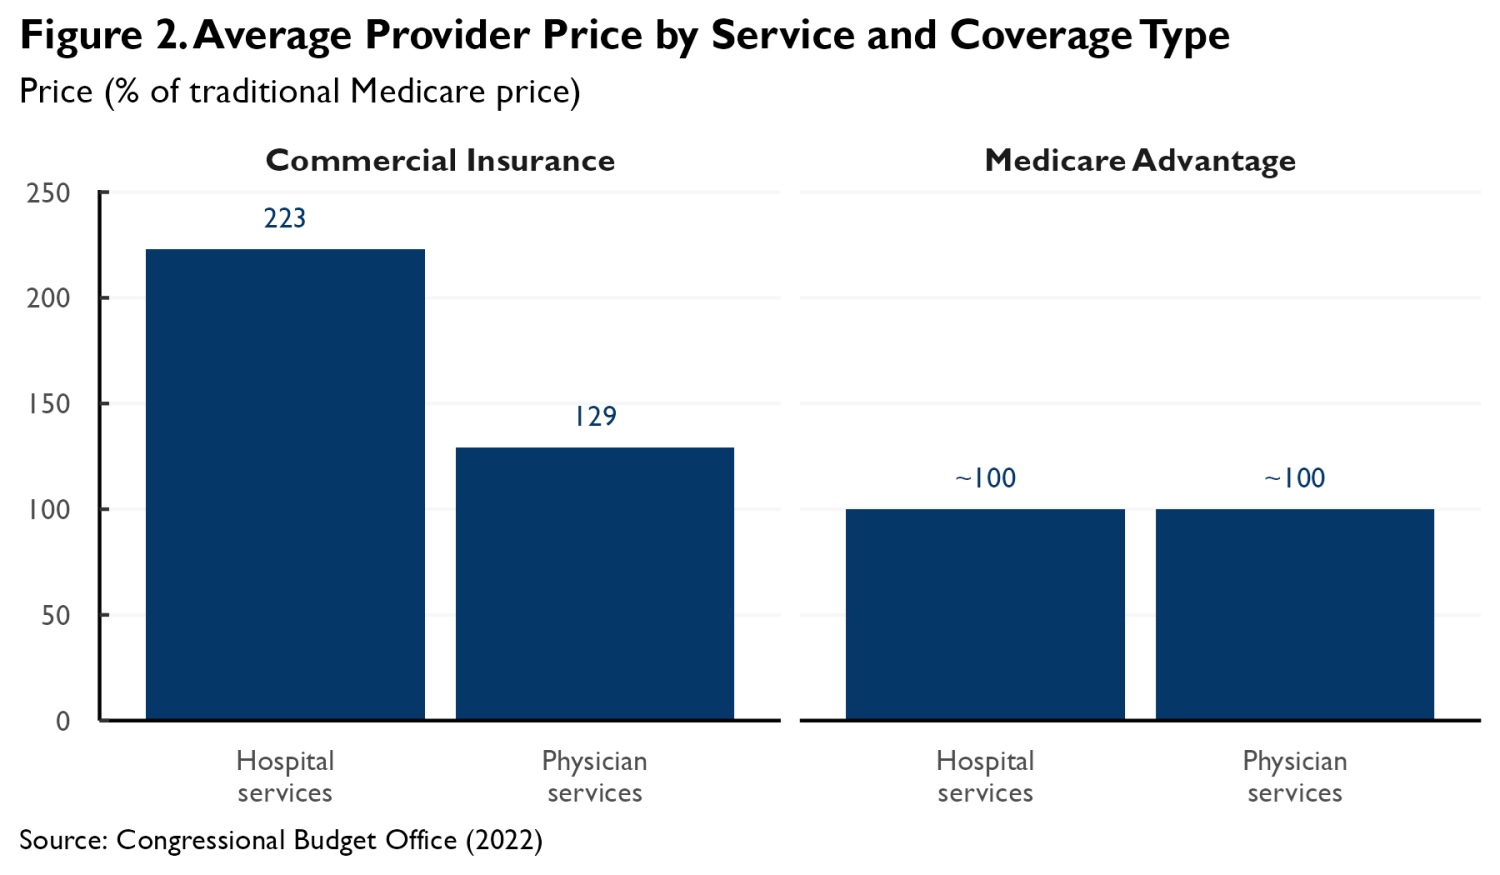
Another question is how insurers’ negotiations with providers might change as TM weakens. A striking feature of the MA market is that MA plans have, at least historically, paid physicians and hospitals prices close to TM’s prices. This differs markedly from the commercial insurance market, where insurance plans pay prices that far exceed TM’s, as depicted in Figure 2 using estimates from a literature review published by the Congressional Budget Office.
The competitive pressure historically exerted by TM may be an important reason that MA plans have succeeded in holding prices to TM levels. When TM is a strong competitor, MA plans can credibly argue that paying prices much above TM’s would make it impossible for them to bid low enough to attract substantial enrollment away from TM. This, in turn, may allow insurers to credibly threaten to break off negotiations if providers demand prices that high. As TM weakens, providers may recognize that insurers have room to pay more, causing prices to rise.
A caveat is that the prices that MA plans pay may also be disciplined by other features of the MA market, notably the fact that the amounts that providers can collect for out-of-network care are capped at what TM would pay for that care. This cap may increase insurers’ leverage when negotiating in-network prices by effectively giving them the option to pay the TM price in the absence of a network agreement. Downward pressure on negotiated prices exerted by the out-of-network cap would likely persist even if the competitive pressure exerted by TM waned.
But there is likely a limit to how much the cap on out-of-network prices alone can reduce in-network prices since, outside of emergency situations, providers have the option to turn away out-of-network patients. Indeed, my work with Bich Ly has estimated that, on its own, an out-of-network cap can only reduce the prices of non-emergency services by 13%, much less than the difference between what MA plans pay providers and what commercial insurance plans pay providers. This suggests that competitive pressure from TM is part of why the prices paid by MA plans are as low as they are. Thus, if the competitive pressure exerted by TM continues to wane, the out-of-network cap might no longer be enough to hold prices to TM levels.
It is not clear when this point might be reached. Recent research using hospital price transparency data suggests that MA prices remain close to TM levels, at least on average, even in the geographic areas with relatively high MA penetration. Prior work using claims data from the 2010s similarly found little relationship between MA penetration and the prices paid by MA plans. This suggests that the market has not yet reached the point at which the MA out-of-network cap will lose the ability to hold prices to TM levels. At the same time, the fact that the market has not yet reached this point does not mean that it never will.
If the prices MA plans paid providers did begin to rise, it would have important consequences. Insurers would likely begin to submit higher bids, which would both erode the “rebates” that plans use to fund additional benefits and increase federal costs. The upward pressure on insurers’ costs would serve as a brake on the decline in TM’s competitive position, meaning that provider prices would be unlikely to ever rise near the levels observed in commercial plans. But even small shifts in that direction could have meaningful effects on bids, federal costs, and enrollees.
These shifts could also reshape the political economy of MA. If the prices that MA plans pay began to depend on TM’s competitive position, this would give providers an incentive to oppose proposals to reduce payments to MA plans, as MA payment reductions would likely improve TM’s competitive position and thus reduce what providers are paid in MA. Adding provider opposition to insurer opposition could make such changes harder to enact.
If policymakers wished to keep the prices that MA plans negotiate with providers from rising above TM levels, one strategy would be to shore up TM’s competitive position. Alternatively, they could consider two types of regulatory approaches, although both have limitations:
- Directly regulate in-network prices: One potential strategy would be to go beyond the out-of-network cap currently in effect in MA and cap the in-network prices negotiated between providers and insurers at TM levels. This approach is conceptually simple but would pose some significant, albeit possibly surmountable, administrative challenges. Notably, the structure of provider-insurer contracts does not always mirror TM’s payment systems. Non-fee-for-service contracts are common in MA, and even fee-for-service contracts may define services differently than TM does. Thus, assessing whether a provider-insurer contract abides by this limit could be difficult, which would complicate enforcement. Providers could also try to circumvent the cap by seeking higher prices from the same insurers in other market segments. Alternatively, they could use leverage that could no longer be used to extract higher prices to demand weaker utilization controls.
- Augment out-of-network price regulation by requiring providers to accept out-of-network MA enrollees: As discussed in detail above, MA’s existing out-of-network cap may be limited in its ability to reduce in-network prices because providers can decline to treat out-of-network patients outside of emergency situations. Policymakers could consider limiting providers’ ability to turn away these patients, such as by requiring providers to accept all Medicare beneficiaries on equal terms, regardless of the provider’s network status under a specific MA plan.7 An essentially equivalent approach would be to allow an insurer to insist on implementing a “default” contract with a provider that specified that the provider would be paid TM rates and required the provider to accept the insurer’s patients.
By making it possible for an insurer’s enrollees to access a provider’s services at TM rates in the absence of a network agreement, these approaches would likely allow insurers to insist on in-network rates close to TM levels, even in the absence of meaningful competitive pressure from TM. Importantly, this approach would avoid the administrative challenges of directly regulating the wide range of potential in-network contract structures. It would, however, require policymakers to effectively enforce the requirement that providers accept out-of-network (or default contract) MA enrollees.
Outcomes in the Part D and Medigap markets
MA is not the only private insurance market intertwined with the Medicare program. Around eight in ten Medicare beneficiaries hold prescription drug coverage under Medicare Part D; in the case of TM enrollees, that occurs via a standalone Part D plan, while for MA enrollees, that generally occurs via an MA plan that includes integrated Part D coverage (often referred to as an MA-PD).8 Additionally, around four in ten TM enrollees hold Medigap coverage that pays all or part of their Medicare cost-sharing. This section considers how a shift of enrollment from TM to MA could affect the performance of the Part D and Medigap markets.
Effects on Medicare Part D
Perhaps the most important way that a shift of beneficiaries from TM to MA would affect the Part D market is by changing which types of beneficiaries are enrolled in MA-PDs versus standalone plans. Consistent with the earlier discussion of TM-MA selection dynamics, shifting beneficiaries from TM to MA is likely to increase average claims risk in both standalone plans and MA-PDs because beneficiaries who leave TM to join MA are likely to be costlier than those already in MA, but less costly than those who remain in TM. These shifts would not be offset by the Part D risk adjustment system because it is currently calibrated so that the effect of the risk adjustment payments averages to (approximately) zero within each market segment.9
While average claims risk—and, in turn, insurers’ bids—would likely rise in both market segments, federal subsidies for Part D coverage would likely change little. Federal subsidies are based on the national average Part D bid. While bids for both standalone plans and MA-PDs would rise, the weight assigned to the higher bids typically submitted by standalone plans would fall as TM shrank and fewer beneficiaries were enrolled in standalone plans. On net, the national average would change little; by definition, it reflects the risk profile of the Part D population as a whole, which does not change as beneficiaries are reshuffled between TM and MA.
In the standalone Part D market, the combination of higher bids and steady federal subsidies would translate into higher premiums for enrollees. This combination might also result in higher premiums in the MA-PD market, although plans could also respond by adjusting other aspects of their offerings, such as cost-sharing or supplemental benefits. In any case, these shifts would likely make coverage less generous in both segments of the Part D market. A corollary is that they would not necessarily themselves change the relative attractiveness of MA and TM.
It is possible to gauge the potential magnitude of these effects using the estimated model of how changes in TM market share affect average claims risk in TM and MA from my research with Samantha Crow (discussed above), with the caveat that these estimates are subject to meaningful uncertainty. Consistent with the discussion above, the estimates suggest that a decline in TM’s market share from 50% to 25% would increase average claims risk in TM and MA by similar amounts; the magnitude of those effects would range from around 3% to around 6%, depending on the specification used.10 While these estimates suggest that bid changes (and, in turn, premium changes) would be modest in percentage terms, they are not trivial in absolute terms; bids for standard Part D coverage averaged $239 per month in 2026, implying that a 6% increase in bids would average about $14 per month or around $172 per year.
Effects on the Medigap market
Shifts of enrollment from TM to MA could also have consequences for the Medigap market.
Most straightforwardly, the deterioration in TM risk mix described above could cause Medigap enrollees to pay higher premiums, although whether that occurs would depend on how premiums are set. In many circumstances, insurers are barred from varying premiums based on health status, including when individuals newly age into Medicare and, in some states, at all times. In these circumstances, premiums generally reflect the average cost of the relevant enrollees, so a worse risk mix will typically mean higher premiums. However, where insurers can vary premiums based on health status, premium effects may be smaller since premiums may largely reflect each enrollee’s own risk profile rather than the risk profile of TM beneficiaries overall. Nevertheless, it is likely that at least some Medigap enrollees would face higher premiums as TM shrinks.
The estimates discussed in the last subsection suggest that a decline in TM’s market share from 50% to 25% would increase the average risk of TM enrollees by 3 to 6%. Consistent with the discussion in the last paragraph, the change in the average risk of TM enrollees is likely an upper bound on the increase in Medigap premiums. This suggests that any premium increases would be modest, albeit not necessarily trivial. Medigap premiums averaged around $228 per month in 2024, so a 6% premium increase would equate to around $14 per month or around $164 per year.11
Falling TM enrollment could also affect the Medigap market by reducing the size of the population over which insurers can spread their fixed costs.12 Making these fixed costs harder to bear could cause some insurers to exit the market and, in turn, put upward pressure on premiums.
In practice, there is reason to doubt that these effects would be especially large, as the overwhelming majority of insurers’ costs are variable costs that scale up and down with enrollment. Indeed, from 2015 through 2024, claims costs accounted for 79% of Medigap insurers’ premium revenue, on average.13 And while granular data on Medigap insurers’ non-claims costs is scarce, it is likely that a large portion of these costs scale with enrollment too. Notably, Medigap insurers are generally reported to pay broker commissions of around 20% of the premium for new enrollees and around 10% of the premium for renewing enrollees, suggesting that much of Medigap insurers’ non-claims costs is accounted for by commissions. And many other non-claims costs, including many claims processing and customer service costs, also likely scale with enrollment. This suggests that fixed costs consume only a small fraction of insurers’ premium revenue. It follows that any effects of shrinking TM enrollment on Medigap insurers’ margins and, in turn, on their willingness to remain in the market would likely be modest.
While modest in magnitude, the deterioration in the Medigap market discussed here likely would strengthen the rationale for steps to reduce TM beneficiaries’ reliance on Medigap for protection against high cost-sharing. Modernizing TM’s benefit design, notably by adding an out-of-pocket limit, would be one natural approach to doing so. Policymakers could also consider providing an alternative to private Medigap plans by allowing TM enrollees to purchase supplemental coverage directly from the Centers for Medicare and Medicaid Services, although this approach would require policymakers to solve various novel policy design and operational problems, particularly related to premium-setting.
Effectiveness of TM’s provider payment systems
A final question is how TM’s decline might affect the performance of TM itself. In general, these effects seem likely to be relatively small. Unlike MA, where benefit designs and payment systems can change in response to changes in market conditions, TM’s benefit design and payment methods are largely fixed in law and regulation. And the payments that TM makes on behalf of a beneficiary generally do not depend on how many beneficiaries are subject to those rules.
However, some observers have noted a possible exception: TM’s ACO programs and other risk-based payment arrangements. More than half of TM enrollees are now served by providers participating in ACO or similar arrangements, so this is a non-trivial concern. This section considers three ways that declines in TM’s market share and, in turn, in the number of TM patients that typical providers serve, may affect the performance of TM’s ACO programs.14 (An appendix presents a mathematical model that formalizes some aspects of the discussion that follows.)
“Small numbers” effects
Under an ACO payment arrangement, payments to an ACO depend on how the spending of the ACO’s TM patients compares to a “benchmark” set by CMS; that benchmark typically partly reflects the ACO’s own past TM spending. If an ACO’s spending is less than its benchmark, then the federal government pays a share of the savings to the ACO, while if spending exceeds the benchmark, the ACO typically must pay a share of the excess to the government.
Declines in TM panel sizes change the variability of ACOs’ past and future spending and, in turn, the likelihood of different financial outcomes. Absent changes in provider participation, increased variability would likely have little aggregate effect, as instances where increased variability led to greater program savings would likely be roughly balanced by instances where it led to lesser savings (subject to one caveat discussed below). Thus, in the rest of this subsection, I focus on how these changes might affect providers’ willingness to participate in TM’s ACO programs.
Prevalence of “unattainable” benchmarks
One major factor in a provider’s decision about whether to sign an ACO contract is whether it expects to be able to hold its spending below its benchmark. If it cannot do so, ACO participation is likely to be a money-losing proposition. Indeed, there is empirical evidence that providers assigned benchmarks that they perceive as unattainable often decline to participate.
Declines in typical TM panel sizes may affect how often ACOs are assigned benchmarks that they view as unattainable. However, the direction of this effect depends on what information ACOs look at when assessing benchmarks. Two illustrative scenarios are worth considering.
Suppose first that ACOs look solely at their TM patients’ past spending when assessing benchmarks. In this scenario, the main reason that providers can end up with benchmarks that they view as unattainable is that ACO benchmarks typically rise much less than dollar-for-dollar with past spending.15 Thus, ACOs with high past spending may worry that their benchmarks under-adjust for ways in which their patients are idiosyncratically costly. Declines in TM panel sizes tend to attenuate these concerns by making an ACO’s past spending a noisier indicator of its patients’ true cost and, in turn, making high spending less indicative of under-adjustment. Thus, in this scenario, declining TM panel sizes may reduce how often providers receive benchmarks that they view as unattainable and, in turn, increase provider participation.
Suppose, on the other hand, that ACOs use information beyond their own past TM spending (e.g., the spending or utilization of their MA patients) to assess benchmarks. In this scenario, an ACO’s ability to estimate the true cost of its patient population may not degrade as TM shrinks, so the “under-adjustment” problem described in the last paragraph may not recede. Moreover, a different problem may worsen. As an ACO’s past TM spending becomes a noisier indicator of its patients’ true cost, it becomes more likely that an ACO will observe a mismatch between the TM spending data used in setting its benchmarks and the other data it holds. Where this other data shows higher costs than the TM spending data, an ACO may sometimes conclude that its benchmark is unattainable. Thus, in this scenario, declining TM panel sizes may increase how often providers receive benchmarks that they view as unattainable and, in turn, reduce provider participation.
In addition to showing that declining TM panel sizes have an ambiguous effect on provider participation, the preceding discussion suggests that one intuitively appealing response to falling TM market share—broadening the data used to set ACO benchmarks, such as by incorporating data on the spending and utilization of ACOs’ MA patients—may or may not increase participation. If ACOs already look at data beyond their own past TM spending when assessing benchmarks, then broadening the data used to set benchmarks could reduce the probability of mismatches between the data reflected in benchmarks and the other data ACOs hold, thereby ameliorating participation concerns. By contrast, if ACOs look primarily at their own past TM spending, then incorporating more data (which would generally entail sharing that broader set of data with ACOs) could actually reduce participation by making it easier for ACOs to assess whether their patients are idiosyncratically costly and, in turn, whether a particular benchmark is unattainable.
I am unaware of direct evidence on what information ACOs use when making participation decisions, which makes it difficult to reach firm conclusions on which scenario is more realistic. But it is worth noting that an ACO wishing to draw on non-TM data would face challenges in doing so. In practice, MA is the most obvious alternative data source, but incorporating those data would require developing a method to adjust for systematic differences in spending between MA and TM (e.g., due to differences in risk mix or utilization management), which would not be straightforward.16 These complexities offer reason to suspect that ACOs rely primarily on TM data in practice. This, in turn, suggests that declining TM panel sizes would tend to reduce how often ACOs receive benchmarks that they perceive as unattainable and, similarly, that broadening the data used in setting ACO benchmarks would make participation concerns worse, not better.
Uncertainty in financial performance
Lower TM panel sizes could also affect ACOs’ willingness to participate by changing how uncertain their performance is and, in turn, the amount of financial risk they bear when participating. But the direction of this effect is less clear than it may seem.
Smaller TM panel sizes would clearly make it harder for an ACO to predict how its spending will compare to its benchmark, for two reasons. First, when an ACO serves fewer TM patients, those patients’ average spending becomes more variable. Second, if an ACO’s main basis for predicting its financial performance is its TM patients’ prior spending, then falling TM panel sizes make those forecasts less precise (consistent with the discussion in the last subsection).
Importantly, however, this is not the end of the story. While lower TM enrollment does reduce an ACO’s ability to predict how its patients’ average spending will compare to its benchmark, it also reduces the scale of the risks involved since gains and losses scale with the number of patients covered. Correspondingly, as shown formally in the appendix, the total variability of an ACO’s payoff under an ACO contract is smaller when enrollment is lower. Thus, the aggregate amount of financial risk involved in an ACO contract actually declines when enrollment declines.
This does not necessarily mean that declining enrollment would increase participation; while the amount of risk declines, the expected rewards decline as well, and it is unclear which effect would dominate.17 However, experience from MA offers some reason to suspect that any participation headwinds would be modest; ACO-like contracts are widely used in MA even though most beneficiaries live in counties where even the largest MA plan has less enrollment than TM.18
There is one additional issue to consider in the case of “one-sided” ACO arrangements (that is, arrangements in which ACOs are not required to make a payment to the federal government if spending exceeds the benchmark). In these arrangements, the increase in variability caused by a decline in TM panel size will tend to increase an ACO’s expected (per enrollee) payoff since lower-than-expected spending triggers a commensurately larger shared savings payment from the federal government, but higher-than-expected spending can never trigger a shared loss payment. This effect would tend to boost participation, predominantly among ACOs that expect to have spending close to the benchmark level.19
As a sidenote, the existence of one-sided arrangements does necessitate a caveat to the point made at the beginning of this subsection that changes in variability of ACO’s spending are likely to affect the performance of TM’s ACO programs only via changes in participation. Notably, the dynamics discussed in the last paragraph would tend to increase expected payouts to ACOs in one-sided arrangements even if participation did not change; these additional payments would need to be weighed against the potential boost to participation. Greater variability could also dull the incentives of ACOs in these arrangements to reduce spending; this is because greater variability would increase how often ACOs end up with spending above their benchmarks, where marginal reductions in spending generate no financial benefit to the ACO.
In practice, effects specific to one-sided arrangements may not be that important. Eligibility for one-sided arrangements has narrowed in recent years. Consistent with this, as of 2023, one-sided arrangements accounted for less than one-quarter of the beneficiaries associated with ACOs operating under TM’s two largest ACO programs, the Medicare Shared Savings Program and the ACO REACH model operated by the Center for Medicare and Medicaid Innovation.20
Economies of scale
Lower TM market share could make ACO participation less attractive in another way: making it harder for participating providers to take advantage of economies of scale. Notably, successful participation in these types of models may require incurring certain fixed costs, such as purchasing new data systems or redesigning care processes. Investments like these are less burdensome when they can be spread across a larger patient population.
However, there is reason to doubt that a reduction in economies of scale due to falling TM enrollment would substantially reduce participation in ACO programs. As noted above, MA plans have engaged many providers in ACO-like arrangements even though MA plans typically have much lower enrollment than TM. This could be because the relevant economies of scale are relatively small. Alternatively, it could be because ACO and ACO-like arrangements operated by different payers require providers to make similar types of investments, so providers’ ability to realize economies of scale depends on their scale across all payers, not any single payer.
Minimum size rules
Lower TM market share could also affect ACO participation by reducing how many providers are eligible to participate. The Medicare Shared Savings Program and the ACO REACH model both generally require that ACOs serve at least 5,000 TM beneficiaries, with some exceptions. As TM shrinks, fewer groups of providers may meet this size threshold.
This effect may be modest in practice. In 2023, ACOs with fewer than 10,000 beneficiaries (twice the current eligibility threshold) accounted for only 12% of all beneficiaries associated with ACOs.21 This suggests that even if TM’s market share were to fall by half from its current level, these rules would force only a modest contraction in ACO participation under TM.
Nevertheless, policymakers could prevent a decline in how many providers qualify for TM’s ACO programs by relaxing these eligibility thresholds, as they have already done to a limited degree under the REACH model. The discussion in the rest of this section suggests that declines in TM market share may not have large effects on whether providers choose to participate in ACO programs (if permitted to do so) or on how providers perform if they do participate. This suggests that adjusting the minimum beneficiary threshold proportionally when TM’s market share changes—so as to avoid a change in the universe of eligible providers—is likely desirable (or, at least, would be desirable if the threshold is currently set at an appropriate level).22
Conclusion
There is little question that the ongoing shift of beneficiaries from TM to MA changes the Medicare program’s performance by magnifying the importance of MA’s flaws relative to TM’s. This analysis has examined a somewhat different question: how MA’s rise may change the underlying performance of TM and MA and how policy may need to change in response.
I find that some of the concerns identified by other observers, especially concerns that falling TM enrollment may reduce the accuracy of the MA payment system or the effectiveness of TM’s ACO programs, may be less serious than they appear. By contrast, it does appear that growth in MA would modestly worsen offerings in the Part D and Medigap markets. Perhaps more importantly, it appears plausible that waning competitive pressure from TM would allow MA plans to capture higher profit margins and, at least in the long run, allow providers to negotiate higher prices with MA plans. Moreover, while policymakers have options for mitigating these effects, none are silver bullets and some come with potentially significant tradeoffs.
As such, MA’s rise and TM’s decline likely strengthen the rationale for policy changes to shore up TM’s competitive position.23 That could involve a variety of steps, including reducing payments to MA plans, reforming the TM benefit design (such as by adding a limit on out-of-pocket spending), or improving TM’s ability to manage utilization. At the same time, the strongest rationale for steps like these would likely remain improving the program at any level of MA penetration, not addressing new problems created by MA’s growth. More generally, this analysis suggests that while continued growth in MA would raise some new issues, it likely would not radically alter the challenges Medicare policymakers face—or the menu of options for addressing them.
Author

Related Content


-
Acknowledgements and disclosures
The author thanks Michael Chernew, Richard Frank, Michael McWilliams, and David Meyers for helpful comments on a draft of this analysis, Chloe Zilkha for excellent research assistance, and Rasa Siniakovas for excellent editorial and web-posting assistance. Arnold Ventures provided a grant that supported the writing of this analysis.
-
Footnotes
- Throughout, my focus is on “direct” effects of MA’s growth, rather than potential systemic effects on the health care system (e.g., changes in how often insurers elect to “piggyback” on TM’s payment systems or shifts in provider practice styles spurred by changes in exposure to MA and TM’s payment and utilization management regimes). This decision is driven largely by necessity, as these types of systemic effects are harder to study, especially where they operate above the local market level. Nevertheless, investigating such effects may be a useful direction for future work.
- The sampling distribution of these estimates is likely approximately normally distributed, which implies that approximately 68% of the county-level estimates should fall within one standard error of the true value, and approximately 95% of the county-level estimates will fall within two standard errors of the true value.
- This work also shows that while the methods used to estimate TM costs in counties with very low TM enrollment (which blend data for the county in question with data for surrounding counties) can introduce significant non-sampling error, this blending approach will continue to be used sparingly. Even in the lowest-enrollment scenario we consider, only 2.2% of beneficiaries will live in counties subject to blending by 2033.
- There are also some more minor caveats to this conclusion. If the amount by which favorable selection inflates payments to MA plans remains steady in percentage terms as MA penetration rises, then it would likely grow in dollar terms since, as discussed in the main text, rising MA penetration is likely to increase the average claims risk of MA enrollees. This could place some upward pressure on the value of the additional benefits that MA plans offer. On the other hand, as the average claims risk of MA enrollees rises, the cost of providing some types of additional benefits (e.g., reduced cost-sharing) would likely rise, which would likely put downward pressure on the generosity of MA plan offerings.
- The ultimate increase in bids may be larger than the increase in profit margins, as some of the incipient increase in profit margins may be dissipated via increased marketing costs or other channels.
- These estimates reflect tabulations of Centers for Medicare and Medicaid Services data on MA enrollment by contract at the county level. The average share of MA enrollment captured by the two largest insurers in a county is weighted by county MA enrollment. Insurers are aggregated to the parent organization level.
- Medicare program regulations already bar institutional providers from turning away Medicare patients in instances where they would accept patients with other forms of coverage. It is doubtful, however, that this requirement limits providers’ ability to turn away out-of-network MA enrollees, at least as currently applied.
- Enrollees in certain types of MA plans that do not offer prescription drug coverage are permitted to enroll in standalone plans, but these types of MA plans attract little enrollment in practice.
- Specifically, starting with the 2025 plan year, CMS separately “normalizes” risk scores for standalone Part D plans and MA-PDs. This change was designed to address the fact that standalone Part D plans were typically harmed by risk adjustment, while MA-PDs were typically benefiting from risk adjustment, despite evidence that standalone Part D enrollees cost more to cover than MA-PD enrollees. Even without separate normalization, it is questionable whether the risk adjustment system would offset these changes in risk mix to a meaningful degree; a shift of enrollment from TM to MA would likely increase average risk scores in both market segments, similar to the effects on true average claims risk.
- In detail, the paper presents a parameterized model of claims risk in MA and TM and how it varies with MA market share; estimates of the needed parameters appear in Table 2. Where relevant, I use the versions of the parameters that correspond to 2022, the final year included in the study. The model allows those parameters to vary across counties based on their average level of MA market share across the years 2008 and 2022. In constructing my estimates, I use parameters corresponding to the average of the national MA market shares shown for those in Figure 1. Note that while the estimates in the paper pertain directly to spending on Part A and Part B services, effects on the use of prescription drugs would plausibly be similar.
- The estimated average Medigap premium was calculated using data from the National Association of Insurance Commissioners’ 2024 Medicare Supplement Loss Ratios report for that year by dividing total premium revenues by the number of covered lives and dividing by 12.
- These types of effects are less likely in the Part D market because shifts of enrollment from TM to MA would likely have at most limited effects on the total number of people with Part D coverage.
- This estimate reflects the average of loss ratios reported for the relevant years in the National Association of Insurance Commissioners’ 2024 Medicare Supplement Loss Ratios report.
- I focus on TM’s ACO programs for concreteness and because they are currently by far the most important risk-based payment arrangements in TM, but similar considerations are relevant to TM’s various other risk-based payment arrangements, especially bundled payment models.
- ACO programs take this approach to limit “ratchet effects” that could undermine ACOs’ incentives to reduce spending. If benchmarks did move dollar-for-dollar with past spending, then reducing spending today would result in a dollar-for-dollar lower benchmark in the future, meaning that any additional shared savings payments earned today would be offset by lower shared savings payments in the future.
- One simple strategy might be to develop adjustment factors based on market-level utilization differences. However, this approach has the limitation that it would not be able to account for provider-specific cross-payer differences, which could be important in many instances.
- A long literature shows that taking on a larger number of independent risks may be either more or less appealing than taking on a smaller number, depending on the specifics of an agent’s risk preferences. Taking on a larger number of risks may be relatively less appealing in the ACO context since the spending outcomes of an ACO’s patients are likely correlated with each other, which means that the variability in the ACO’s aggregate payoff rises more quickly with enrollment than it otherwise would.
- Counties where TM’s market share exceeds the market share of the largest MA plan accounted for 87% of Medicare beneficiaries in December 2025. This estimate reflects tabulations of county-level data on MA enrollment by contract and total Medicare enrollment. These tabulations consider only Medicare beneficiaries with both Part A and Part B coverage. Insurers are aggregated to the parent organization level. This analysis includes all states except Alaska and Connecticut (for which the two files use slightly different geographic definitions), plus the District of Columbia.
- Similar considerations apply, albeit to a lesser extent, to two-sided models with asymmetric rules governing shared savings and shared losses.
- This estimate was derived by tabulating Medicare Shared Savings Program and ACO REACH financial results for 2023.
- The share of ACOs with fewer than 10,000 beneficiaries is larger: 40% in 2023. These estimates reflect tabulations of the Medicare Shared Savings Program and ACO REACH financial results for 2023.
- The question of how the threshold should be set in the first place is a distinct question. The arguments made in this section do not necessarily imply that it would be desirable to set a lower threshold at a given level of TM market share, as this would have the effect of opening the program to smaller providers. This may or may not be desirable and would hinge on considerations beyond those I discuss here.
- A caveat is that if policymakers believe that TM pays providers too little, then the upward pressure on the prices paid by MA plans might be a welcome change, rather than a problem needing a solution.
The Brookings Institution is committed to quality, independence, and impact.
We are supported by a diverse array of funders. In line with our values and policies, each Brookings publication represents the sole views of its author(s).