As the presidential primary season gets underway and the hordes of news cameras and pundits turn to actual voting rather than polling, the quadrennial question emerges: How closely do the February states—Iowa, New Hampshire, South Carolina, and Nevada—reflect the demographics of the nation?
If they don’t, is there a particular time in the primary season when a big enough sample of states has weighed in to provide a realistic picture of where the nation stands on each party’s candidates?
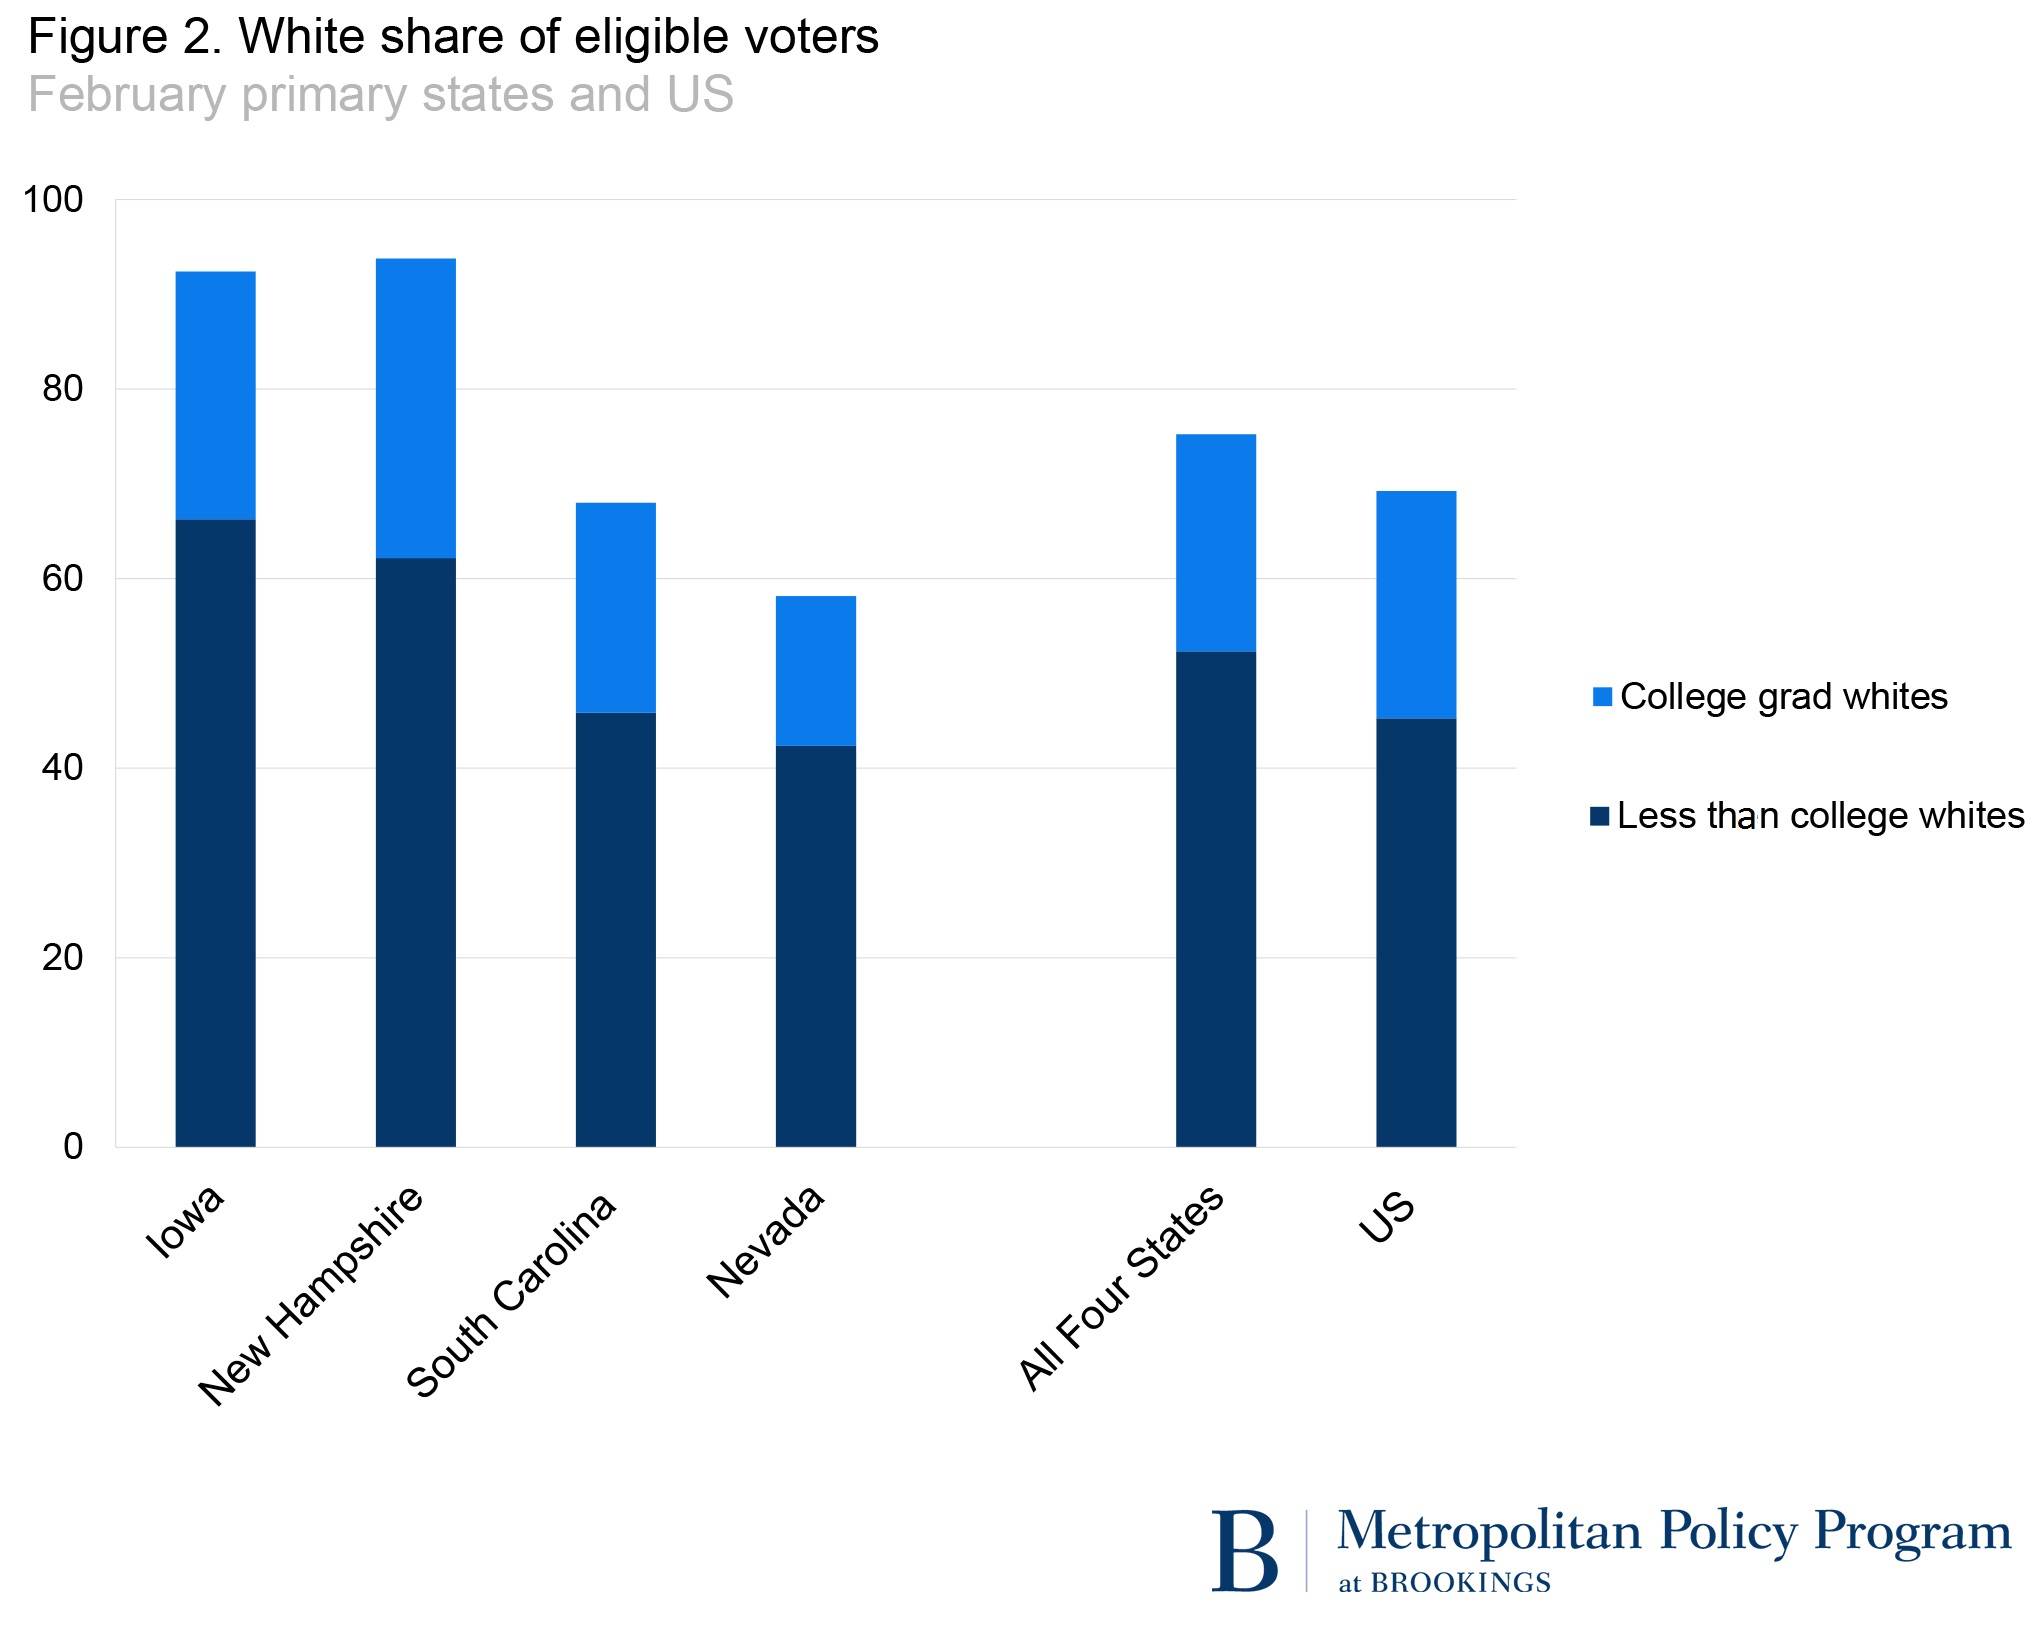
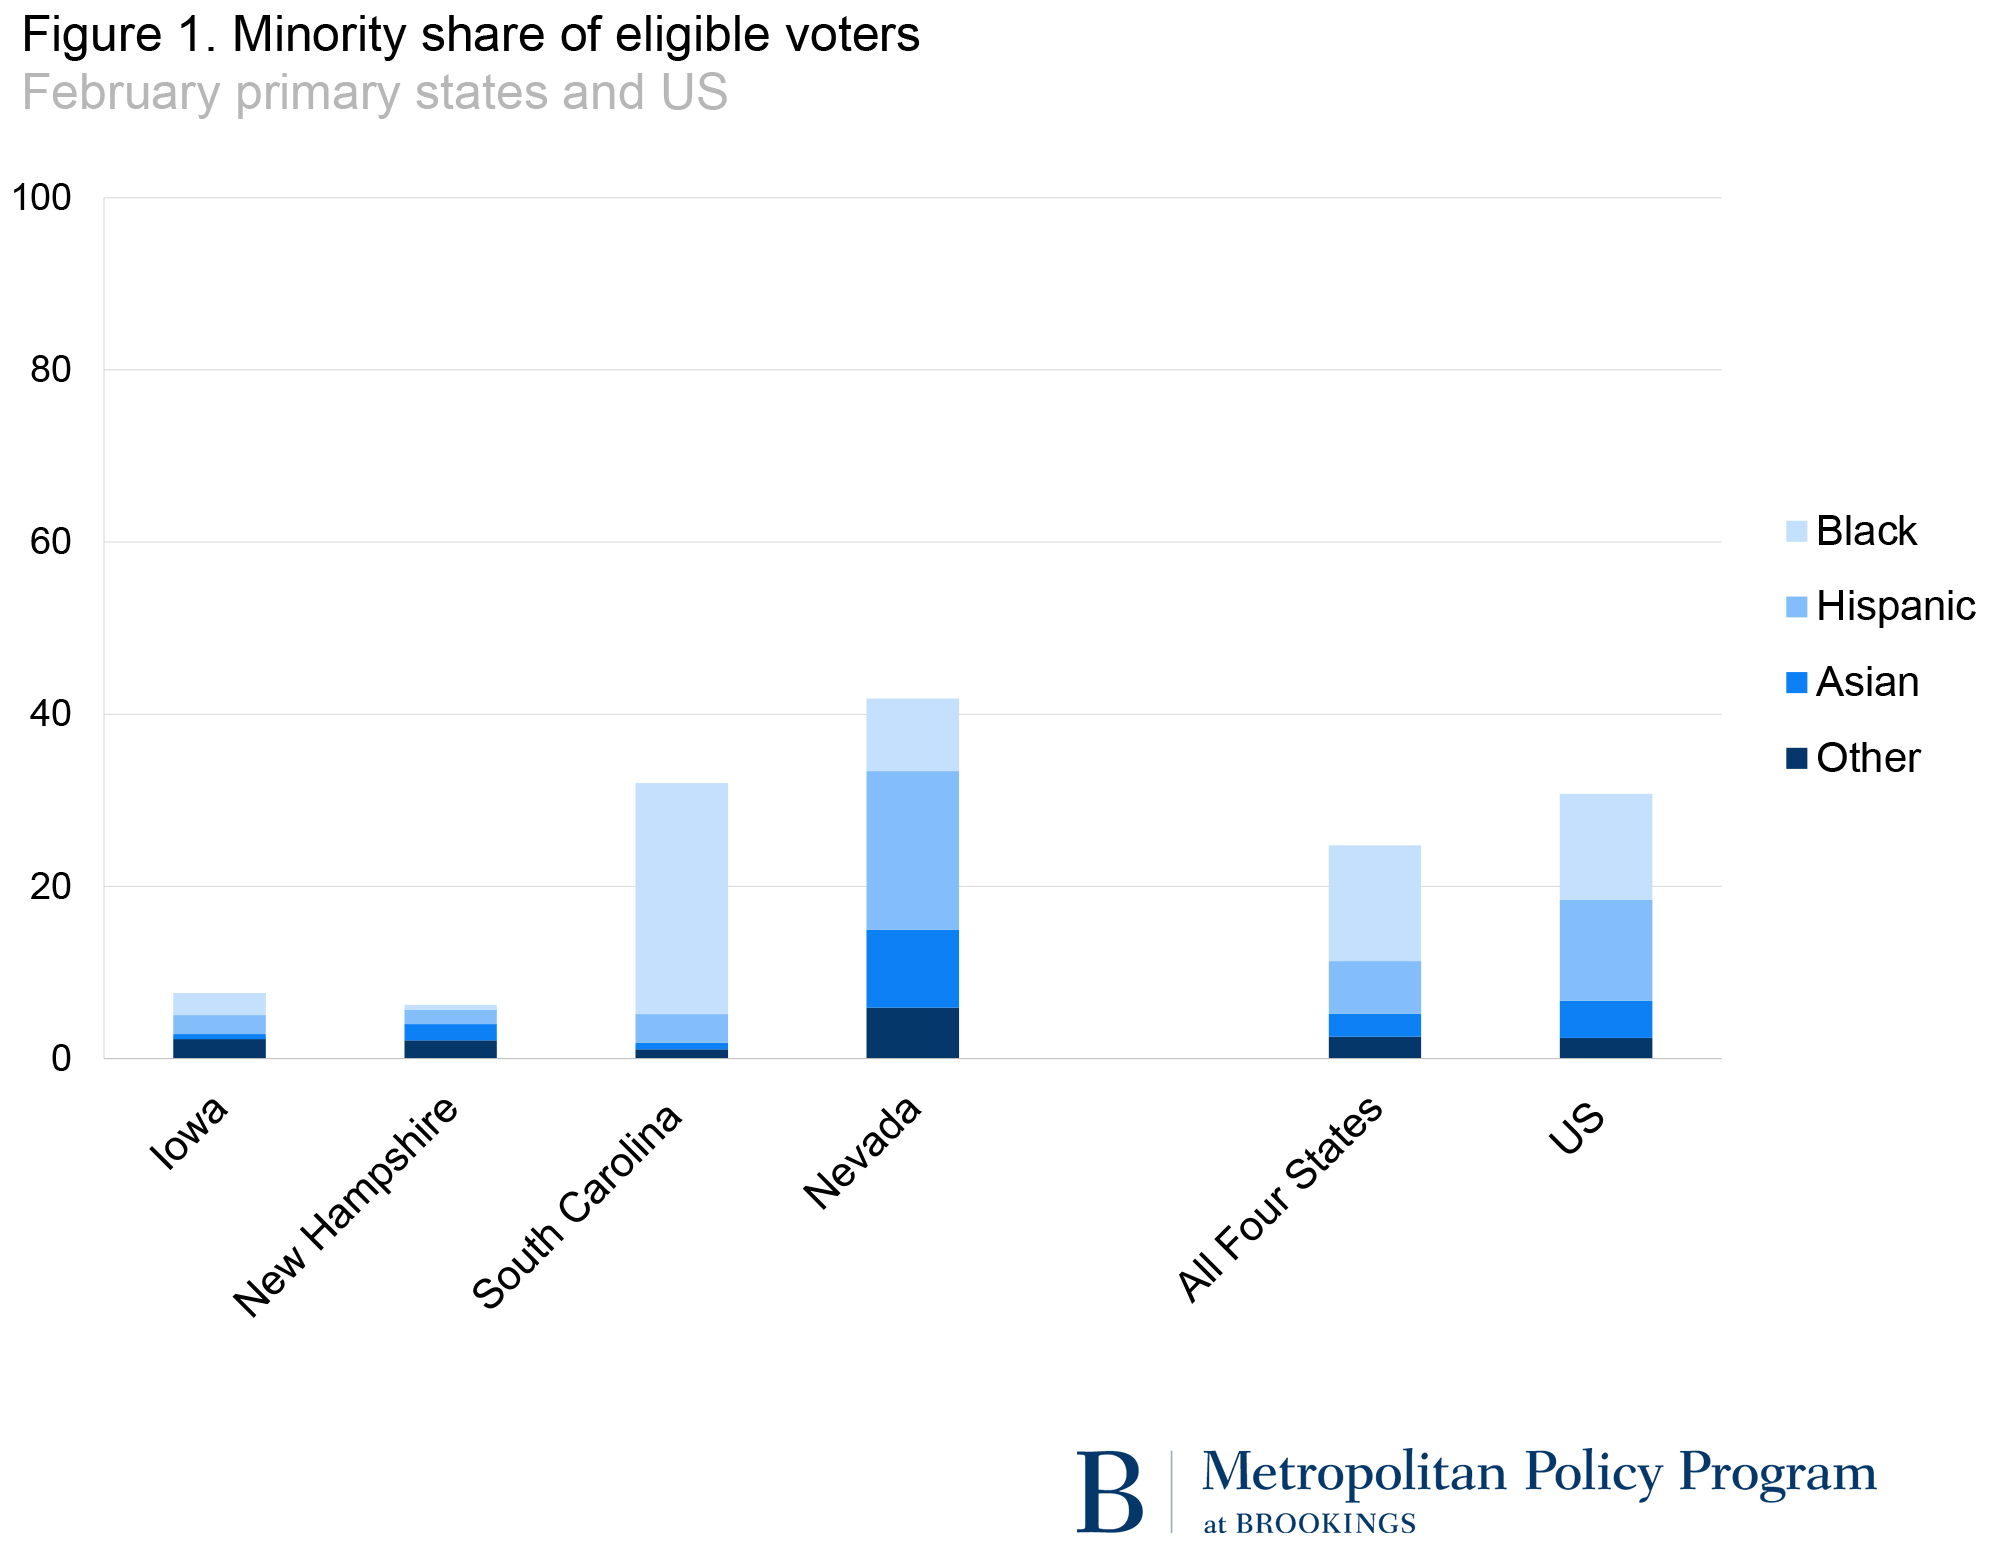
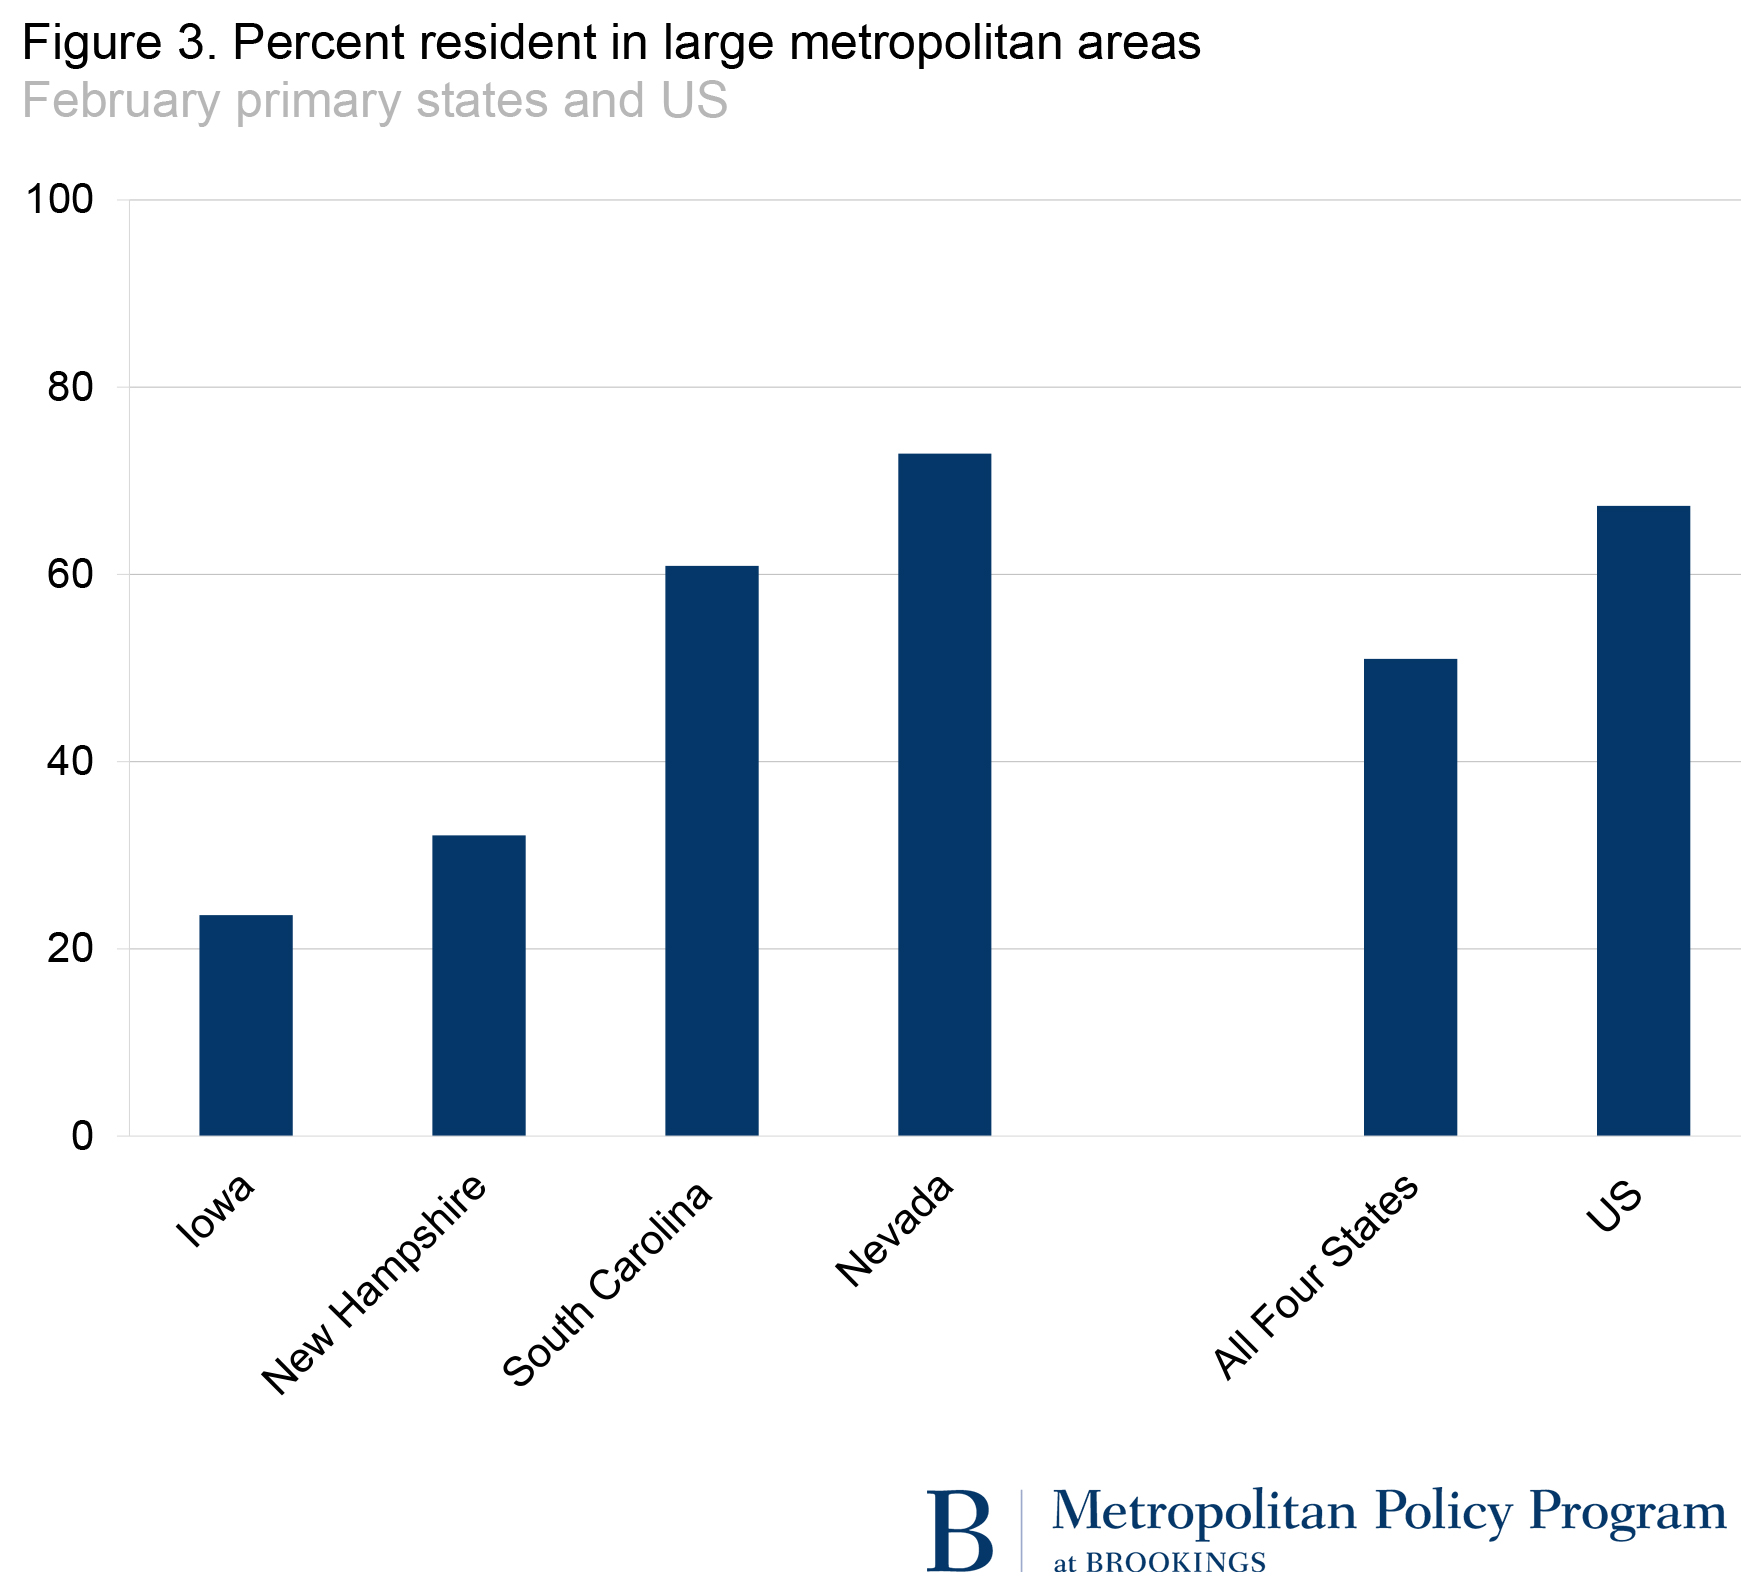
One way to test this is to examine key demographic attributes as the primary season unfolds with respect to each state’s eligible voters. The two early headliners, Iowa and New Hampshire, are among the least representative, ranking fifth and second,respectively, on smallest racial minority electorate (Vermont ranks first) at 8 and 6 percent (See Figures 1 and 2). Each has substantial white non-college graduate (or “white working class”) voting blocs at 66 percent and 62 percent of their eligible voters, respectively (compared with 45 percent nationally); though New Hampshire has a greater share of white college graduates than Iowa. Both states have electorates which are older, with half around age 50, and both are considerably less urban than the nation as a whole (Figure 3).
It would be difficult to find two more unrepresentative states on these attributes, although Vermont, Maine, West Virginia, North Dakota, and Montana would certainly be in that mix. In the future, Iowa and New Hampshire will become even less racially representative than the nation. The “States of Change” report I co-wrote with Ruy Teixeira and Robert Griffin projects the minority shares of their respective electorates to rise to just 17 percent and 9 percent in 2040, while the minority share of the nation’s electorate (now at 31 percent) will rise to 44 percent.
Both parties have attempted to compensate by adding the more racially diverse states of South Carolina and Nevada to the early state marquee. South Carolina’s electorate has an overrepresentation of blacks (27 percent), and Nevada’s is overrepresented by Hispanics (18 percent) as well as Asian and other non-black minorities (15 percent). Nevada is the epitome of a state that witnessed an explosion of diversity in recent decades. In 2000 its electorate was 76 percent white, compared with 58 percent now. Nevada’s white working class eligible voter population is similar to the nation as a whole but its white college graduate voting bloc is, at 16 percent, one of the smallest in the nation. Both South Carolina and Nevada are more urban than Iowa or New Hampshire—the former, home of metropolitan Greenville, Columbia, Charleston, and the suburbs of Charlotte, N.C.; the latter heavily dominated by metropolitan Las Vegas.
So, do the four February primary states, combined, reflect something like the national electorate? Well, no. As a group they are still whiter, older, and less urban than the nation with a higher share than the nation of white working class eligible voters, and they represent just 4 percent of the national electorate. (See Table)
Next month brings Super Tuesday’s March 1 primaries and caucuses for one or both parties in 14 states—representing more than a quarter of the US electorate. Here it is useful to survey two different groupings. First are the seven Southern states, participating in the so-called “SEC primaries” including, in order of size: Texas, Georgia, Virginia, Tennessee, Alabama, Oklahoma, and Arkansas.
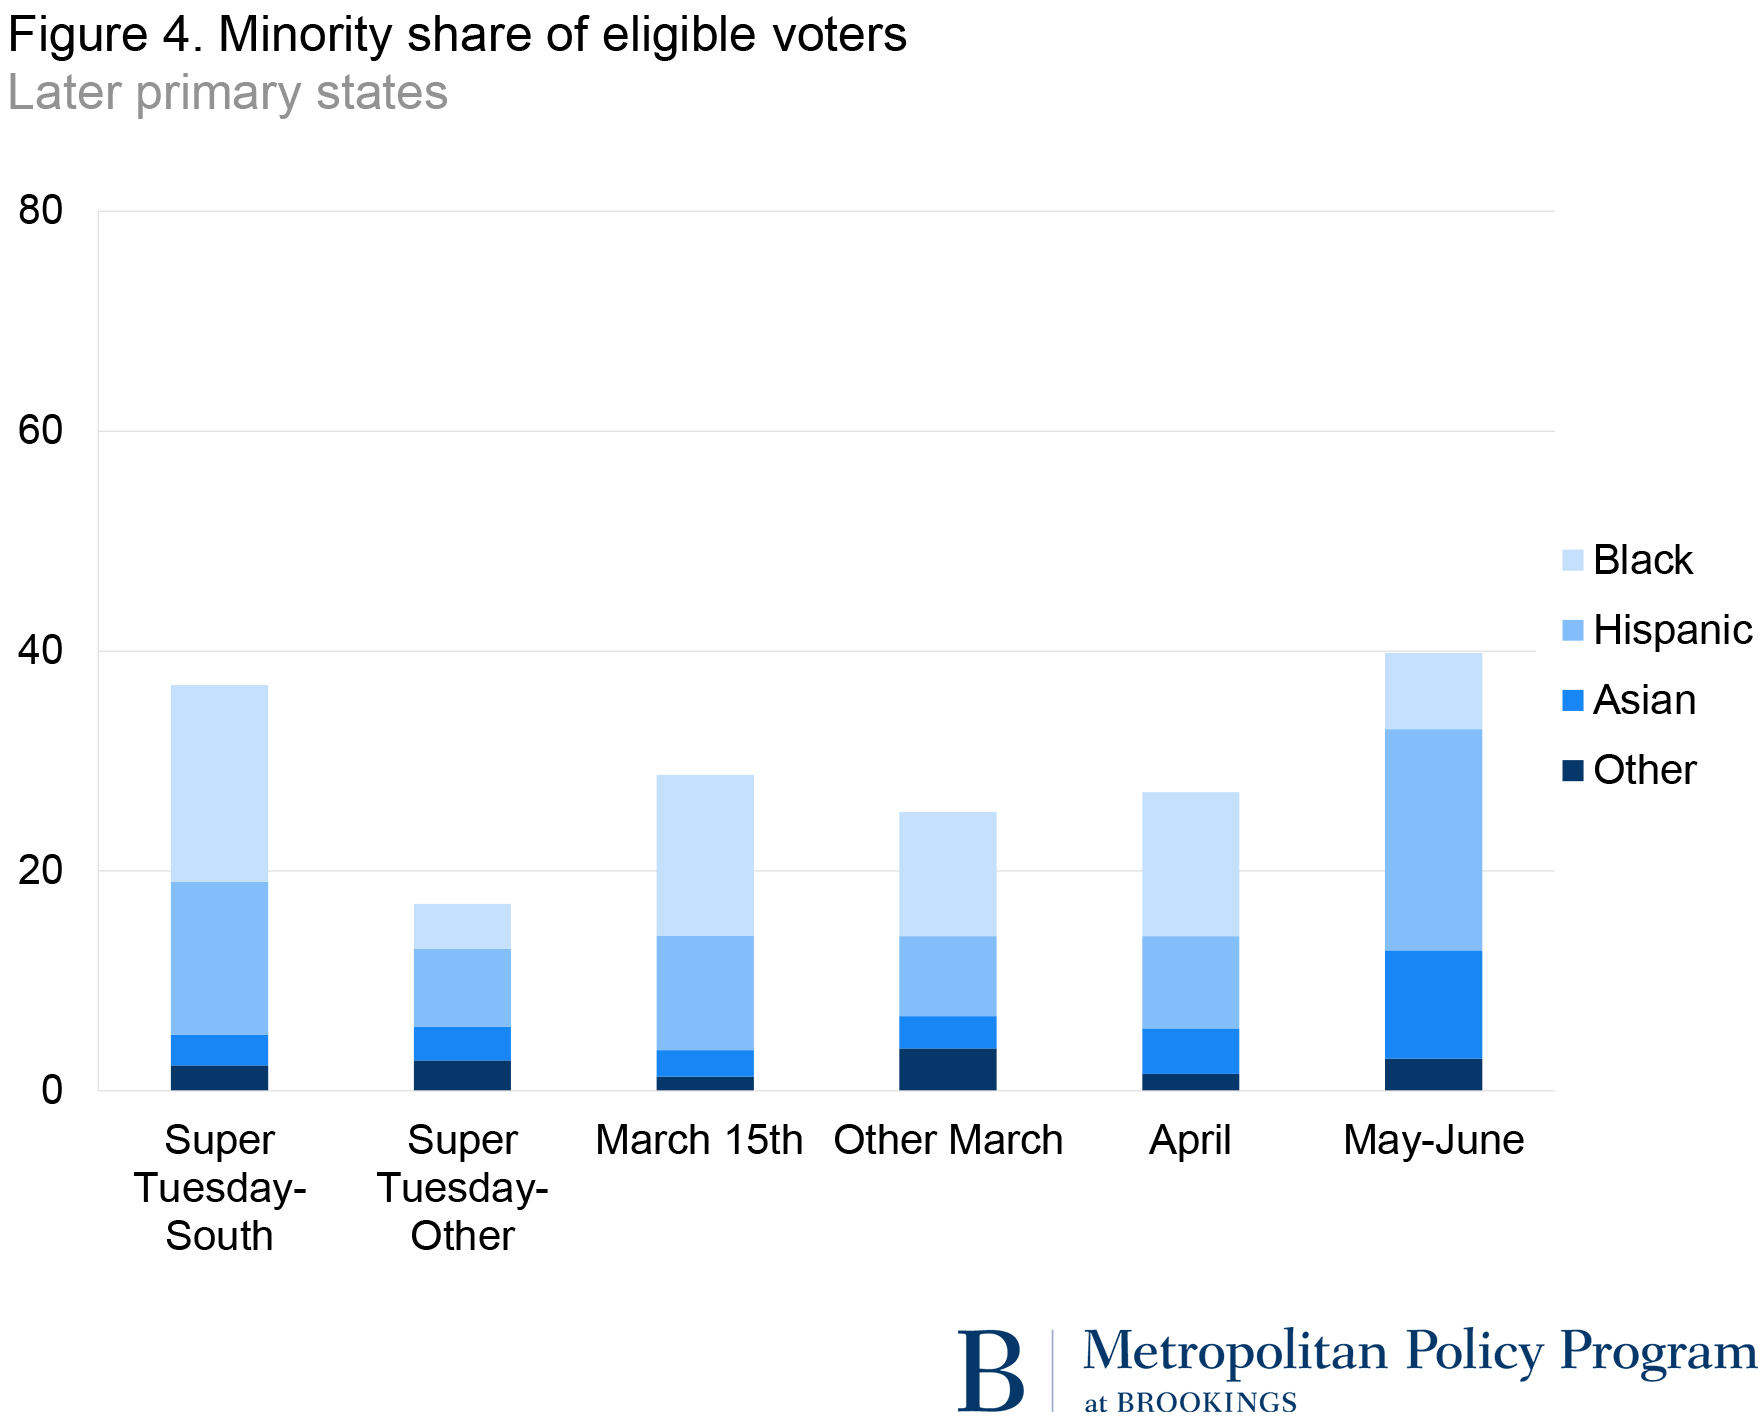
As a group, these states have a larger minority share (at 37 percent) than the nation and none have electorates made up of less than one-fifth minorities. In all except one (Oklahoma) blacks comprise a larger share of their state’s electorates than in the nation overall; and the strong representation of Hispanics among Texas eligible voters (29 percent) contributes to the high diversity of these states (See Figure 4).
The second group of Super Tuesday states includes Massachusetts, and Vermont in New England, Minnesota and North Dakota in the Upper Midwest and Colorado, Alaska, and Wyoming in the West (the latter two states and North Dakota are Republican-only caucuses). Overall this group is whiter than the Southern states. Also, they contain a higher than national share of white college graduates except for Alaska and Wyoming. This second group of states only comprises 7 percent of the national electorate but serves as a counterbalance to the SEC primary states on Super Tuesday.
The rest of March brings an additional 18 states, representing 35 percent of the national electorate. March 15 is perhaps the key date, featuring five sizeable and politically meaningful states: Ohio and Missouri, relatively white Midwest states with substantial working class populations and with blacks as the largest minority group; Florida, a mostly urban state with an overrepresentation of Hispanics, blacks and seniors; and Illinois and North Carolina, two states that come closer than many to the national voter profile.
Illinois almost mirrors the national electorate when it comes to race, age and white college graduate/white working class shares of its population. Additionally, it contains a good mix of large urban cities and smaller communities. By itself, Illinois would be an exemplary primary state. North Carolina nearly approximates the nation in its minority share of the electorate, but has a greater black representation, a smaller Hispanic representation and more of its population outside large metropolitan areas.
After the results of the “big five” states of March 15 (preceded by Michigan on March 8) are in, we should have a good idea of how different demographic segments in politically significant parts of the South and Midwest weigh in on the candidates they prefer. States representing nearly 60 percent of the nation’s eligible voters will have been surveyed.
Late March will see delegates allocated from the very different Western states of Arizona, Utah and Washington. April will zero-in on several Atlantic Coast states (New York, Connecticut, Delaware, Maryland, Pennsylvania, and Rhode Island) as well as Wisconsin. The May-June period includes eight states dominated by the diverse giant California on June 7, as well as the diverse states of New Jersey and New Mexico. Thus the latter part of the primary season will provide a more in-depth look at how states with substantial Hispanic and Asian populations will perform among the candidates still standing.
Of course this demographic scorecard of eligible voters vastly overstates the much smaller number of citizens who will participate in the primaries, and who tend to be selective for each party. The 2014 General Social Survey (GSS) shows residents identifying as a strong Republican were 92 percent white, of whom 72 percent were over age 45. In both 2008 and 2012 whites constituted over 90 percent of voters in most Republican primaries. Among those identifying as strong Democrats in the GSS, 55 percent were racial minorities.
Nonetheless, selective voting will not be the same in states with different demographic profiles, nor will the issues at stake. It matters both who votes and where they vote. White working class voters of both parties in consequential states like Ohio and Florida can have very different candidate preferences than those in Iowa or New Hampshire. The fact that the February primaries take on such outsized significance with the media and campaign funders should be a cause for concern. Waiting until at least mid-March to arrive at crucial decisions would make the selection of each party’s candidate for president far more democratic.
The Brookings Institution is committed to quality, independence, and impact.
We are supported by a diverse array of funders. In line with our values and policies, each Brookings publication represents the sole views of its author(s).



Commentary
Op-edHow unrepresentative are the early presidential primary states?
February 3, 2016